 CA
 NZ
 UK
 AU
 IND

 US


…
NLI Holdings, Inc., through its subsidiaries, operates in the component products industry in Europe, North America, the Asia Pacific, and internationally. The company manufactures and sells mechanical and electronic cabinet locks and other locking mechanisms, including disc tumbler locks; pin tumbler locking mechanisms under KeSet, System 64, TuBar, and Turbine brands; and electronic locks under CompX eLock and StealthLock brands for use in various applications, such as mailboxes, ignition systems, file cabinets, desk drawers, tool storage cabinets, high security medical cabinetry, integrated inventory and access control secured narcotics boxes, electronic circuit panels, storage compartments, gas station security, vending, and cash containment machines. It also provides original equipment and aftermarket stainless steel exhaust headers, exhaust pipes, mufflers, and other exhaust components; gauges, such as GPS speedometers and tachometers; mechanical, electronic controls, and throttles; wake enhancement devices, trim tabs, steering wheels, and billet aluminum accessories; dash panels, LED indicators, wire harnesses; and grab handles, pin cleats, and other accessories for performance and ski/wakeboard and performance boats. In addition, the company produces and markets value-added titanium dioxide pigments, a base industrial product used in imparting whiteness, brightness, opacity, and durability to a diverse range of customer applications and end-use markets, including coatings, plastics, paper, inks, cosmetics, pharmaceuticals, and other industrial and consumer products. The company sells its component products directly to original equipment manufacturers, as well as through distributors. The company was formerly known as NL Industries, Inc. and changed its name to NLI Holdings, Inc. in May 2026. NL Holdings, Inc. was founded in 1891 and is based in Dallas, Texas. NLI Holdings, Inc. operates as a subsidiary of Valhi, Inc.
Source: TradingView
The charts and visual representations are sourced from TradingView through embedded widgets. For any issues with chart display, please visit the TradingView website
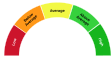
A unique technical analysis driven score developed by Kalkine showing momentum in stock prices based on select technical indicators identified.


| Breakdown | 2025-12-31 | 2024-12-31 | 2023-12-31 | 2022-12-31 | 2021-12-31 |
|---|---|---|---|---|---|
| Type | yearly | yearly | yearly | yearly | yearly |
| Date | 2025-12-31 | 2024-12-31 | 2023-12-31 | 2022-12-31 | 2021-12-31 |
| Income before tax | -51.42M | 83.32M | -6.42M | 39.20M | 60.90M |
| Minority interest | -2.46M | -2.03M | -2.64M | 2.61M | 2.17M |
| Net income | -37.83M | 67.23M | -2.31M | 33.80M | 51.20M |
| Selling general administrative | 26.71M | 25.55M | 25.15M | 35.07M | 32.20M |
| Selling and marketing expenses | - | - | 25.15M | -11.67M | - |
| Gross profit | 48.18M | 41.36M | 49.22M | 48.80M | 42.70M |
| Reconciled depreciation | 3.65M | 3.69M | 4.01M | 3.98M | 3.84M |
| Ebit | -50.66M | 83.85M | -5.67M | 44.32M | 41.96M |
| Ebitda | -47.01M | 107.84M | -1.70M | 48.30M | 45.80M |
| Depreciation and amortization | 3.65M | 23.99M | 3.97M | 3.98M | 3.84M |
| Non operating income net other | - | - | - | 27.59M | 52.16M |
| Operating income | 9.54M | 37.88M | 14.13M | 44.32M | 41.96M |
| Other operating expenses | 148.75M | 108.06M | 147.16M | 152.90M | 130.30M |
| Interest expense | 0.77M | 0.53M | 0.75M | 1.00M | 1.10M |
| Tax provision | -16.05M | 14.06M | -7.62M | 2.79M | 7.48M |
| Interest income | 7.00M | 10.98M | 8.29M | 26.64M | 51.01M |
| Net interest income | 6.23M | 10.45M | 7.50M | 2.80M | 0.46M |
| Income tax expense | -16.05M | 14.06M | -7.00M | 2.80M | 7.50M |
| Total revenue | 158.28M | 145.94M | 161.29M | 166.60M | 140.80M |
| Total operating expenses | 38.64M | 3.49M | 35.09M | 35.10M | 32.20M |
| Cost of revenue | 110.11M | 104.58M | 112.07M | 117.80M | 98.10M |
| Total other income expense net | -60.96M | 45.44M | -20.55M | -5.12M | 18.94M |
| Net income from continuing ops | -35.37M | 69.26M | -13.32M | 36.46M | 53.36M |
| Net income applicable to common shares | -37.83M | 67.23M | -2.31M | 33.84M | 51.19M |
| Breakdown | 2025-12-31 | 2024-12-31 | 2023-12-31 | 2022-12-31 | 2021-12-31 |
|---|---|---|---|---|---|
| Type | yearly | yearly | yearly | yearly | yearly |
| Date | 2025-12-31 | 2024-12-31 | 2023-12-31 | 2022-12-31 | 2021-12-31 |
| Total assets | 470.01M | 578.26M | 576.66M | 609.87M | 596.15M |
| Other current assets | 1.95M | 22.70M | 5.15M | 2.28M | 5.39M |
| Total liab | 93.22M | 162.35M | 184.90M | 207.12M | 211.18M |
| Total stockholder equity | 358.77M | 396.90M | 369.81M | 382.15M | 362.47M |
| Deferred long term liab | - | - | - | 50.12M | 44.06M |
| Other current liab | 17.09M | 87.30M | 27.30M | 28.52M | 27.19M |
| Common stock | 6.11M | 6.11M | 6.10M | 6.10M | 6.10M |
| Capital stock | 6.11M | 6.11M | 6.10M | 6.10M | 6.10M |
| Retained earnings | 249.38M | 315.06M | 284.46M | 300.44M | 297.35M |
| Other liab | - | - | - | 174.57M | 180.08M |
| Good will | 27.16M | 27.16M | 27.16M | 27.16M | 27.16M |
| Other assets | 0.93M | 16.39M | 29.00M | 28.29M | 28.23M |
| Cash | 113.74M | 163.15M | 111.52M | 68.87M | 147.00M |
| Cash and equivalents | 110.61M | 163.15M | 111.52M | 68.87M | 147.00M |
| Total current liabilities | 20.58M | 91.06M | 30.45M | 32.05M | 30.60M |
| Net debt | -113.24M | -162.65M | -111.02M | -68.37M | -146.50M |
| Short term debt | 0.00M | 0.00M | 0.00M | 0.00M | 0.00M |
| Short long term debt total | 0.50M | 0.50M | 0.50M | 0.50M | 0.50M |
| Other stockholder equity | 299.35M | 299.10M | 298.87M | 298.60M | 299.77M |
| Property plant equipment | 23.71M | 24.03M | 25.86M | 28.69M | 29.18M |
| Total current assets | 159.90M | 237.96M | 218.26M | 193.97M | 193.65M |
| Long term investments | 244.52M | 278.29M | 265.78M | 331.76M | 317.94M |
| Net tangible assets | - | - | - | 354.99M | 335.31M |
| Short term investments | - | 0.00M | 53.15M | 70.16M | - |
| Net receivables | 13.80M | 23.74M | 17.73M | 18.51M | 15.61M |
| Long term debt | 0.50M | 0.50M | 0.50M | 0.50M | 0.50M |
| Inventory | 30.41M | 28.37M | 30.71M | 31.29M | 25.64M |
| Accounts payable | 3.49M | 3.76M | 3.15M | 3.54M | 3.41M |
| Noncontrolling interest in consolidated entity | - | - | - | 20.60M | 22.50M |
| Accumulated other comprehensive income | -196.07M | -223.36M | -219.62M | -222.99M | -240.76M |
| Common stock total equity | - | - | - | 6.10M | 6.10M |
| Retained earnings total equity | - | - | - | 300.44M | 297.35M |
| Non currrent assets other | 0.62M | 10.82M | 39.60M | -8.63M | 26.87M |
| Non current assets total | 310.11M | 340.30M | 358.40M | 415.90M | 402.50M |
| Long term debt total | 0.50M | 0.50M | 0.50M | 0.50M | 0.50M |
| Breakdown | 2025-12-31 | 2024-12-31 | 2023-12-31 | 2022-12-31 | 2021-12-31 |
|---|---|---|---|---|---|
| Type | yearly | yearly | yearly | yearly | yearly |
| Date | 2025-12-31 | 2024-12-31 | 2023-12-31 | 2022-12-31 | 2021-12-31 |
| Investments | 0.00M | 58.87M | -75.87M | -64.46M | 10.80M |
| Change to liabilities | - | - | - | -11.06M | -9.11M |
| Total cashflows from investing activities | -2.44M | 58.87M | 22.10M | -67.87M | 6.71M |
| Total cash from financing activities | -31.30M | -41.63M | -15.23M | -36.80M | -14.35M |
| Change to operating activities | - | - | - | -1.02M | -1.36M |
| Net income | -35.37M | 69.26M | -2.31M | 36.46M | 53.36M |
| Change in cash | -69.96M | 42.81M | 43.88M | -77.74M | 9.97M |
| Begin period cash flow | 183.70M | 141.38M | 97.50M | 175.24M | 165.27M |
| End period cash flow | 113.74M | 184.19M | 141.38M | 97.50M | 175.24M |
| Total cash from operating activities | -36.40M | 25.57M | 37.00M | 26.93M | 17.61M |
| Depreciation | 3.65M | 3.69M | 3.97M | 3.98M | 3.84M |
| Other cashflows from investing activities | 1.31M | 60.30M | 2.60M | 0.28M | 0.00M |
| Dividends paid | 27.85M | 36.63M | 13.67M | -30.75M | -11.71M |
| Change to inventory | -2.33M | 2.13M | 0.33M | -5.83M | -7.48M |
| Change to account receivables | 9.92M | -6.68M | 0.75M | -2.27M | -4.49M |
| Sale purchase of stock | - | 0.00M | 0.00M | -1.74M | -1.31M |
| Other cashflows from financing activities | -3.45M | -5.00M | -1.55M | -4.30M | -1.32M |
| Change to netincome | - | - | - | 4.40M | -18.25M |
| Capital expenditures | 3.75M | 1.43M | 1.13M | 3.69M | 4.09M |
| Change receivables | - | - | - | -2.27M | -4.49M |
| Cash flows other operating | - | - | - | 0.36M | -1.38M |
| Cash and cash equivalents changes | - | - | - | -77.74M | 9.97M |
| Change in working capital | -63.34M | -42.08M | -12.89M | -19.52M | -22.71M |
| Stock based compensation | - | - | 11.54M | - | -25.42M |
| Other non cash items | 74.88M | -19.02M | 55.54M | 3.73M | 1.08M |
| Free cash flow | -40.15M | 24.14M | 35.87M | 23.24M | 13.52M |
Sector: Industrials Industry: Security & Protection Services
|
Stock Name
|
Change
(USD) |
Price
(USD) |
Trailing
PE (x) |
Forward
PE (x) |
Price Sales
TTM (x) |
Price to Book Value (x)
|
Enterprise Value
to Revenue (x) |
Enterprise Value
to EBITDA (x) |
|---|---|---|---|---|---|---|---|---|
| NL NLI Holdings, Inc. |
- -% |
7.34 | - | 26.25 | 2.12 | 0.95 | 1.47 | 8.86 |
| ASAZY Assa Abloy AB |
-0.02 0.10% |
19.69 | 28.39 | 22.62 | 2.76 | 4.14 | 3.19 | 16.63 |
| ASAZF ASSA ABLOY AB (publ) |
0.35 0.91% |
39.36 | 27.08 | 22.68 | 2.76 | 4.14 | 3.14 | 16.38 |
| SOMLF SECOM CO. LTD |
- -% |
44.06 | 23.76 | 14.37 | 0.01 | 2.00 | 1.64 | 7.85 |
| SOMLY Secom Co Ltd ADR |
0.09 0.82% |
11.00 | 22.80 | 3.61 | 0.01 | 1.94 | 1.64 | 7.85 |
NLI Holdings, Inc., through its subsidiaries, operates in the component products industry in Europe, North America, the Asia Pacific, and internationally. The company manufactures and sells mechanical and electronic cabinet locks and other locking mechanisms, including disc tumbler locks; pin tumbler locking mechanisms under KeSet, System 64, TuBar, and Turbine brands; and electronic locks under CompX eLock and StealthLock brands for use in various applications, such as mailboxes, ignition systems, file cabinets, desk drawers, tool storage cabinets, high security medical cabinetry, integrated inventory and access control secured narcotics boxes, electronic circuit panels, storage compartments, gas station security, vending, and cash containment machines. It also provides original equipment and aftermarket stainless steel exhaust headers, exhaust pipes, mufflers, and other exhaust components; gauges, such as GPS speedometers and tachometers; mechanical, electronic controls, and throttles; wake enhancement devices, trim tabs, steering wheels, and billet aluminum accessories; dash panels, LED indicators, wire harnesses; and grab handles, pin cleats, and other accessories for performance and ski/wakeboard and performance boats. In addition, the company produces and markets value-added titanium dioxide pigments, a base industrial product used in imparting whiteness, brightness, opacity, and durability to a diverse range of customer applications and end-use markets, including coatings, plastics, paper, inks, cosmetics, pharmaceuticals, and other industrial and consumer products. The company sells its component products directly to original equipment manufacturers, as well as through distributors. The company was formerly known as NL Industries, Inc. and changed its name to NLI Holdings, Inc. in May 2026. NL Holdings, Inc. was founded in 1891 and is based in Dallas, Texas. NLI Holdings, Inc. operates as a subsidiary of Valhi, Inc.

5430 LBJ FREEWAY, Dallas, TX, United States, 75240-2620

972 233 1700

2812
| Name | Title | Year Born |
|---|---|---|
| Ms. Courtney J. Riley | Pres, CEO & Director | 1966 |
| Ms. Amy Allbach Samford | Sr. VP & CFO | 1974 |
| Mr. John R. Powers III | VP & Gen. Counsel | 1973 |
| Mr. Andrew B. Nace | Exec. VP | 1965 |
| Mr. Bryan A. Hanley | VP & Treasurer | 1981 |
| Ms. Amy E. Ruf | VP & Controller | 1975 |
| Ms. Jane R. Grimm | Company Sec. | 1972 |
| Ms. Courtney J. Riley | President, CEO & Director | 1966 |
| Ms. Amy Allbach Samford | Executive VP & CFO | 1974 |
| Mr. John A. Sunny | Executive VP & Chief Information Officer | 1963 |
Disclaimer - (*)This information, including any data, is sourced from Unicorn Data Services SAS, trading as EOD Historical Data (“EODHD”) on an ‘as is’ basis, using their API. We cannot guarantee the completeness or validity of the information and data provided on this page, as well as via the API. In some cases, the data may include analyst ratings or recommendations sourced through the EODHD API, which are intended solely for general information purposes.
This information does not consider your personal objectives, financial situation, or needs. Kalkine is not liable for any errors or omissions in the information provided or for any actions taken in reliance on it. You should seek advice from a financial adviser, stockbroker or other professional adviser (including taxation and legal advice) as necessary before acting on this information.

Download a free report with stock ideas and industry insights for general information.
Download Free Report Now →


Basic Materials
 -1.40%
Communication Services
-0.45%

Consumer Cyclical
-0.55%

Consumer Defensive
-0.01%

Energy
-0.01%

Financial Services
-0.40%
Financials
-0.15%

Healthcare
-1.15%

Industrials
-0.46%

Real Estate
-0.29%

Technology
-1.22%

Utilities
-0.10%
Note: Daily price change (%) by sector excluding stocks with +/-90% daily price change. Companies above $500 million market capitalization are considered.
 Portfolio
 Watchlist


 +0.55%
 Please wait processing your request...