 CA
 NZ
 UK
 AU
 IND

 US


…
Methode Electronics, Inc. designs, engineers, and produces mechatronic products worldwide. It operates through four segments: Automotive, Industrial, Interface, and Medical. The Automotive segment supplies electronic and electro-mechanical devices, and related products to automobile original equipment manufacturers directly or through their tiered suppliers. Its products include integrated center consoles, hidden and ergonomic switches, transmission lead-frames, complex insert molded solutions, LED-based lighting solutions, and sensors, which incorporate magneto-elastic sensing, eddy current, or other sensing technologies that monitor the operation or status of a component or system. The Industrial segment manufactures external lighting solutions comprising driving, work, and signal lights; industrial safety radio remote controls; braided flexible cables; current-carrying laminated and powder-coated busbars; high-voltage high current connector and contracts; custom power-product assemblies, such as PowerRail solution; and high-current low-voltage flexible power cabling systems that are used in aerospace, cloud computing, commercial vehicles, construction equipment, industrial, military, power conversion, and transportation markets and applications. The Interface segment provides various copper-based transceivers and related accessories for the cloud computing hardware equipment and telecommunications broadband equipment markets; user interface solutions for the appliance, commercial food service, and point-of-sale equipment markets; and fluid-level sensors for the marine/recreational vehicle and sump pump markets. The Medical segment offers Dabir Surfaces, a surface support technology aimed at pressure injury prevention for use by patients who are immobilized or otherwise at risk for pressure injuries, including patients undergoing long-duration surgical procedures. Methode Electronics, Inc. was incorporated in 1946 and is headquartered in Chicago, Illinois.
Source: TradingView
The charts and visual representations are sourced from TradingView through embedded widgets. For any issues with chart display, please visit the TradingView website
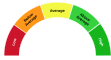
A unique technical analysis driven score developed by Kalkine showing momentum in stock prices based on select technical indicators identified.


| Breakdown | 2023-05-31 | 2022-05-31 | 2021-05-31 | 2020-05-31 | 2019-05-31 |
|---|---|---|---|---|---|
| Type | yearly | yearly | yearly | yearly | yearly |
| Date | 2023-05-31 | 2022-05-31 | 2021-05-31 | 2020-05-31 | 2019-05-31 |
| Income before tax | 90.10M | 118.50M | 134.90M | 148.70M | 103.60M |
| Minority interest | 0.00M | - | - | - | - |
| Net income | 77.10M | 102.20M | 122.30M | 123.40M | 91.60M |
| Selling general administrative | 154.90M | 134.10M | 126.90M | 116.68M | 8.90M |
| Selling and marketing expenses | - | - | 126.00M | 0.12M | 142.00M |
| Gross profit | 264.10M | 264.90M | 274.10M | 282.90M | 265.80M |
| Reconciled depreciation | 49.50M | 52.60M | 51.50M | 48.30M | 43.30M |
| Ebit | 90.40M | 111.70M | 127.90M | 147.10M | 106.80M |
| Ebitda | 142.30M | 174.60M | 191.60M | 207.10M | 150.10M |
| Depreciation and amortization | 51.90M | 62.90M | 63.70M | 60.00M | 43.30M |
| Non operating income net other | - | - | - | - | 5.10M |
| Operating income | 90.40M | 111.70M | 127.90M | 147.10M | 106.80M |
| Other operating expenses | 1089.20M | 1051.90M | 960.10M | 876.80M | 893.50M |
| Interest expense | 2.70M | 3.50M | 5.20M | 10.10M | 8.30M |
| Tax provision | 13.00M | 16.30M | 12.60M | 25.30M | 16.80M |
| Interest income | 2.70M | 1.60M | 4.90M | 13.20M | 8.30M |
| Net interest income | -2.70M | -3.50M | -5.20M | -10.10M | -8.30M |
| Extraordinary items | - | - | - | 0.00M | 4.80M |
| Income tax expense | 13.00M | 16.30M | 12.60M | 25.30M | 12.00M |
| Total revenue | 1179.60M | 1163.60M | 1088.00M | 1023.90M | 1000.30M |
| Total operating expenses | 173.70M | 153.20M | 146.20M | 135.80M | 159.00M |
| Cost of revenue | 915.50M | 898.70M | 813.90M | 741.00M | 734.50M |
| Total other income expense net | -0.30M | 6.80M | 7.00M | 1.60M | 5.10M |
| Net income from continuing ops | 77.10M | 102.20M | 122.30M | 123.40M | 91.60M |
| Net income applicable to common shares | 77.10M | 102.20M | 122.30M | 123.40M | 91.60M |
| Breakdown | 2023-05-31 | 2022-05-31 | 2021-05-31 | 2020-05-31 | 2019-05-31 |
|---|---|---|---|---|---|
| Type | yearly | yearly | yearly | yearly | yearly |
| Date | 2023-05-31 | 2022-05-31 | 2021-05-31 | 2020-05-31 | 2019-05-31 |
| Total assets | 1579.10M | 1389.10M | 1467.00M | 1370.60M | 1231.70M |
| Intangible assets | 256.70M | 207.70M | 229.40M | 244.80M | 264.90M |
| Other current assets | 20.50M | 16.90M | 22.60M | 15.90M | 20.00M |
| Total liab | 637.30M | 475.30M | 549.00M | 587.20M | 542.00M |
| Total stockholder equity | 941.80M | 913.80M | 918.00M | 783.40M | 689.70M |
| Deferred long term liab | - | 27.20M | 25.00M | 37.10M | 32.80M |
| Other current liab | 79.30M | 61.10M | 78.80M | 49.20M | 54.00M |
| Common stock | 18.60M | 19.20M | 19.80M | 19.20M | 19.20M |
| Capital stock | 18.60M | 19.20M | 19.80M | 19.20M | 19.20M |
| Retained earnings | 772.70M | 763.90M | 746.00M | 651.90M | 545.20M |
| Other liab | 72.40M | 74.40M | 82.90M | 85.30M | 84.20M |
| Good will | 301.90M | 233.00M | 235.60M | 231.60M | 233.30M |
| Other assets | 107.40M | 102.40M | 101.70M | 103.20M | 88.10M |
| Cash | 157.00M | 172.00M | 233.20M | 217.30M | 83.20M |
| Cash and equivalents | 157.00M | 172.00M | 233.20M | 217.30M | 83.20M |
| Total current liabilities | 228.00M | 188.60M | 222.70M | 143.80M | 180.90M |
| Current deferred revenue | - | - | - | - | 19.30M |
| Net debt | 178.40M | 59.30M | 30.50M | 160.70M | 209.40M |
| Short term debt | 10.00M | 19.00M | 21.00M | 20.80M | 15.70M |
| Short long term debt | 3.20M | 13.00M | 14.90M | 15.30M | 15.70M |
| Short long term debt total | 335.40M | 231.30M | 263.70M | 378.00M | 292.60M |
| Other stockholder equity | 169.50M | 157.50M | 146.10M | 139.20M | 138.90M |
| Property plant equipment | 248.70M | 217.00M | 226.30M | 225.40M | 191.90M |
| Total current assets | 664.40M | 629.00M | 674.00M | 565.60M | 453.50M |
| Net tangible assets | - | 473.10M | 453.00M | 307.00M | 191.50M |
| Net receivables | 327.20M | 281.60M | 294.00M | 201.40M | 233.60M |
| Long term debt | 303.60M | 197.50M | 225.20M | 336.80M | 276.90M |
| Inventory | 159.70M | 158.50M | 124.20M | 131.00M | 116.70M |
| Accounts payable | 138.70M | 108.50M | 122.90M | 73.80M | 91.90M |
| Accumulated other comprehensive income | -19.00M | -26.80M | 6.10M | -26.90M | -13.60M |
| Common stock total equity | - | - | 19.80M | 19.20M | 19.20M |
| Retained earnings total equity | - | - | - | 651.90M | 545.20M |
| Treasury stock | - | - | -11.50M | -11.50M | -11.50M |
| Non currrent assets other | 73.80M | 65.60M | 60.50M | 71.80M | 53.80M |
| Non current assets total | 914.70M | 760.10M | 793.00M | 805.00M | 778.20M |
| Capital lease obligations | 28.60M | 20.80M | 23.60M | 25.90M | - |
| Long term debt total | 303.60M | 197.50M | 225.20M | 336.80M | 276.90M |
| Breakdown | 2023-05-31 | 2022-05-31 | 2021-05-31 | 2020-05-31 | 2019-05-31 |
|---|---|---|---|---|---|
| Type | yearly | yearly | yearly | yearly | yearly |
| Date | 2023-05-31 | 2022-05-31 | 2021-05-31 | 2020-05-31 | 2019-05-31 |
| Investments | -153.10M | -37.40M | -24.80M | -44.50M | -470.80M |
| Change to liabilities | - | -8.70M | 59.50M | -47.50M | -23.10M |
| Total cashflows from investing activities | -153.10M | -37.40M | -24.80M | -44.50M | -470.80M |
| Net borrowings | - | -29.90M | -115.70M | 58.40M | 235.40M |
| Total cash from financing activities | 3.20M | -114.60M | -142.90M | 41.70M | 217.40M |
| Change to operating activities | - | -19.80M | 17.90M | -3.60M | -16.70M |
| Net income | 77.10M | 102.20M | 122.30M | 123.40M | 91.60M |
| Change in cash | -15.00M | -61.20M | 15.90M | 134.10M | -162.90M |
| Begin period cash flow | 172.00M | 233.20M | 217.30M | 83.20M | 246.10M |
| End period cash flow | 157.00M | 172.00M | 233.20M | 217.30M | 83.20M |
| Total cash from operating activities | 132.80M | 98.80M | 179.80M | 140.60M | 102.00M |
| Depreciation | 49.50M | 52.60M | 51.50M | 48.30M | 43.30M |
| Other cashflows from investing activities | -111.10M | 0.60M | 0.10M | 0.60M | -421.00M |
| Dividends paid | -19.80M | -20.40M | -17.40M | -16.30M | 16.30M |
| Change to inventory | 8.90M | -39.30M | 11.30M | -15.80M | -3.90M |
| Change to account receivables | -21.00M | -2.00M | -81.90M | 27.40M | 1.50M |
| Sale purchase of stock | -48.10M | -64.50M | -6.70M | 0.00M | 0.00M |
| Other cashflows from financing activities | -3.70M | 0.20M | -3.90M | 157.10M | 354.20M |
| Change to netincome | - | 13.10M | -1.50M | 8.10M | 9.40M |
| Capital expenditures | 42.00M | 38.00M | 24.90M | 45.10M | 49.80M |
| Change receivables | - | - | - | 27.40M | 1.50M |
| Cash flows other operating | - | - | - | -4.00M | -17.30M |
| Exchange rate changes | - | - | - | - | -11.50M |
| Cash and cash equivalents changes | - | - | - | 137.80M | -162.90M |
| Change in working capital | -3.50M | -69.80M | 6.80M | -39.50M | -42.20M |
| Stock based compensation | 11.50M | 11.80M | 6.80M | 0.30M | 14.00M |
| Other non cash items | 2.80M | 4.10M | 2.00M | 0.10M | -0.30M |
| Free cash flow | 90.80M | 60.80M | 154.90M | 95.50M | 52.20M |
Sector: Technology Industry: Electronic Components
|
Stock Name
|
Change
(USD) |
Price
(USD) |
Trailing
PE (x) |
Forward
PE (x) |
Price Sales
TTM (x) |
Price to Book Value (x)
|
Enterprise Value
to Revenue (x) |
Enterprise Value
to EBITDA (x) |
|---|---|---|---|---|---|---|---|---|
| MEI Methode Electronics Inc |
-0.71 4.60% |
14.72 | - | 47.85 | 0.67 | 0.93 | 0.88 | 26.06 |
| APH Amphenol Corporation |
-2.78 3.39% |
79.30 | 45.49 | 34.25 | 8.09 | 13.93 | 8.26 | 27.70 |
| GLW Corning Incorporated |
-5.57 4.32% |
123.31 | 89.92 | 53.19 | 9.09 | 12.03 | 9.59 | 40.14 |
| HNHPF Hon Hai Precision Industry Co Ltd ADR |
-0.33 2.15% |
15.00 | 16.20 | 11.34 | 0.01 | 1.82 | 0.35 | 6.73 |
| MRAAF Murata Manufacturing Co. Ltd |
-5.31 11.89% |
39.32 | 59.07 | 33.56 | 0.05 | 4.71 | 6.76 | 25.24 |
Methode Electronics, Inc. designs, engineers, and produces mechatronic products worldwide. It operates through four segments: Automotive, Industrial, Interface, and Medical. The Automotive segment supplies electronic and electro-mechanical devices, and related products to automobile original equipment manufacturers directly or through their tiered suppliers. Its products include integrated center consoles, hidden and ergonomic switches, transmission lead-frames, complex insert molded solutions, LED-based lighting solutions, and sensors, which incorporate magneto-elastic sensing, eddy current, or other sensing technologies that monitor the operation or status of a component or system. The Industrial segment manufactures external lighting solutions comprising driving, work, and signal lights; industrial safety radio remote controls; braided flexible cables; current-carrying laminated and powder-coated busbars; high-voltage high current connector and contracts; custom power-product assemblies, such as PowerRail solution; and high-current low-voltage flexible power cabling systems that are used in aerospace, cloud computing, commercial vehicles, construction equipment, industrial, military, power conversion, and transportation markets and applications. The Interface segment provides various copper-based transceivers and related accessories for the cloud computing hardware equipment and telecommunications broadband equipment markets; user interface solutions for the appliance, commercial food service, and point-of-sale equipment markets; and fluid-level sensors for the marine/recreational vehicle and sump pump markets. The Medical segment offers Dabir Surfaces, a surface support technology aimed at pressure injury prevention for use by patients who are immobilized or otherwise at risk for pressure injuries, including patients undergoing long-duration surgical procedures. Methode Electronics, Inc. was incorporated in 1946 and is headquartered in Chicago, Illinois.

8750 West Bryn Mawr Avenue, Chicago, IL, United States, 60631-3518

708 867 6777

6700
| Name | Title | Year Born |
|---|---|---|
| Mr. Donald W. Duda | Pres, CEO & Director | 1955 |
| Mr. Ronald L.G. Tsoumas | VP of Corp. Fin. & CFO | 1961 |
| Mr. Joseph E. Khoury | Chief Operating Officer | 1964 |
| Ms. Andrea Jean Barry | Chief Admin. Officer | 1963 |
| Mr. Kevin Michael Martin | VP of North America | 1966 |
| Mr. Amit N. Patel | Chief Accounting Officer | NA |
| Mr. Robert K. Cherry | VP of Investor Relations | NA |
| Kerry A. Vyverberg | Gen. Counsel | NA |
| Ms. Kristine Walczak | VP of Corp. Communications | NA |
| Mr. Mark Shermetaro | VP of Corp. Devel. | NA |
Disclaimer - (*)This information, including any data, is sourced from Unicorn Data Services SAS, trading as EOD Historical Data (“EODHD”) on an ‘as is’ basis, using their API. We cannot guarantee the completeness or validity of the information and data provided on this page, as well as via the API. In some cases, the data may include analyst ratings or recommendations sourced through the EODHD API, which are intended solely for general information purposes.
This information does not consider your personal objectives, financial situation, or needs. Kalkine is not liable for any errors or omissions in the information provided or for any actions taken in reliance on it. You should seek advice from a financial adviser, stockbroker or other professional adviser (including taxation and legal advice) as necessary before acting on this information.

Download a free report with stock ideas and industry insights for general information.
Download Free Report Now →


Basic Materials
 -1.82%
Communication Services
-0.22%

Consumer Cyclical
-0.13%

Consumer Defensive
 +0.32%

Energy
+0.15%

Financial Services
-0.85%
Financials
+2.34%

Healthcare
-1.28%

Industrials
-0.96%

Real Estate
-0.38%

Technology
-2.73%

Utilities
-0.31%
Note: Daily price change (%) by sector excluding stocks with +/-90% daily price change. Companies above $500 million market capitalization are considered.
 Portfolio
 Watchlist


 Please wait processing your request...