 CA
 NZ
 UK
 AU
 IND

 US


…
KB Financial Group Inc. provides financial products and services in South Korea, the United States, New Zealand, China, Cambodia, the United Kingdom, Indonesia, and internationally. The company offers deposit products, such as demand and time deposits, certificates of deposit, foreign currency deposits, and savings deposits for housing subscription; loan products, including mortgage loans to finance home purchases, construction, improvements, or rentals; and home equity loans, overdraft loans, and other consumer loans. It also provides debit and credit cards; working capital loans and facility loans; mortgage loans to home builders or developers; securities underwriting; financing and financial advisory services for mergers and acquisitions; project finance and financial advisory services for social overhead capital projects such as highway, port, power, water, and sewage projects; financing and financial advisory services for real estate development projects; and structured finance. In addition, the company offers brokerage services for stocks, futures, options, equity, derivative-linked securities, and debt instruments; foreign exchange services and derivatives dealing; import and export-related services; offshore lending, syndicated loans, and foreign currency securities investment; and trust account management services. Further, it provides long-term insurance products, automobile insurance products, and general property and casualty insurance products; life insurance comprising annuities, savings insurance, variable life insurance, whole life insurance, term life insurance, and health insurance; bancassurance; consumer finance services; and mortgage financing and construction loans. Additionally, the company is involved in real estate trust management; capital investment; and software advisory, development, and supply. KB Financial Group Inc. was founded in 1963 and is headquartered in Seoul, South Korea.
Source: TradingView
The charts and visual representations are sourced from TradingView through embedded widgets. For any issues with chart display, please visit the TradingView website
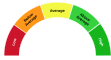
A unique technical analysis driven score developed by Kalkine showing momentum in stock prices based on select technical indicators identified.
KB Financial Group is a major South Korean bank holding company operating retail and corporate banking, insurance, securities and asset management through subsidiaries such as KB Kookmin Bank. Long-term growth drivers include scale in Korea's retail market, expanding fee income from wealth and insurance businesses, digital banking initiatives and regional expansion, which could support a more diversified revenue mix. Investors may find the company attractive for its broad franchise, large deposit base and multiple fee-generating businesses.
Principal risks include sensitivity to South Korea's macro cycle and high household debt that could increase credit losses, margin pressure from interest-rate shifts, intense domestic competition and regulatory changes that may weigh on earnings.

Note: The summary and risk score provided above is created by AI and should not be construed as a recommendation of Kalkine.


| Breakdown | 2025-12-31 | 2024-12-31 | 2023-12-31 | 2022-12-31 | 2021-12-31 |
|---|---|---|---|---|---|
| Type | yearly | yearly | yearly | yearly | yearly |
| Date | 2025-12-31 | 2024-12-31 | 2023-12-31 | 2022-12-31 | 2021-12-31 |
| Income before tax | 8196679.00M | 6985247.00M | 6120151.00M | 5795626.00M | 6081606.00M |
| Minority interest | -7553.00M | 49615.00M | 253822.00M | 221591.00M | 25162.00M |
| Net income | 5850527.00M | 5078221.00M | 4594835.00M | 4394830.00M | 4409543.00M |
| Selling general administrative | 7051040.00M | 5844730.00M | 5618479.00M | 7537802.00M | 5768959.00M |
| Selling and marketing expenses | - | 230656.00M | 230192.00M | 227991.00M | 210187.00M |
| Gross profit | 24864872.00M | 18060034.00M | 16304237.00M | 16683025.07M | 17037416.00M |
| Reconciled depreciation | 914686.00M | 916295.00M | 865927.00M | 1016458.00M | 1006688.00M |
| Ebit | 8531244.00M | 6985247.00M | 6120151.00M | -1012044.67M | 6106768.00M |
| Ebitda | 9445930.00M | 7901542.00M | 6986078.00M | 4413.33M | 7113456.00M |
| Depreciation and amortization | 914686.00M | 916295.00M | 865927.00M | 1016458.00M | 1006688.00M |
| Operating income | 8531244.00M | 6985247.00M | 6120151.00M | -1012044.67M | 6106768.00M |
| Other operating expenses | 42155128.00M | 30783744.00M | 30291659.00M | 7723331.00M | 5943174.00M |
| Interest expense | 13073093.00M | 17664671.00M | 16961164.00M | 7675584.00M | 3981306.00M |
| Tax provision | 2346152.00M | 1956641.00M | 1798890.00M | 1629056.00M | 1697225.00M |
| Interest income | 29156100.00M | 30491385.00M | 27825537.00M | 20788518.00M | 15210878.00M |
| Net interest income | 13073093.00M | 12826714.00M | 13558954.00M | 13112934.00M | 11229572.00M |
| Income tax expense | 2346152.00M | 1956641.00M | 1593817.00M | 1622387.00M | 1697225.00M |
| Total revenue | 50686372.00M | 37768991.00M | 36411810.00M | 16683025.07M | 17037416.00M |
| Total operating expenses | 16333628.00M | 11074787.00M | 10184086.00M | 7723331.00M | 5943174.00M |
| Cost of revenue | 25821500.00M | 19708957.00M | 20107573.00M | - | - |
| Total other income expense net | -334565.00M | -1409070.00M | -568808.00M | 6807670.67M | -25162.00M |
| Net income from continuing ops | 5840715.00M | 5028606.00M | 4473167.00M | 5820.79M | 4384381.00M |
| Net income applicable to common shares | 5842974.00M | 4878421.74M | 4409919.79M | 4413327.00M | 4409559.00M |
| Breakdown | 2025-12-31 | 2024-12-31 | 2023-12-31 | 2022-12-31 | 2021-12-31 |
|---|---|---|---|---|---|
| Type | yearly | yearly | yearly | yearly | yearly |
| Date | 2025-12-31 | 2024-12-31 | 2023-12-31 | 2022-12-31 | 2021-12-31 |
| Total assets | 797923033.00M | 757845532.00M | 715725416.00M | 701170848.00M | 663895834.00M |
| Intangible assets | 1609427.00M | 1092636.00M | 1083884.00M | 2355244.00M | 2459950.00M |
| Earning assets | - | - | - | - | 184234435.00M |
| Other current assets | - | 654346.00M | 626922.00M | 9396021.00M | 452979003.00M |
| Total liab | -61371093.00M | 698030351.00M | 657089226.00M | 651527934.00M | 105808821.00M |
| Total stockholder equity | 61371093.00M | 57888952.00M | 56692684.00M | 48362812.00M | 47460582.00M |
| Other current liab | - | 440170532.00M | 411484789.00M | 3457688.00M | 12751652.00M |
| Common stock | 2090558.00M | 2090558.00M | 2090558.00M | 2090558.00M | 2090558.00M |
| Capital stock | 2090558.00M | 2090558.00M | 2090558.00M | 2090558.00M | 2090558.00M |
| Retained earnings | 38343553.00M | 34808220.00M | 31934600.00M | 28466513.00M | 25672815.00M |
| Other liab | - | - | - | 87929233.00M | 102800908.00M |
| Good will | 633665.00M | 874048.00M | 866974.00M | 845155.00M | 806407.00M |
| Other assets | 815534.00M | 674162.00M | -339242716.00M | 420204441.00M | 381838378.00M |
| Cash | 35649807.00M | 30792747.00M | 30787443.00M | 32063421.00M | 32052164.00M |
| Total current liabilities | - | 453009763.00M | 427624973.00M | 204690.00M | 388457828.00M |
| Current deferred revenue | - | - | 594023.00M | - | - |
| Net debt | 94897980.00M | 109978223.00M | 106253689.00M | 108352148.00M | 71415248.00M |
| Short term debt | - | 12803106.00M | 15652135.00M | - | - |
| Short long term debt total | - | 140770970.00M | 137041132.00M | 140415569.00M | 103467412.00M |
| Other stockholder equity | 1788803.00M | 20493252.00M | 20514882.00M | 20518794.00M | 18642264.00M |
| Property plant equipment | 5133801.00M | 5390015.00M | 4945699.00M | 8112916.00M | 5239898.00M |
| Total current assets | - | 137914963.00M | 128356719.00M | 90567952.00M | 101178553.00M |
| Long term investments | 224582114.00M | 210741881.00M | 199162111.00M | 182206589.00M | 171302404.00M |
| Net tangible assets | - | - | - | 45162413.00M | 44194081.00M |
| Short term investments | 99919485.00M | 93895912.00M | 82498140.00M | 58299841.00M | 60376243.00M |
| Net receivables | - | 12571958.00M | 14444214.00M | 204690.00M | 8750146.00M |
| Long term debt | 150777666.00M | 127003465.00M | 120800194.00M | 140415569.00M | 124342562.00M |
| Inventory | - | - | -40270802.00M | - | - |
| Accounts payable | 38214.00M | 36125.00M | 36005.00M | 388888452.00M | 372023918.00M |
| Accumulated other comprehensive income | 59582290.00M | 496922.00M | 2152644.00M | -2713053.00M | 1054945.00M |
| Treasury stock | - | - | - | - | -1136188.00M |
| Non currrent assets other | - | 9585523.00M | 10165224.00M | -251085.00M | -180878903.00M |
| Non current assets total | - | 619930569.00M | 587368697.00M | 190398455.00M | 180878903.00M |
| Capital lease obligations | 901113.00M | 964399.00M | 588803.00M | 592697.00M | 578808.00M |
| Long term debt total | 150777666.00M | 129568849.00M | 120441355.00M | 140415569.00M | 108868841.00M |
| Breakdown | 2025-12-31 | 2024-12-31 | 2023-12-31 | 2022-12-31 | 2021-12-31 |
|---|---|---|---|---|---|
| Type | yearly | yearly | yearly | yearly | yearly |
| Date | 2025-12-31 | 2024-12-31 | 2023-12-31 | 2022-12-31 | 2021-12-31 |
| Investments | -5670913.00M | -3825055.00M | -3519492.00M | -20285715.00M | -3856014.00M |
| Change to liabilities | - | - | - | -244196.00M | 201163.00M |
| Total cashflows from investing activities | -5537899.00M | -3825055.00M | -3519492.00M | -20285715.00M | -3856014.00M |
| Net borrowings | 7236429.00M | 513724.00M | -2363903.00M | 15388180.00M | 11958915.00M |
| Total cash from financing activities | 5797923.00M | -1983837.00M | -1239069.00M | 15318243.00M | 10821398.00M |
| Change to operating activities | - | - | - | -23466119.00M | -43132174.00M |
| Net income | 5842974.00M | 5028606.00M | 4526334.00M | 4173239.00M | 4384381.00M |
| Change in cash | 4411697.00M | -1217721.00M | -708210.00M | 889251.00M | 423368.00M |
| Begin period cash flow | 24608867.00M | 25826588.00M | 26534798.00M | 25273273.00M | 8685092.00M |
| End period cash flow | 29020564.00M | 24608867.00M | 25826588.00M | 26162524.00M | 9108460.00M |
| Total cash from operating activities | 4226378.00M | 4020186.00M | 4108816.00M | 5686084.00M | -6700265.00M |
| Depreciation | 914686.00M | 916295.00M | 865927.00M | 1016458.00M | 1006688.00M |
| Other cashflows from investing activities | 731322.00M | -471076.00M | -1828072.00M | -19751520.00M | -3377705.00M |
| Dividends paid | 1302291.00M | 1486978.00M | 1151900.00M | -1437751.00M | -981879.00M |
| Change to account receivables | -48734.00M | -95539.00M | -39627.00M | - | - |
| Sale purchase of stock | -1500067.36M | -820000.00M | -571745.00M | - | 0.00M |
| Other cashflows from financing activities | 1363852.36M | -190583.00M | 2848479.00M | 123644777.00M | 129566110.00M |
| Change to netincome | - | - | - | 4068179.00M | 4518723.00M |
| Capital expenditures | 554969.00M | 626909.00M | 680565.00M | 534195.00M | 478309.00M |
| Change in working capital | 4966358.00M | 3091952.00M | 1804838.00M | -3793383.00M | -16635219.00M |
| Stock based compensation | 153882.00M | 140453.00M | 69703.00M | 58275.00M | 101935.00M |
| Other non cash items | -7651522.00M | -5157120.00M | -3157986.00M | 4231495.00M | 3739042.00M |
| Free cash flow | 3671409.00M | 3393277.00M | 3428251.00M | 5151889.00M | -7178574.00M |
Sector: Financial Services Industry: Banks - Regional
|
Stock Name
|
Change
(USD) |
Price
(USD) |
Trailing
PE (x) |
Forward
PE (x) |
Price Sales
TTM (x) |
Price to Book Value (x)
|
Enterprise Value
to Revenue (x) |
|---|---|---|---|---|---|---|---|
| KB KB Financial Group Inc |
-1.82 1.59% |
112.70 | 10.33 | 3.85 | 0.00 | 1.03 | 9.13 |
| DBSDY DBS Group Holdings Ltd ADR |
-2.42 1.05% |
227.80 | 20.00 | 17.57 | 7.54 | 3.17 | 13.19 |
| CIHHF China Merchants Bank Co Ltd Class H |
- -% |
6.66 | 7.70 | 7.10 | 0.55 | 0.83 | 3.51 |
| CIHKY China Merchants Bank Co Ltd |
1.20 3.58% |
34.75 | 7.79 | 7.20 | 0.55 | 0.85 | 3.51 |
| UNCFF UniCredit SpA |
-0.02 0.02% |
82.05 | 11.53 | 10.27 | 5.72 | 1.83 | 8.22 |
KB Financial Group Inc. provides financial products and services in South Korea, the United States, New Zealand, China, Cambodia, the United Kingdom, Indonesia, and internationally. The company offers deposit products, such as demand and time deposits, certificates of deposit, foreign currency deposits, and savings deposits for housing subscription; loan products, including mortgage loans to finance home purchases, construction, improvements, or rentals; and home equity loans, overdraft loans, and other consumer loans. It also provides debit and credit cards; working capital loans and facility loans; mortgage loans to home builders or developers; securities underwriting; financing and financial advisory services for mergers and acquisitions; project finance and financial advisory services for social overhead capital projects such as highway, port, power, water, and sewage projects; financing and financial advisory services for real estate development projects; and structured finance. In addition, the company offers brokerage services for stocks, futures, options, equity, derivative-linked securities, and debt instruments; foreign exchange services and derivatives dealing; import and export-related services; offshore lending, syndicated loans, and foreign currency securities investment; and trust account management services. Further, it provides long-term insurance products, automobile insurance products, and general property and casualty insurance products; life insurance comprising annuities, savings insurance, variable life insurance, whole life insurance, term life insurance, and health insurance; bancassurance; consumer finance services; and mortgage financing and construction loans. Additionally, the company is involved in real estate trust management; capital investment; and software advisory, development, and supply. KB Financial Group Inc. was founded in 1963 and is headquartered in Seoul, South Korea.
| Name | Title | Year Born |
|---|---|---|
| Dr. Jong-Kyoo Yoon Ph.D. | Chairman & CEO | 1955 |
| Mr. Pil-Kyu Im | Sr. EVP & Chief Risk Management Officer | 1964 |
| Jieon Kim | Head of Model Validation Unit | NA |
| Jeong Soo Lee | Gen. Mang. of Secretariat | NA |
| Mr. Young Ho Seo | Sr. MD & Chief Fin. Officer | 1966 |
| Mr. Dong Whan Han | Sr. EVP & Head of KB Research | 1965 |
| Mr. Bong Joong Kweon | MD & Head of IR Department | 1969 |
| Ms. Hye Ja Suh | MD & Chief Compliance Officer | 1966 |
| Mr. Young-Jin Kim | Chief Public Relation Officer | 1949 |
| Mr. Jin Young Kim | Chief Public Relation Officer | 1969 |
Disclaimer - (*)This information, including any data, is sourced from Unicorn Data Services SAS, trading as EOD Historical Data (“EODHD”) on an ‘as is’ basis, using their API. We cannot guarantee the completeness or validity of the information and data provided on this page, as well as via the API. In some cases, the data may include analyst ratings or recommendations sourced through the EODHD API, which are intended solely for general information purposes.
This information does not consider your personal objectives, financial situation, or needs. Kalkine is not liable for any errors or omissions in the information provided or for any actions taken in reliance on it. You should seek advice from a financial adviser, stockbroker or other professional adviser (including taxation and legal advice) as necessary before acting on this information.

Download a free report with stock ideas and industry insights for general information.
Download Free Report Now →


Basic Materials
 -1.82%
Communication Services
-0.22%

Consumer Cyclical
-0.13%

Consumer Defensive
 +0.32%

Energy
+0.15%

Financial Services
-0.85%
Financials
+2.34%

Healthcare
-1.28%

Industrials
-0.96%

Real Estate
-0.38%

Technology
-2.73%

Utilities
-0.31%
Note: Daily price change (%) by sector excluding stocks with +/-90% daily price change. Companies above $500 million market capitalization are considered.
 Portfolio
 Watchlist


 Please wait processing your request...