 CA
 NZ
 UK
 AU
 IND

 US


…
Hexcel Corporation develops, manufactures, and markets advanced lightweight composites technology. It operates through two segments, Composite Materials and Engineered Products. The company offers carbon fiber, reinforcements, prepregs and other fiber-reinforced matrix materials, honeycomb, resins, engineered core and composite structures for use in commercial aerospace, defense and space, and industrial applications. The Composite Materials segment manufactures and markets carbon fibers, fabrics, multi-axials, specialty reinforcements, prepregs and other fiber-reinforced matrix materials, structural adhesives, honeycomb, molding compounds, tooling materials, polyurethane systems, and laminates that are used in military aircraft, transportation, recreational products, and other industrial applications. The Engineered Products segment manufactures and markets aircraft structures and finished aircraft components, including wing to body fairings, wing panels, flight deck panels, door liners, rotorcraft blades, spars, and tip caps; and aircraft structural sub-components and semi-finished components used in rotorcraft blades, engine nacelles, and aircraft surfaces, such as flaps, wings, elevators, and fairings; and RF interference control products for military and aerospace applications. This segment also provides interference control materials, structural composites, and services; dielectric absorber foams; magnetic absorbers; and thermoplastics for commercial and defense applications. The company sells its products directly through its marketing managers, product managers, and sales personnel, as well as through independent distributors in the Americas, Europe, the Asia Pacific, India, and Africa. Hexcel Corporation was founded in 1946 and is headquartered in Stamford, Connecticut.
Source: TradingView
The charts and visual representations are sourced from TradingView through embedded widgets. For any issues with chart display, please visit the TradingView website
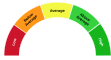
A unique technical analysis driven score developed by Kalkine showing momentum in stock prices based on select technical indicators identified.
Hexcel manufactures advanced composite materials—carbon fiber reinforcements, prepregs and engineered core—used in aerospace, renewable energy and industrial markets. Growth drivers include higher composite content in new aircraft, recovery in air travel and aftermarket demand, and expansion of wind-turbine and defense applications. It appears positioned to benefit from scale, engineering capabilities and OEM relationships, though investors should monitor execution of capacity expansions.
Key investment risks include cyclicality tied to commercial aerospace production, customer concentration with large OEMs, raw-material and manufacturing cost volatility, and competition from global composite producers.

Note: The summary and risk score provided above is created by AI and should not be construed as a recommendation of Kalkine.


| Breakdown | 2025-12-31 | 2024-12-31 | 2023-12-31 | 2022-12-31 | 2021-12-31 |
|---|---|---|---|---|---|
| Type | yearly | yearly | yearly | yearly | yearly |
| Date | 2025-12-31 | 2024-12-31 | 2023-12-31 | 2022-12-31 | 2021-12-31 |
| Income before tax | 135.00M | 154.90M | 109.70M | 149.80M | 22.00M |
| Net income | 109.40M | 132.10M | 105.70M | 126.30M | 16.10M |
| Selling general administrative | 169.00M | 176.60M | 162.70M | 148.00M | 135.00M |
| Gross profit | 434.80M | 469.80M | 433.20M | 357.10M | 250.10M |
| Reconciled depreciation | 122.30M | 124.00M | 124.50M | 126.20M | 138.00M |
| Ebit | 172.70M | 236.10M | 215.30M | 175.20M | 51.80M |
| Ebitda | 295.00M | 360.10M | 215.30M | 312.20M | 198.30M |
| Depreciation and amortization | 122.30M | 124.00M | 124.80M | 137.00M | 146.50M |
| Non operating income net other | - | - | - | 18.90M | -8.50M |
| Operating income | 171.60M | 186.10M | 215.30M | 175.20M | 51.80M |
| Other operating expenses | 1722.30M | 1716.90M | 1572.30M | 1402.50M | 1272.90M |
| Interest expense | 37.70M | 31.20M | 34.00M | 36.20M | 38.30M |
| Tax provision | 25.60M | 22.80M | 29.90M | 31.60M | 5.90M |
| Interest income | 37.70M | 31.20M | 34.00M | 36.20M | 38.30M |
| Net interest income | -37.70M | -31.20M | -35.60M | -36.20M | -38.30M |
| Extraordinary items | - | - | - | - | -1.40M |
| Income tax expense | 25.60M | 22.80M | 12.10M | 31.60M | 5.90M |
| Total revenue | 1893.90M | 1903.00M | 1789.00M | 1577.70M | 1324.70M |
| Total operating expenses | 263.20M | 283.70M | 216.50M | 181.90M | 198.30M |
| Cost of revenue | 1459.10M | 1433.20M | 1355.80M | 1220.60M | 1074.60M |
| Total other income expense net | -36.60M | -31.20M | -105.60M | -25.40M | -29.80M |
| Net income from continuing ops | 109.40M | 132.10M | 160.90M | 126.30M | 16.10M |
| Net income applicable to common shares | 109.40M | 132.10M | 105.70M | 126.30M | 16.10M |
| Breakdown | 2025-12-31 | 2024-12-31 | 2023-12-31 | 2022-12-31 | 2021-12-31 |
|---|---|---|---|---|---|
| Type | yearly | yearly | yearly | yearly | yearly |
| Date | 2025-12-31 | 2024-12-31 | 2023-12-31 | 2022-12-31 | 2021-12-31 |
| Total assets | 2704.00M | 2725.60M | 2918.50M | 2837.30M | 2819.40M |
| Intangible assets | 48.20M | 50.50M | 62.60M | 256.00M | 77.00M |
| Other current assets | 45.70M | 58.10M | 43.00M | 38.90M | 39.50M |
| Total liab | 1453.30M | 1197.70M | 1202.00M | 1283.10M | 1333.90M |
| Total stockholder equity | 1250.70M | 1527.90M | 1716.50M | 1554.20M | 1485.50M |
| Deferred long term liab | - | - | - | 126.40M | 140.00M |
| Other current liab | 176.10M | 205.00M | 149.30M | 174.10M | 5.70M |
| Common stock | 1.10M | 1.10M | 1.10M | 1.10M | 1.10M |
| Capital stock | 1.10M | 1.10M | 1.10M | 1.10M | 1.10M |
| Retained earnings | 2307.00M | 2251.50M | 2168.70M | 2104.90M | 2012.50M |
| Other liab | - | - | - | 190.60M | 263.90M |
| Good will | 191.60M | 186.50M | 188.70M | - | 190.50M |
| Other assets | 117.00M | 80.00M | 90.00M | 141.50M | 144.90M |
| Cash | 71.00M | 125.40M | 227.00M | 112.00M | 127.70M |
| Cash and equivalents | 71.00M | 125.40M | 227.00M | 112.00M | 127.70M |
| Total current liabilities | 322.70M | 353.50M | 315.90M | 329.80M | 247.60M |
| Current deferred revenue | - | - | 150.70M | - | 127.80M |
| Net debt | 922.00M | 600.70M | 501.90M | 611.50M | 695.60M |
| Short term debt | 0.00M | 6.20M | 7.50M | 0.20M | 0.90M |
| Short long term debt total | 993.00M | 726.10M | 728.90M | 723.50M | 823.30M |
| Other stockholder equity | -1044.50M | -609.70M | -379.20M | -377.40M | -401.60M |
| Property plant equipment | 1611.50M | 1622.10M | 1708.00M | 1657.80M | 1746.10M |
| Total current assets | 730.70M | 781.50M | 864.20M | 734.40M | 616.30M |
| Long term investments | 5.00M | 5.00M | 5.00M | 47.60M | 44.60M |
| Net tangible assets | - | - | - | 1298.20M | 1218.00M |
| Short term investments | - | - | 4.30M | - | - |
| Net receivables | 285.20M | 241.80M | 259.80M | 254.70M | 190.80M |
| Long term debt | 993.00M | 698.70M | 697.70M | 723.30M | 822.40M |
| Inventory | 328.80M | 356.20M | 334.40M | 319.30M | 245.70M |
| Accounts payable | 146.60M | 142.30M | 159.10M | 155.50M | 113.20M |
| Accumulated other comprehensive income | -12.90M | -115.00M | -74.10M | -174.40M | -126.50M |
| Common stock total equity | - | - | - | 1.10M | 1.10M |
| Retained earnings total equity | - | - | - | 2104.90M | 2012.50M |
| Treasury stock | - | - | - | -1282.40M | -1280.20M |
| Non currrent assets other | 47.90M | 105.40M | 119.30M | 15.10M | 4.90M |
| Non current assets total | 1973.30M | 1944.10M | 2054.30M | 2102.90M | 2203.10M |
| Capital lease obligations | 2.10M | 2.00M | 1.80M | 0.20M | 0.90M |
| Long term debt total | 993.00M | 700.60M | 699.40M | 723.30M | 822.40M |
| Breakdown | 2025-12-31 | 2024-12-31 | 2023-12-31 | 2022-12-31 | 2021-12-31 |
|---|---|---|---|---|---|
| Type | yearly | yearly | yearly | yearly | yearly |
| Date | 2025-12-31 | 2024-12-31 | 2023-12-31 | 2022-12-31 | 2021-12-31 |
| Investments | 0.00M | -87.00M | -99.60M | -54.60M | -27.90M |
| Change to liabilities | - | - | - | 80.80M | 49.80M |
| Total cashflows from investing activities | -76.00M | -87.00M | -50.70M | -54.60M | -27.90M |
| Net borrowings | 290.80M | 0.30M | -25.20M | -100.00M | -103.90M |
| Total cash from financing activities | -212.30M | -301.70M | -92.60M | -130.00M | -96.80M |
| Change to operating activities | - | - | - | -5.70M | 15.00M |
| Net income | 109.40M | 132.10M | 105.70M | 126.30M | 16.10M |
| Change in cash | -54.40M | -101.60M | 115.00M | -15.70M | 24.40M |
| Begin period cash flow | 125.40M | 227.00M | 112.00M | 127.70M | 103.30M |
| End period cash flow | 71.00M | 125.40M | 227.00M | 112.00M | 127.70M |
| Total cash from operating activities | 230.50M | 289.90M | 257.10M | 173.10M | 151.70M |
| Depreciation | 122.30M | 124.30M | 124.80M | 126.20M | 138.00M |
| Other cashflows from investing activities | -150.00M | -168.10M | 10.30M | 21.70M | 0.00M |
| Dividends paid | 53.90M | 49.30M | 42.20M | -33.70M | 33.70M |
| Change to inventory | 45.40M | -34.00M | -8.90M | -82.40M | -40.40M |
| Change to account receivables | -22.50M | 10.70M | -8.90M | -62.80M | -40.70M |
| Sale purchase of stock | -454.30M | -252.20M | -30.10M | 0.00M | 0.00M |
| Other cashflows from financing activities | 5.10M | -0.50M | 4.90M | 54.30M | 7.10M |
| Change to netincome | - | - | - | -9.30M | 10.80M |
| Capital expenditures | 76.70M | 87.00M | 108.20M | 76.30M | 27.90M |
| Change receivables | - | - | - | -62.80M | -40.70M |
| Cash flows other operating | - | - | - | -6.40M | 9.40M |
| Exchange rate changes | - | - | - | - | -2.60M |
| Cash and cash equivalents changes | - | - | - | -11.50M | 24.40M |
| Change in working capital | -36.00M | -1.00M | -25.50M | -70.10M | -16.30M |
| Stock based compensation | 14.40M | 22.20M | 20.90M | 20.00M | 19.00M |
| Other non cash items | 14.50M | 12.30M | 63.90M | -26.20M | -2.50M |
| Free cash flow | 307.20M | 202.90M | 148.90M | 96.80M | 123.80M |
Sector: Industrials Industry: Aerospace & Defense
|
Stock Name
|
Change
(USD) |
Price
(USD) |
Trailing
PE (x) |
Forward
PE (x) |
Price Sales
TTM (x) |
Price to Book Value (x)
|
Enterprise Value
to Revenue (x) |
Enterprise Value
to EBITDA (x) |
|---|---|---|---|---|---|---|---|---|
| HXL Hexcel Corporation |
-1.81 2.28% |
77.92 | 46.14 | 21.51 | 3.49 | 5.30 | 3.93 | 22.22 |
| SPCX Space Exploration Technologies Corp. Class A Common Stock |
2.95 2.01% |
149.85 | - | 200.00 | 82.08 | 15.35 | 82.13 | 500.95 |
| GE GE Aerospace |
5.67 1.97% |
294.10 | 37.45 | 35.09 | 6.29 | 18.68 | 6.70 | 27.10 |
| EADSF Airbus Group SE |
-1.00 0.46% |
216.00 | 25.70 | 22.32 | 2.30 | 5.91 | 1.97 | 13.60 |
| BA The Boeing Company |
-17.62 9.36% |
170.69 | 88.37 | 153.85 | 1.93 | 31.61 | 2.21 | 26.81 |
Hexcel Corporation develops, manufactures, and markets advanced lightweight composites technology. It operates through two segments, Composite Materials and Engineered Products. The company offers carbon fiber, reinforcements, prepregs and other fiber-reinforced matrix materials, honeycomb, resins, engineered core and composite structures for use in commercial aerospace, defense and space, and industrial applications. The Composite Materials segment manufactures and markets carbon fibers, fabrics, multi-axials, specialty reinforcements, prepregs and other fiber-reinforced matrix materials, structural adhesives, honeycomb, molding compounds, tooling materials, polyurethane systems, and laminates that are used in military aircraft, transportation, recreational products, and other industrial applications. The Engineered Products segment manufactures and markets aircraft structures and finished aircraft components, including wing to body fairings, wing panels, flight deck panels, door liners, rotorcraft blades, spars, and tip caps; and aircraft structural sub-components and semi-finished components used in rotorcraft blades, engine nacelles, and aircraft surfaces, such as flaps, wings, elevators, and fairings; and RF interference control products for military and aerospace applications. This segment also provides interference control materials, structural composites, and services; dielectric absorber foams; magnetic absorbers; and thermoplastics for commercial and defense applications. The company sells its products directly through its marketing managers, product managers, and sales personnel, as well as through independent distributors in the Americas, Europe, the Asia Pacific, India, and Africa. Hexcel Corporation was founded in 1946 and is headquartered in Stamford, Connecticut.

Two Stamford Plaza, Stamford, CT, United States, 06901-3261

203 969 0666

5563
| Name | Title | Year Born |
|---|---|---|
| Mr. Nick L. Stanage | Chairman, Pres & CEO | 1959 |
| Mr. Patrick Joseph Winterlich | Exec. VP, CFO & Acting Corp. Controller | 1971 |
| Ms. Gail Eileen Lehman | Exec. VP, Gen. Counsel & Sec. | 1960 |
| Mr. Thierry Philippe Merlot | Pres of Aerospace - Europe, MEA/AP & Industrial | 1960 |
| Ms. Amy S. Evans | Sr. VP & Chief Accounting Officer | 1963 |
| Mr. Paul Dominic Mackenzie | Sr. VP & CTO | NA |
| Mr. Don Morrison | Sr. VP & Chief Information Officer | NA |
| Mr. Kurt Goddard | VP of Investor Relations | NA |
| Ms. Gina Calvario Fitzsimons | Exec. VP & Chief HR Officer | 1971 |
| Mr. Michael J. MacIntyre | VP & Treasurer | 1961 |
Disclaimer - (*)This information, including any data, is sourced from Unicorn Data Services SAS, trading as EOD Historical Data (“EODHD”) on an ‘as is’ basis, using their API. We cannot guarantee the completeness or validity of the information and data provided on this page, as well as via the API. In some cases, the data may include analyst ratings or recommendations sourced through the EODHD API, which are intended solely for general information purposes.
This information does not consider your personal objectives, financial situation, or needs. Kalkine is not liable for any errors or omissions in the information provided or for any actions taken in reliance on it. You should seek advice from a financial adviser, stockbroker or other professional adviser (including taxation and legal advice) as necessary before acting on this information.

Download a free report with stock ideas and industry insights for general information.
Download Free Report Now →


Basic Materials
 +0.93%
Communication Services
 -0.10%

Consumer Cyclical
+0.11%

Consumer Defensive
-0.15%

Energy
-0.16%

Financial Services
+0.08%
Financials
-0.19%

Healthcare
+0.64%

Industrials
+0.48%

Real Estate
-0.11%

Technology
+0.80%

Utilities
+0.11%
Note: Daily price change (%) by sector excluding stocks with +/-90% daily price change. Companies above $500 million market capitalization are considered.
 Portfolio
 Watchlist


 Please wait processing your request...