 CA
 NZ
 UK
 AU
 IND

 US


…
Paragon 28, Inc. designs, develops, distributes, and sells foot and ankle surgical systems in the United States and internationally. It offers plating systems, including gorilla plating systems, such as lisfranc, lapidus, lateral column, calcaneus slide, and naviculocuneiform (NC) fusion plating systems; baby gorilla plate-specific screws, navicular fracture plates, and 5th metatarsal hook plates; and silverback plating systems. The company also provides precision guide technology for various procedures consisting of fusion, a procedure to address bunion deformities that fuses two bones on the big toe; first tarsometatarsal arthrodesis; and metatarsal osteotomy for bunion correction, medial column beaming for charcot foot reconstruction, ankle fusion plating, and NC joint arthrodesis. In addition, it offers monster, mini monster, and joust beaming screw systems for use in bone reconstruction, osteotomy, arthrodesis, joint fusion, ligament fixation, fracture repair, and fracture fixation; APEX 3D total ankle replacement systems; and total talus spacers to replace the talus and bone in the ankle that connects the leg and foot. Further, the company provides forefoot or hallux valgus correction systems, including phantom intramedullary nail systems for the treatment of severe hallux valgus; and various orthobiologics comprising bone wedges, grafts, demineralized bone matrices, bone void fillers, synthetic materials, amniotic products, and a biocompatible collagen matrix, as well as PRESERVE bone graft systems for homologous application. Additionally, it offers soft tissue fixation systems, titanium sprayed polyetheretherketone implants, nitinol staple systems, stabilization systems, and curved instruments. The company serves hospitals and ambulatory surgery centers through a network of sales representatives and stocking distributors. Paragon 28, Inc. was founded in 2010 and is headquartered in Englewood, Colorado.
Source: TradingView
The charts and visual representations are sourced from TradingView through embedded widgets. For any issues with chart display, please visit the TradingView website
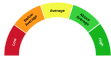
A unique technical analysis driven score developed by Kalkine showing momentum in stock prices based on select technical indicators identified.


| Breakdown | 2022-12-31 | 2021-12-31 | 2020-12-31 | 2019-12-31 |
|---|---|---|---|---|
| Type | yearly | yearly | yearly | yearly |
| Date | 2022-12-31 | 2021-12-31 | 2020-12-31 | 2019-12-31 |
| Income before tax | -67.39M | -12.98M | 5.03M | 1.97M |
| Net income | -67.33M | -13.69M | 3.50M | 3.12M |
| Selling general administrative | 159.32M | 114.09M | 72.64M | 74.44M |
| Gross profit | 148.93M | 119.44M | 85.88M | 87.45M |
| Reconciled depreciation | 13.73M | 8.96M | 6.38M | 4.20M |
| Ebit | -35.05M | -10.78M | 5.63M | 2.72M |
| Ebitda | -22.53M | -2.30M | 12.01M | 6.82M |
| Depreciation and amortization | 12.51M | 8.47M | 6.38M | 4.10M |
| Non operating income net other | -1.21M | -0.49M | - | - |
| Operating income | -35.05M | -10.78M | 5.63M | 2.72M |
| Other operating expenses | 216.43M | 158.24M | 108.91M | 103.56M |
| Interest expense | 4.13M | 1.72M | 0.60M | 0.65M |
| Tax provision | -0.06M | 0.71M | 1.53M | -1.15M |
| Interest income | 4.13M | 1.72M | 0.60M | 0.65M |
| Net interest income | -4.13M | -1.72M | -0.60M | -0.65M |
| Income tax expense | -0.06M | 0.71M | 1.53M | -1.15M |
| Total revenue | 181.38M | 147.46M | 110.98M | 106.28M |
| Total operating expenses | 183.97M | 130.22M | 83.81M | 84.73M |
| Cost of revenue | 32.46M | 28.02M | 25.10M | 18.83M |
| Total other income expense net | -32.34M | -2.21M | -0.60M | -0.75M |
| Net income from continuing ops | -67.33M | -13.69M | 3.50M | 3.12M |
| Net income applicable to common shares | -67.33M | -13.69M | 2.69M | 3.12M |
| Breakdown | 2022-12-31 | 2021-12-31 | 2020-12-31 | 2019-12-31 |
|---|---|---|---|---|
| Type | yearly | yearly | yearly | yearly |
| Date | 2022-12-31 | 2021-12-31 | 2020-12-31 | 2019-12-31 |
| Total assets | 254.11M | 234.54M | 97.58M | 74.56M |
| Intangible assets | 22.39M | 16.50M | 3.33M | 2.29M |
| Other current assets | 4.66M | 3.08M | 0.62M | 1.55M |
| Total liab | 113.18M | 42.35M | 26.10M | 47.31M |
| Total stockholder equity | 140.93M | 192.19M | 71.48M | 27.25M |
| Deferred long term liab | 0.34M | 0.08M | - | - |
| Other current liab | 52.69M | 1.93M | 0.47M | 0.45M |
| Common stock | 0.78M | 0.76M | 0.09M | 0.08M |
| Capital stock | 0.78M | 0.76M | 41.19M | 4.33M |
| Retained earnings | -67.79M | -0.46M | 12.42M | 9.73M |
| Other liab | 1.12M | 0.92M | - | - |
| Good will | 25.46M | 6.33M | - | - |
| Other assets | 0.15M | 0.00M | 0.10M | 1.41M |
| Cash | 38.47M | 109.35M | 17.50M | 2.61M |
| Total current liabilities | 68.50M | 33.96M | 22.07M | 47.23M |
| Current deferred revenue | 0.15M | 18.85M | 10.56M | 11.62M |
| Net debt | 4.44M | -101.72M | -11.24M | 17.59M |
| Short term debt | 0.73M | 0.15M | 2.23M | 20.13M |
| Short long term debt | 0.73M | 0.15M | 2.23M | 20.13M |
| Short long term debt total | 42.91M | 7.63M | 6.26M | 20.20M |
| Other stockholder equity | 207.97M | -42.66M | 17.06M | 13.18M |
| Property plant equipment | 61.94M | 32.18M | 22.36M | 19.83M |
| Total current assets | 142.38M | 179.53M | 71.80M | 51.03M |
| Net tangible assets | 93.08M | 169.36M | 27.07M | 20.71M |
| Net receivables | 38.30M | 26.86M | 21.45M | 22.28M |
| Long term debt | 42.18M | 7.48M | 4.03M | 0.07M |
| Inventory | 60.95M | 40.24M | 32.23M | 24.58M |
| Accounts payable | 14.94M | 13.03M | 8.81M | 15.04M |
| Accumulated other comprehensive income | -0.03M | 0.01M | 0.82M | 0.01M |
| Common stock total equity | 0.78M | 0.76M | - | - |
| Retained earnings total equity | -67.79M | -0.46M | - | - |
| Treasury stock | - | -5.98M | -5.42M | -3.88M |
| Non currrent assets other | 1.79M | -0.08M | - | - |
| Non current assets total | 111.73M | 55.02M | 25.79M | 23.53M |
| Long term debt total | 42.18M | 7.48M | 4.03M | 0.07M |
| Breakdown | 2022-12-31 | 2021-12-31 | 2020-12-31 | 2019-12-31 |
|---|---|---|---|---|
| Type | yearly | yearly | yearly | yearly |
| Date | 2022-12-31 | 2021-12-31 | 2020-12-31 | 2019-12-31 |
| Investments | -60.69M | -35.49M | -10.32M | -17.45M |
| Change to liabilities | 4.07M | 7.77M | -6.24M | 8.43M |
| Total cashflows from investing activities | -60.69M | -35.49M | -10.32M | -17.45M |
| Net borrowings | 34.70M | 0.83M | -14.05M | 10.46M |
| Total cash from financing activities | 39.49M | 131.10M | 24.01M | 6.54M |
| Change to operating activities | 22.67M | 4.63M | 0.13M | 2.48M |
| Net income | -67.33M | -13.69M | 3.50M | 3.12M |
| Change in cash | -70.88M | 91.85M | 14.89M | 1.42M |
| Begin period cash flow | 109.35M | 17.50M | 2.61M | 1.19M |
| End period cash flow | 38.47M | 109.35M | 17.50M | 2.61M |
| Total cash from operating activities | -49.18M | -3.32M | 1.11M | 12.30M |
| Issuance of capital stock | 0.00M | 130.38M | 37.87M | 0.00M |
| Depreciation | 13.73M | 8.96M | 6.38M | 4.20M |
| Other cashflows from investing activities | -60.69M | -17.19M | 0.52M | 0.58M |
| Dividends paid | - | 10.45M | 38.27M | - |
| Change to inventory | -21.51M | -11.10M | -14.83M | -3.56M |
| Change to account receivables | -12.01M | -6.46M | 0.39M | -5.22M |
| Sale purchase of stock | 5.79M | -0.56M | -1.54M | -3.88M |
| Other cashflows from financing activities | 34.79M | 17.75M | 76.48M | 12.63M |
| Change to netincome | 11.69M | 9.23M | 11.88M | 3.17M |
| Capital expenditures | 43.09M | 21.29M | 10.84M | 18.03M |
| Change receivables | -12.01M | -6.46M | - | - |
| Cash flows other operating | 21.58M | 1.40M | - | - |
| Exchange rate changes | - | -0.44M | - | - |
| Cash and cash equivalents changes | -70.39M | 91.85M | - | - |
| Change in working capital | -8.57M | -8.83M | -20.79M | 1.72M |
| Stock based compensation | 10.37M | 4.95M | 1.81M | 1.75M |
| Other non cash items | 3.14M | 5.13M | 8.90M | 2.62M |
| Free cash flow | -92.27M | -24.61M | -9.73M | -5.74M |
Sector: Healthcare Industry: Medical Devices
|
Stock Name
|
Change
(USD) |
Price
(USD) |
Trailing
PE (x) |
Forward
PE (x) |
Price Sales
TTM (x) |
Price to Book Value (x)
|
Enterprise Value
to Revenue (x) |
Enterprise Value
to EBITDA (x) |
|---|---|---|---|---|---|---|---|---|
| ABT Abbott Laboratories |
1.27 1.18% |
108.52 | 25.97 | 17.24 | 3.57 | 3.20 | 3.81 | 16.75 |
| MDT Medtronic PLC |
1.87 1.85% |
102.86 | 26.60 | 15.87 | 3.35 | 2.08 | 3.90 | 14.12 |
| SYK Stryker Corporation |
-2.75 0.88% |
309.64 | 29.23 | 16.86 | 4.18 | 4.51 | 4.63 | 17.16 |
| SEMHF Siemens Healthineers AG |
-0.27 0.55% |
48.51 | 39.57 | 21.32 | 3.01 | 3.29 | 2.95 | 16.92 |
Paragon 28, Inc. designs, develops, distributes, and sells foot and ankle surgical systems in the United States and internationally. It offers plating systems, including gorilla plating systems, such as lisfranc, lapidus, lateral column, calcaneus slide, and naviculocuneiform (NC) fusion plating systems; baby gorilla plate-specific screws, navicular fracture plates, and 5th metatarsal hook plates; and silverback plating systems. The company also provides precision guide technology for various procedures consisting of fusion, a procedure to address bunion deformities that fuses two bones on the big toe; first tarsometatarsal arthrodesis; and metatarsal osteotomy for bunion correction, medial column beaming for charcot foot reconstruction, ankle fusion plating, and NC joint arthrodesis. In addition, it offers monster, mini monster, and joust beaming screw systems for use in bone reconstruction, osteotomy, arthrodesis, joint fusion, ligament fixation, fracture repair, and fracture fixation; APEX 3D total ankle replacement systems; and total talus spacers to replace the talus and bone in the ankle that connects the leg and foot. Further, the company provides forefoot or hallux valgus correction systems, including phantom intramedullary nail systems for the treatment of severe hallux valgus; and various orthobiologics comprising bone wedges, grafts, demineralized bone matrices, bone void fillers, synthetic materials, amniotic products, and a biocompatible collagen matrix, as well as PRESERVE bone graft systems for homologous application. Additionally, it offers soft tissue fixation systems, titanium sprayed polyetheretherketone implants, nitinol staple systems, stabilization systems, and curved instruments. The company serves hospitals and ambulatory surgery centers through a network of sales representatives and stocking distributors. Paragon 28, Inc. was founded in 2010 and is headquartered in Englewood, Colorado.

14445 Grasslands Drive, Englewood, CO, United States, 80112

730 399 3400

463
| Name | Title | Year Born |
|---|---|---|
| Mr. Albert DaCosta | Co-Founder, Chairman & CEO | 1974 |
| Mr. Stephen M. Deitsch | CFO & Principal Fin. Officer | 1971 |
| Mr. Matthew Jarboe | Chief Commercial Officer | 1984 |
| Mr. Jeff Sears | VP of Operations | NA |
| Mr. Erik Mickelson | Chief Accounting Officer & Controller | NA |
| Jason Edie | Chief Technology Officer | NA |
| Matt Brinckman | Sr. VP of Strategy & Investor Relations | NA |
| Ms. Michelle Missal | VP & Chief Compliance Officer | NA |
| Mr. Jonathan Friedman | Gen. Counsel & Sec. | 1971 |
| Mr. John Shumaker | Exec. VP of Sales - U.S. | NA |
Disclaimer - (*)This information, including any data, is sourced from Unicorn Data Services SAS, trading as EOD Historical Data (“EODHD”) on an ‘as is’ basis, using their API. We cannot guarantee the completeness or validity of the information and data provided on this page, as well as via the API. In some cases, the data may include analyst ratings or recommendations sourced through the EODHD API, which are intended solely for general information purposes.
This information does not consider your personal objectives, financial situation, or needs. Kalkine is not liable for any errors or omissions in the information provided or for any actions taken in reliance on it. You should seek advice from a financial adviser, stockbroker or other professional adviser (including taxation and legal advice) as necessary before acting on this information.

Download a free report with stock ideas and industry insights for general information.
Download Free Report Now →


Basic Materials
 -1.02%
Communication Services
 +0.42%

Consumer Cyclical
+0.04%

Consumer Defensive
+0.52%

Energy
+0.40%

Financial Services
+0.10%
Financials
-0.27%

Healthcare
-0.31%

Industrials
-0.44%

Real Estate
+0.05%

Technology
-1.04%

Utilities
+0.19%
Note: Daily price change (%) by sector excluding stocks with +/-90% daily price change. Companies above $500 million market capitalization are considered.
 Portfolio
 Watchlist


 Please wait processing your request...