 CA
 NZ
 UK
 AU
 IND

 US


…
DENTSPLY SIRONA Inc. develops, manufactures, and markets dental equipment supported by cloud-enabled solutions, dental products, and healthcare consumable products in urology and enterology worldwide. It operates through four segments: Connected Technology Solutions, Essential Dental Solutions, Orthodontic and Implant Solutions, and Wellspect Healthcare. The Connected Technology Solutions segment offers imaging equipment, motorized dental handpieces, treatment centers, and other instruments; and intraoral scanners, 3-D printers, and mills, as well as CEREC, a full-chairside economical restoration of esthetic ceramic dentistry offering. The Essential Dental Solutions segment provides motorized endodontic handpieces, files, sealers, irrigation needles, and other tools for root canal procedures; restorative products; curing light and dental diagnostic systems; ultrasonic scalers and polishers; and dental anesthetics, prophylaxis paste, dental sealants, and impression materials. The Orthodontic and Implant Solutions segment offers SureSmile, a clear aligner solution that includes whitening kits and retainers; VPro, a high frequency vibration technology device; SureSmile Simulator; DS Core platform, which creates 3D visualization of patient outcomes; dental implant products; digital dentures; crown and bridge porcelain products; bone regenerative and restorative solutions; treatment planning software; educational programs; custom abutments; tapered immediate load screws; regenerative bone growth factor; artificial teeth; and precious metal dental alloys. The Wellspect Healthcare segment offers medical devices, including catheters for urinary retention and advanced irrigation systems to help people suffering from chronic or severe constipation. The company was formerly known as DENTSPLY International Inc. and changed its name to DENTSPLY SIRONA Inc. in February 2016. DENTSPLY SIRONA Inc. was founded in 1877 and is headquartered in Charlotte, North Carolina.
Source: TradingView
The charts and visual representations are sourced from TradingView through embedded widgets. For any issues with chart display, please visit the TradingView website
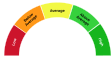
A unique technical analysis driven score developed by Kalkine showing momentum in stock prices based on select technical indicators identified.
Dentsply Sirona makes dental consumables, equipment and digital imaging and CAD/CAM solutions for dental professionals worldwide. Long-term growth may be driven by demographic trends, rising global dental care access and continued adoption of digital dentistry and recurring consumables. The company's broad product mix and leading positions in several dental categories appear positioned to support stable aftermarket demand.
Principal risks include sensitivity to dental spending cycles and macroeconomic conditions, intense competition, execution and integration risk from product development and acquisitions, and regulatory, supply-chain and currency exposures that investors should monitor.

Note: The summary and risk score provided above is created by AI and should not be construed as a recommendation of Kalkine.


| Breakdown | 2025-12-31 | 2024-12-31 | 2023-12-31 | 2022-12-31 | 2021-12-31 |
|---|---|---|---|---|---|
| Type | yearly | yearly | yearly | yearly | yearly |
| Date | 2025-12-31 | 2024-12-31 | 2023-12-31 | 2022-12-31 | 2021-12-31 |
| Income before tax | -486.00M | -936.00M | -175.00M | -1055.00M | 559.00M |
| Minority interest | 0.00M | 0.00M | 0.00M | 0.00M | 0.00M |
| Net income | -598.00M | -910.00M | -132.00M | -950.00M | 421.00M |
| Selling general administrative | 1438.00M | 1605.00M | 1620.00M | 1589.00M | 1551.00M |
| Selling and marketing expenses | - | - | 7.00M | - | - |
| Gross profit | 1840.00M | 1958.00M | 2086.00M | 2127.00M | 2361.00M |
| Reconciled depreciation | 352.00M | 349.00M | 343.00M | 328.00M | 346.00M |
| Ebit | -398.00M | -867.00M | -94.00M | 306.00M | 622.00M |
| Ebitda | -46.00M | -518.00M | 249.00M | 634.00M | 1002.00M |
| Depreciation and amortization | 352.00M | 349.00M | 343.00M | 328.00M | 380.00M |
| Non operating income net other | - | - | - | -58.00M | -8.00M |
| Operating income | 252.00M | -879.00M | -85.00M | 306.00M | 622.00M |
| Other operating expenses | 3428.00M | 4672.00M | 4050.00M | 3558.00M | 3612.00M |
| Interest expense | 88.00M | 69.00M | 81.00M | 60.00M | 55.00M |
| Tax provision | 112.00M | -26.00M | -43.00M | -105.00M | 138.00M |
| Net interest income | -88.00M | -69.00M | -81.00M | -60.00M | -55.00M |
| Non recurring | - | - | - | 1301.00M | 17.00M |
| Income tax expense | 112.00M | -26.00M | -43.00M | -105.00M | 138.00M |
| Total revenue | 3680.00M | 3793.00M | 3965.00M | 3922.00M | 4251.00M |
| Total operating expenses | 1588.00M | 2837.00M | 2171.00M | 1763.00M | 1722.00M |
| Cost of revenue | 1840.00M | 1835.00M | 1879.00M | 1795.00M | 1890.00M |
| Total other income expense net | -738.00M | -57.00M | -90.00M | -1361.00M | -63.00M |
| Net income from continuing ops | -598.00M | -910.00M | -132.00M | -950.00M | 421.00M |
| Net income applicable to common shares | - | - | - | -950.00M | 421.00M |
| Breakdown | 2025-12-31 | 2024-12-31 | 2023-12-31 | 2022-12-31 | 2021-12-31 |
|---|---|---|---|---|---|
| Type | yearly | yearly | yearly | yearly | yearly |
| Date | 2025-12-31 | 2024-12-31 | 2023-12-31 | 2022-12-31 | 2021-12-31 |
| Total assets | 5429.00M | 5753.00M | 7370.00M | 7643.00M | 9220.00M |
| Intangible assets | 974.00M | 1207.00M | 1705.00M | 1903.00M | 2319.00M |
| Other current assets | 367.00M | 304.00M | 259.00M | 269.00M | 83.00M |
| Total liab | 4089.00M | 3810.00M | 4076.00M | 3831.00M | 4177.00M |
| Total stockholder equity | 1340.00M | 1942.00M | 3293.00M | 3812.00M | 5043.00M |
| Deferred long term liab | - | - | - | - | 14.00M |
| Other current liab | 579.00M | 613.00M | 651.00M | 689.00M | 685.00M |
| Common stock | 3.00M | 3.00M | 3.00M | 3.00M | 3.00M |
| Capital stock | 3.00M | 3.00M | 3.00M | 3.00M | 3.00M |
| Retained earnings | -1564.00M | -835.00M | 205.00M | 456.00M | 1560.00M |
| Other liab | - | - | - | 661.00M | 933.00M |
| Good will | 1148.00M | 1597.00M | 2438.00M | 2688.00M | 3976.00M |
| Other assets | - | - | - | 198.00M | 122.00M |
| Cash | 326.00M | 272.00M | 334.00M | 365.00M | 339.00M |
| Total current liabilities | 1343.00M | 1589.00M | 1425.00M | 1170.00M | 1186.00M |
| Current deferred revenue | 74.00M | 95.00M | 91.00M | 84.00M | 51.00M |
| Net debt | 2142.00M | 2000.00M | 1965.00M | 1728.00M | 1901.00M |
| Short term debt | 360.00M | 595.00M | 378.00M | 118.00M | 182.00M |
| Short long term debt | 313.00M | 549.00M | 322.00M | 118.00M | 182.00M |
| Short long term debt total | 2468.00M | 2272.00M | 2299.00M | 2093.00M | 2240.00M |
| Other stockholder equity | 3539.00M | 3504.00M | 3721.00M | 3981.00M | 4072.00M |
| Property plant equipment | - | - | - | 961.00M | 966.00M |
| Total current assets | 2023.00M | 1746.00M | 1973.00M | 1893.00M | 1837.00M |
| Net tangible assets | - | - | - | -780.00M | -1252.00M |
| Short term investments | - | - | 33.00M | - | - |
| Net receivables | 688.00M | 606.00M | 756.00M | 632.00M | 747.00M |
| Long term debt | 2015.00M | 1586.00M | 1796.00M | 1826.00M | 1913.00M |
| Inventory | 642.00M | 564.00M | 624.00M | 627.00M | 504.00M |
| Accounts payable | 300.00M | 241.00M | 305.00M | 279.00M | 268.00M |
| Noncontrolling interest in consolidated entity | - | - | - | 1.00M | 1.00M |
| Accumulated other comprehensive income | -639.00M | -730.00M | -636.00M | -628.00M | -592.00M |
| Common stock total equity | - | - | - | 3.00M | 3.00M |
| Retained earnings total equity | - | - | - | 456.00M | 1560.00M |
| Treasury stock | - | - | - | - | -2535.00M |
| Non currrent assets other | 284.00M | 278.00M | 59.00M | -89.00M | 122.00M |
| Non current assets total | 3406.00M | 4007.00M | 5397.00M | 5750.00M | 7383.00M |
| Capital lease obligations | 140.00M | 137.00M | 181.00M | 149.00M | 195.00M |
| Breakdown | 2025-12-31 | 2024-12-31 | 2023-12-31 | 2022-12-31 | 2021-12-31 |
|---|---|---|---|---|---|
| Type | yearly | yearly | yearly | yearly | yearly |
| Date | 2025-12-31 | 2024-12-31 | 2023-12-31 | 2022-12-31 | 2021-12-31 |
| Investments | -4.00M | -197.00M | -98.00M | -138.00M | -358.00M |
| Change to liabilities | - | - | - | 10.00M | -46.00M |
| Total cashflows from investing activities | -132.00M | -197.00M | - | -138.00M | -358.00M |
| Net borrowings | 70.00M | 90.00M | - | -66.00M | -102.00M |
| Total cash from financing activities | -80.00M | -302.00M | -307.00M | -329.00M | -379.00M |
| Change to operating activities | - | - | - | -37.00M | 43.00M |
| Net income | -598.00M | -910.00M | -132.00M | -950.00M | 421.00M |
| Change in cash | 54.00M | -62.00M | -31.00M | 26.00M | -99.00M |
| Begin period cash flow | 272.00M | 334.00M | 365.00M | 339.00M | 438.00M |
| End period cash flow | 326.00M | 272.00M | 334.00M | 365.00M | 339.00M |
| Total cash from operating activities | 235.00M | 461.00M | 377.00M | 517.00M | 657.00M |
| Depreciation | 352.00M | 349.00M | 343.00M | 328.00M | 346.00M |
| Other cashflows from investing activities | -1.00M | -17.00M | - | -2.00M | 4.00M |
| Dividends paid | 128.00M | 126.00M | 116.00M | 104.00M | 92.00M |
| Change to inventory | -17.00M | 17.00M | 6.00M | -141.00M | -63.00M |
| Change to account receivables | -91.00M | 104.00M | -58.00M | 85.00M | -109.00M |
| Sale purchase of stock | 0.00M | -250.00M | -300.00M | -150.00M | -200.00M |
| Other cashflows from financing activities | -6.00M | -16.00M | -10.00M | -73.00M | -36.00M |
| Change to netincome | - | - | - | 1217.00M | 48.00M |
| Capital expenditures | 131.00M | 180.00M | 149.00M | 149.00M | 142.00M |
| Change receivables | - | - | - | 85.00M | -109.00M |
| Cash flows other operating | - | - | - | -32.00M | -45.00M |
| Cash and cash equivalents changes | - | - | - | 50.00M | -80.00M |
| Change in working capital | -222.00M | 95.00M | -89.00M | -78.00M | -158.00M |
| Stock based compensation | 33.00M | 39.00M | 46.00M | 59.00M | 48.00M |
| Other non cash items | 640.00M | 1024.00M | 339.00M | 1386.00M | 20.00M |
| Free cash flow | 104.00M | 281.00M | 228.00M | 368.00M | 515.00M |
Sector: Healthcare Industry: Medical Instruments & Supplies
|
Stock Name
|
Change
(USD) |
Price
(USD) |
Trailing
PE (x) |
Forward
PE (x) |
Price Sales
TTM (x) |
Price to Book Value (x)
|
Enterprise Value
to Revenue (x) |
Enterprise Value
to EBITDA (x) |
|---|---|---|---|---|---|---|---|---|
| XRAY Dentsply Sirona Inc |
0.08 0.85% |
9.54 | - | 6.72 | 0.54 | 1.53 | 1.14 | 44.54 |
| ISRG Intuitive Surgical Inc |
7.49 1.65% |
460.29 | 43.30 | 31.35 | 12.25 | 7.35 | 11.63 | 30.22 |
| ESLOF EssilorLuxottica Société anonyme |
0.14 0.07% |
213.00 | 44.84 | 27.62 | 4.07 | 2.49 | 3.71 | 16.04 |
| ESLOY Essilor International SA |
-0.55 0.51% |
107.20 | 41.68 | 27.25 | 3.94 | 2.45 | 3.71 | 16.04 |
| BDX Becton Dickinson and Company |
- -% |
215.25 | 31.62 | 13.76 | 2.25 | 2.04 | 2.93 | 13.40 |
DENTSPLY SIRONA Inc. develops, manufactures, and markets dental equipment supported by cloud-enabled solutions, dental products, and healthcare consumable products in urology and enterology worldwide. It operates through four segments: Connected Technology Solutions, Essential Dental Solutions, Orthodontic and Implant Solutions, and Wellspect Healthcare. The Connected Technology Solutions segment offers imaging equipment, motorized dental handpieces, treatment centers, and other instruments; and intraoral scanners, 3-D printers, and mills, as well as CEREC, a full-chairside economical restoration of esthetic ceramic dentistry offering. The Essential Dental Solutions segment provides motorized endodontic handpieces, files, sealers, irrigation needles, and other tools for root canal procedures; restorative products; curing light and dental diagnostic systems; ultrasonic scalers and polishers; and dental anesthetics, prophylaxis paste, dental sealants, and impression materials. The Orthodontic and Implant Solutions segment offers SureSmile, a clear aligner solution that includes whitening kits and retainers; VPro, a high frequency vibration technology device; SureSmile Simulator; DS Core platform, which creates 3D visualization of patient outcomes; dental implant products; digital dentures; crown and bridge porcelain products; bone regenerative and restorative solutions; treatment planning software; educational programs; custom abutments; tapered immediate load screws; regenerative bone growth factor; artificial teeth; and precious metal dental alloys. The Wellspect Healthcare segment offers medical devices, including catheters for urinary retention and advanced irrigation systems to help people suffering from chronic or severe constipation. The company was formerly known as DENTSPLY International Inc. and changed its name to DENTSPLY SIRONA Inc. in February 2016. DENTSPLY SIRONA Inc. was founded in 1877 and is headquartered in Charlotte, North Carolina.

13320 Ballantyne Corporate Place, Charlotte, NC, United States, 28277-3607

844 848 0137

14000
| Name | Title | Year Born |
|---|---|---|
| Mr. Simon D. Campion | CEO, Pres & Director | 1971 |
| Mr. Glenn G. Coleman | Exec. VP & CFO | 1968 |
| Mr. Richard M. Wagner | Chief Accounting Officer & Principal Accounting Officer | 1968 |
| Mr. Cord Friedrich Staehler | Sr. VP of Digital Platforms & Solutions and CTO | 1970 |
| Andrea Daley | VP of Investor Relations | NA |
| Ms. Cheree Haswell Johnson | Sr. VP, Chief Legal Officer, Gen. Counsel & Sec. | 1976 |
| Ms. Erania Brackett | Sr. VP & Chief Marketing Officer | NA |
| Ms. Lisa M. Yankie | Sr. VP & Chief HR Officer | 1969 |
| Mr. Andrew Robinson | Sr. VP of North American Commercial Leader & Chief Digital Officer | NA |
| Mr. Andreas G. Frank | Exec. VP of Product Group | 1976 |
Disclaimer - (*)This information, including any data, is sourced from Unicorn Data Services SAS, trading as EOD Historical Data (“EODHD”) on an ‘as is’ basis, using their API. We cannot guarantee the completeness or validity of the information and data provided on this page, as well as via the API. In some cases, the data may include analyst ratings or recommendations sourced through the EODHD API, which are intended solely for general information purposes.
This information does not consider your personal objectives, financial situation, or needs. Kalkine is not liable for any errors or omissions in the information provided or for any actions taken in reliance on it. You should seek advice from a financial adviser, stockbroker or other professional adviser (including taxation and legal advice) as necessary before acting on this information.

Download a free report with stock ideas and industry insights for general information.
Download Free Report Now →


Basic Materials
 +1.88%
Communication Services
+1.14%

Consumer Cyclical
+1.04%

Consumer Defensive
+0.57%

Energy
+0.50%

Financial Services
+0.81%
Financials
+0.24%

Healthcare
+1.35%

Industrials
+1.54%

Real Estate
+0.24%

Technology
+2.32%

Utilities
+0.48%
Note: Daily price change (%) by sector excluding stocks with +/-90% daily price change. Companies above $500 million market capitalization are considered.
 Portfolio
 Watchlist


 -4.40%
 Please wait processing your request...