 CA
 NZ
 UK
 AU
 IND

 US


…
Wellgistics Health, Inc. engages in the wholesale and distribution of pharmaceutical products to pharmaceutical manufacturers and independent retail pharmacies in the United States. The company distributes branded and generic pharmaceuticals, as well as over-the-counter healthcare and consumer products. It also offers third-party logistics services that include warehousing, inventory management, pick and pack, and shipping to small and mid-size pharmaceutical manufacturers. It also operates DelivMeds platform that serves as a pharmaceutical hub to facilitate the transfer of prescriptions and provide backend clinical concierge services to a network of independent pharmacies; and operates a retail community specialty. The company was formerly known as Danam Health, Inc. and changed its name to Wellgistics Health, Inc. in October 2024. Wellgistics Health, Inc. was incorporated in 2022 and is based in Tampa, Florida.
Source: TradingView
The charts and visual representations are sourced from TradingView through embedded widgets. For any issues with chart display, please visit the TradingView website
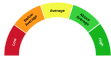
A unique technical analysis driven score developed by Kalkine showing momentum in stock prices based on select technical indicators identified.
Public information on Wellgistics Health, Inc. (NASDAQ: WGRX) is limited; the company's filings and public disclosures do not clearly describe its core operations or product lines, which constrains a detailed assessment. Long-term growth would depend on clarifying the business model, achieving commercial traction and regulatory compliance, factors that may attract investors seeking early-stage healthcare exposure if the company delivers transparent strategy and execution.
The most important investment risks are sparse public disclosure and information asymmetry, likely low trading liquidity, unclear operating history and execution risk, plus potential financial and regulatory uncertainty typical for small healthcare issuers.

Note: The summary and risk score provided above is created by AI and should not be construed as a recommendation of Kalkine.


| Breakdown | 2025-12-31 | 2024-12-31 | 2023-12-31 | 2022-12-31 |
|---|---|---|---|---|
| Type | yearly | yearly | yearly | yearly |
| Date | 2025-12-31 | 2024-12-31 | 2023-12-31 | 2022-12-31 |
| Income before tax | -101.27M | -6.86M | -2.90M | -2.74M |
| Net income | -101.27M | -6.86M | -2.90M | -2.74M |
| Selling general administrative | 70.33M | 6.80M | 2.88M | 7.08M |
| Selling and marketing expenses | 1.22M | - | - | - |
| Gross profit | -9.64M | 1.77M | 0.00M | 5.75M |
| Reconciled depreciation | 3.21M | 1.11M | 0.00M | 2.09M |
| Ebit | -96.69M | -6.02M | - | -2.46M |
| Ebitda | -93.48M | -4.91M | -2.88M | -0.37M |
| Depreciation and amortization | 3.21M | 1.11M | - | 2.09M |
| Operating income | -81.19M | -6.15M | -2.88M | -3.42M |
| Other operating expenses | 104.53M | 24.27M | 2.88M | 36.20M |
| Interest expense | 4.58M | 0.83M | 0.02M | 0.29M |
| Tax provision | 0.00M | 0.00M | 0.00M | 0.00M |
| Net interest income | -4.58M | -0.83M | -0.02M | -0.29M |
| Total revenue | 23.34M | 18.13M | 0.00M | 32.78M |
| Total operating expenses | 71.56M | 7.91M | 2.88M | 9.17M |
| Cost of revenue | 32.98M | 16.36M | 0.00M | 27.03M |
| Total other income expense net | -20.08M | -0.71M | -0.02M | 0.68M |
| Net income from continuing ops | -101.27M | -6.86M | -2.90M | -2.74M |
| Breakdown | 2025-12-31 | 2024-12-31 | 2023-12-31 | 2022-12-31 |
|---|---|---|---|---|
| Type | yearly | yearly | yearly | yearly |
| Date | 2025-12-31 | 2024-12-31 | 2023-12-31 | 2022-12-31 |
| Total assets | 30.46M | 57.33M | 0.34M | 0.00M |
| Intangible assets | 10.31M | 22.36M | - | - |
| Other current assets | - | 0.88M | - | - |
| Total liab | 42.91M | 50.60M | 3.24M | 0.01M |
| Total stockholder equity | -12.45M | 6.73M | -2.90M | -0.01M |
| Other current liab | 5.96M | 18.91M | 1.50M | - |
| Common stock | 0.01M | 0.01M | 0.00M | - |
| Capital stock | 0.01M | 0.01M | 0.00M | 0.00M |
| Retained earnings | -111.03M | -9.76M | -2.90M | -0.01M |
| Good will | 14.19M | 16.22M | 0.00M | - |
| Cash | 0.04M | 1.03M | 0.00M | 0.00M |
| Total current liabilities | 29.78M | 38.05M | 2.89M | 0.01M |
| Current deferred revenue | 0.49M | 0.25M | - | - |
| Net debt | 24.73M | 24.08M | 0.70M | - |
| Short term debt | 11.64M | 12.56M | 0.35M | - |
| Short long term debt | 11.07M | 12.04M | 0.35M | - |
| Short long term debt total | 24.77M | 25.11M | 0.70M | - |
| Other stockholder equity | 98.57M | 16.49M | -0.00M | - |
| Total current assets | 2.82M | 15.17M | 0.34M | 0.00M |
| Long term investments | - | 0.02M | 0.00M | - |
| Net receivables | 1.14M | 3.75M | 0.34M | - |
| Long term debt | 12.60M | 11.46M | 0.35M | - |
| Inventory | 1.64M | 9.52M | 0.00M | - |
| Accounts payable | 11.69M | 6.33M | 1.04M | 0.01M |
| Non currrent assets other | 1.94M | 1.65M | - | - |
| Non current assets total | 27.64M | 42.16M | 0.00M | 0.00M |
| Capital lease obligations | 1.10M | 1.62M | 0.00M | - |
| Breakdown | 2025-12-31 | 2024-12-31 | 2023-12-31 | 2022-12-31 |
|---|---|---|---|---|
| Type | yearly | yearly | yearly | yearly |
| Date | 2025-12-31 | 2024-12-31 | 2023-12-31 | 2022-12-31 |
| Investments | - | 0.47M | 0.00M | - |
| Total cashflows from investing activities | -0.88M | 0.47M | - | - |
| Net borrowings | -2.08M | 0.62M | 0.35M | 0.00M |
| Total cash from financing activities | 10.75M | 1.78M | 0.35M | 0.00M |
| Net income | -101.27M | -6.86M | -2.90M | -0.01M |
| Change in cash | -0.99M | 1.03M | 0.00M | 0.00M |
| Begin period cash flow | 1.03M | 0.00M | 0.00M | 0.00M |
| End period cash flow | 0.04M | 1.03M | 0.00M | 0.00M |
| Total cash from operating activities | -10.86M | -1.22M | -0.35M | 0.00M |
| Issuance of capital stock | 11.37M | 0.01M | 0.00M | 0.00M |
| Depreciation | 0.19M | 1.11M | 0.00M | - |
| Other cashflows from investing activities | -0.88M | -0.09M | - | - |
| Change to inventory | 1.89M | -0.07M | 0.00M | - |
| Change to account receivables | 0.80M | -0.04M | -0.27M | - |
| Sale purchase of stock | 2.84M | - | - | - |
| Other cashflows from financing activities | 10.75M | 1.15M | - | - |
| Capital expenditures | 0.88M | 0.38M | 0.00M | 0.00M |
| Change in working capital | 8.48M | 3.34M | 2.55M | 0.01M |
| Stock based compensation | 54.79M | 1.08M | 0.00M | - |
| Other non cash items | 26.95M | 0.09M | - | - |
| Free cash flow | -10.86M | -1.60M | -0.35M | 0.00M |
Sector: Healthcare Industry: Medical Distribution
|
Stock Name
|
Change
(USD) |
Price
(USD) |
Trailing
PE (x) |
Forward
PE (x) |
Price Sales
TTM (x) |
Price to Book Value (x)
|
Enterprise Value
to Revenue (x) |
|---|---|---|---|---|---|---|---|
| MCK McKesson Corporation |
25.76 2.39% |
1102.81 | 24.45 | 20.41 | 0.26 | 5.04 | 0.27 |
| COR Cencora Inc. |
9.65 2.76% |
359.03 | 24.22 | 16.39 | 0.19 | 20.41 | 0.21 |
| CAH Cardinal Health Inc |
2.96 1.06% |
281.10 | 29.48 | 17.92 | 0.20 | 16.07 | 0.22 |
| HSIC Henry Schein Inc |
0.08 0.09% |
86.22 | 25.89 | 15.08 | 0.72 | 3.14 | 1.00 |
Wellgistics Health, Inc. engages in the wholesale and distribution of pharmaceutical products to pharmaceutical manufacturers and independent retail pharmacies in the United States. The company distributes branded and generic pharmaceuticals, as well as over-the-counter healthcare and consumer products. It also offers third-party logistics services that include warehousing, inventory management, pick and pack, and shipping to small and mid-size pharmaceutical manufacturers. It also operates DelivMeds platform that serves as a pharmaceutical hub to facilitate the transfer of prescriptions and provide backend clinical concierge services to a network of independent pharmacies; and operates a retail community specialty. The company was formerly known as Danam Health, Inc. and changed its name to Wellgistics Health, Inc. in October 2024. Wellgistics Health, Inc. was incorporated in 2022 and is based in Tampa, Florida.
| Name | Title | Year Born |
|---|---|---|
| Mr. Prashant Patel M.Sc., R.Ph. | Interim Co-CEO, President & Director | 1975 |
| Dr. Shafaat Pirani Pharm.D. | Chief Clinical Officer | 1990 |
| Mr. Nikul Panchal BCNP, R.Ph. | Senior Vice President of Pharmacy | 1978 |
| Raj Mehta M.B.A. | SVP of Tech and Hub | NA |
Disclaimer - (*)This information, including any data, is sourced from Unicorn Data Services SAS, trading as EOD Historical Data (“EODHD”) on an ‘as is’ basis, using their API. We cannot guarantee the completeness or validity of the information and data provided on this page, as well as via the API. In some cases, the data may include analyst ratings or recommendations sourced through the EODHD API, which are intended solely for general information purposes.
This information does not consider your personal objectives, financial situation, or needs. Kalkine is not liable for any errors or omissions in the information provided or for any actions taken in reliance on it. You should seek advice from a financial adviser, stockbroker or other professional adviser (including taxation and legal advice) as necessary before acting on this information.

Download a free report with stock ideas and industry insights for general information.
Download Free Report Now →

| No data available |
| ARE |
USD 43.53
 -0.71% |


Basic Materials
-1.01%
Communication Services
 +0.38%

Consumer Cyclical
+0.01%

Consumer Defensive
+0.56%

Energy
+0.45%

Financial Services
+0.07%
Financials
-0.27%

Healthcare
-0.36%

Industrials
-0.46%

Real Estate
+0.07%

Technology
-1.02%

Utilities
+0.24%
Note: Daily price change (%) by sector excluding stocks with +/-90% daily price change. Companies above $500 million market capitalization are considered.
 Portfolio
 Watchlist


 Please wait processing your request...