 CA
 NZ
 UK
 AU
 IND

 US


…
Visteon Corporation, an automotive technology company, engages in the design, manufacture, and sale of automotive electronics and connected car solutions for vehicle manufacturers. It provides instrument clusters, including analog gauge clusters for 2-D and 3-D display-based devices; information displays that integrate a range of user interface technologies and graphics management capabilities, such as active privacy, TrueColor enhancement, local dimming, cameras, optics, haptic feedback, and light effects; and infotainment and connected car solutions, including scalable Android infotainment for seamless connectivity, as well as onboard artificial intelligence-based voice assistants with natural language understanding. It offers display audio and embedded infotainment platform that enables third-party developers to create apps through a software development kit and software simulation of the target hardware system; and wired and wireless battery management systems; and power electronics units. In addition, the company provides SmartCore, an automotive-grade, integrated domain controller; SmartCore Runtime, a middleware enabling communication between domains and apps to be shown on any display; and SmartCore Studio, a PC-based configuration tool to generate hypervisor configurations. Further, it offers CognitoAI, an in-house, automotive-grade A.I. software platform; Battery Management Systems, configurable battery management systems; High-Voltage Power Electronics, an integrated and scalable power electronics units; and engineering and software development services. It operates in the United States, Mexico, Portugal, Slovakia, Tunisia, rest of Europe, China, India, Japan, rest of the Asia Pacific, and South America. Visteon Corporation was incorporated in 2000 and is headquartered in Van Buren, Michigan.
Source: TradingView
The charts and visual representations are sourced from TradingView through embedded widgets. For any issues with chart display, please visit the TradingView website
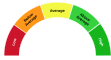
A unique technical analysis driven score developed by Kalkine showing momentum in stock prices based on select technical indicators identified.
Visteon Corporation is a global automotive supplier of cockpit electronics including digital clusters, infotainment, domain controllers and vehicle software for OEMs. The company may benefit from electrification, the shift to software-defined vehicles and rising in-vehicle connectivity, and appears positioned to capture recurring software and services revenue from multi-year OEM contracts.
Primary risks are sensitivity to cyclical auto demand and OEM concentration, execution and integration as it scales software, and competitive and supply-chain pressures from larger Tier‑1s and tech entrants.

Note: The summary and risk score provided above is created by AI and should not be construed as a recommendation of Kalkine.


| Breakdown | 2025-12-31 | 2024-12-31 | 2023-12-31 | 2022-12-31 | 2021-12-31 |
|---|---|---|---|---|---|
| Type | yearly | yearly | yearly | yearly | yearly |
| Date | 2025-12-31 | 2024-12-31 | 2023-12-31 | 2022-12-31 | 2021-12-31 |
| Income before tax | 338.00M | 298.00M | 257.00M | 175.00M | 81.00M |
| Minority interest | -12.00M | -10.00M | -19.00M | 6.00M | 9.00M |
| Net income | 201.00M | 274.00M | 486.00M | 124.00M | 41.00M |
| Selling general administrative | 202.00M | 207.00M | 207.00M | 188.00M | 175.00M |
| Gross profit | 532.00M | 531.00M | 697.00M | 368.00M | 254.00M |
| Reconciled depreciation | 109.00M | 96.00M | 104.00M | 108.00M | 108.00M |
| Ebit | 342.00M | 314.00M | 262.00M | 203.00M | 105.00M |
| Ebitda | 451.00M | 409.00M | 365.00M | 311.00M | 213.00M |
| Depreciation and amortization | 109.00M | 95.00M | 103.00M | 108.00M | 108.00M |
| Non operating income net other | - | - | - | 4.00M | 2.00M |
| Operating income | 330.00M | 133.00M | 280.00M | 203.00M | 105.00M |
| Other operating expenses | 3438.00M | 3733.00M | 3674.00M | 3576.00M | 2694.00M |
| Interest expense | 4.00M | 15.00M | 17.00M | 14.00M | 10.00M |
| Tax provision | 125.00M | 14.00M | -248.00M | 45.00M | 31.00M |
| Interest income | 22.00M | 17.00M | 10.00M | 4.00M | 2.00M |
| Net interest income | 9.00M | 2.00M | -7.00M | -10.00M | -8.00M |
| Non recurring | - | - | - | 14.00M | 14.00M |
| Income tax expense | 125.00M | 14.00M | -248.00M | 45.00M | 31.00M |
| Total revenue | 3768.00M | 3866.00M | 3954.00M | 3756.00M | 2773.00M |
| Total operating expenses | 202.00M | 398.00M | 417.00M | 188.00M | 175.00M |
| Cost of revenue | 3236.00M | 3335.00M | 3257.00M | 3388.00M | 2519.00M |
| Total other income expense net | 8.00M | 165.00M | -23.00M | -28.00M | -24.00M |
| Net income from continuing ops | 213.00M | 284.00M | 505.00M | 130.00M | 50.00M |
| Net income applicable to common shares | - | - | - | 124.00M | 41.00M |
| Breakdown | 2025-12-31 | 2024-12-31 | 2023-12-31 | 2022-12-31 | 2021-12-31 |
|---|---|---|---|---|---|
| Type | yearly | yearly | yearly | yearly | yearly |
| Date | 2025-12-31 | 2024-12-31 | 2023-12-31 | 2022-12-31 | 2021-12-31 |
| Total assets | 3386.00M | 2862.00M | 2727.00M | 2450.00M | 2234.00M |
| Intangible assets | 109.00M | 71.00M | 46.00M | 54.00M | 68.00M |
| Other current assets | 66.00M | 52.00M | 4.00M | 167.00M | 158.00M |
| Total liab | 1735.00M | 1552.00M | 1604.00M | 1676.00M | 1618.00M |
| Total stockholder equity | 1568.00M | 1229.00M | 1038.00M | 675.00M | 516.00M |
| Deferred long term liab | - | - | - | 27.00M | 27.00M |
| Other current liab | 413.00M | 258.00M | 275.00M | 281.00M | 229.00M |
| Common stock | 1.00M | 1.00M | 1.00M | 1.00M | 1.00M |
| Capital stock | 1.00M | 1.00M | 1.00M | 1.00M | 1.00M |
| Retained earnings | 2838.00M | 2548.00M | 2274.00M | 1788.00M | 1664.00M |
| Other liab | - | - | - | 206.00M | 300.00M |
| Good will | 113.00M | 81.00M | 44.00M | 45.00M | 50.00M |
| Other assets | - | - | - | 104.00M | 109.00M |
| Cash | 771.00M | 623.00M | 515.00M | 520.00M | 452.00M |
| Total current liabilities | 992.00M | 916.00M | 931.00M | 1035.00M | 852.00M |
| Current deferred revenue | - | 48.00M | 57.00M | 55.00M | 69.00M |
| Net debt | -231.00M | -197.00M | -70.00M | -43.00M | 46.00M |
| Short term debt | 39.00M | 47.00M | 48.00M | 42.00M | 32.00M |
| Short long term debt | 18.00M | 18.00M | 18.00M | 13.00M | 4.00M |
| Short long term debt total | 540.00M | 426.00M | 445.00M | 477.00M | 498.00M |
| Other stockholder equity | -1031.00M | -1014.00M | -983.00M | -901.00M | -920.00M |
| Property plant equipment | - | - | - | 488.00M | 527.00M |
| Total current assets | 1785.00M | 1596.00M | 1616.00M | 1710.00M | 1424.00M |
| Long term investments | 29.00M | 27.00M | 35.00M | 49.00M | 54.00M |
| Net tangible assets | - | - | - | 675.00M | 515.00M |
| Net receivables | 679.00M | 638.00M | 736.00M | 672.00M | 549.00M |
| Long term debt | 283.00M | 301.00M | 318.00M | 336.00M | 349.00M |
| Inventory | 269.00M | 283.00M | 298.00M | 348.00M | 262.00M |
| Accounts payable | 540.00M | 505.00M | 551.00M | 657.00M | 522.00M |
| Noncontrolling interest in consolidated entity | - | - | - | 99.00M | 100.00M |
| Accumulated other comprehensive income | -240.00M | -306.00M | -254.00M | -213.00M | -229.00M |
| Common stock total equity | - | - | - | 1.00M | 1.00M |
| Retained earnings total equity | - | - | - | 1788.00M | 1664.00M |
| Treasury stock | - | - | - | -2253.00M | -2269.00M |
| Non currrent assets other | 189.00M | 94.00M | 75.00M | 62.00M | 64.00M |
| Non current assets total | 1601.00M | 1266.00M | 1111.00M | 740.00M | 810.00M |
| Capital lease obligations | 130.00M | 107.00M | 109.00M | 128.00M | 145.00M |
| Long term debt total | - | - | - | 336.00M | 349.00M |
| Breakdown | 2025-12-31 | 2024-12-31 | 2023-12-31 | 2022-12-31 | 2021-12-31 |
|---|---|---|---|---|---|
| Type | yearly | yearly | yearly | yearly | yearly |
| Date | 2025-12-31 | 2024-12-31 | 2023-12-31 | 2022-12-31 | 2021-12-31 |
| Investments | - | -189.00M | -104.00M | 13.00M | -1.00M |
| Change to liabilities | - | - | - | 146.00M | 28.00M |
| Total cashflows from investing activities | -181.00M | -189.00M | - | -68.00M | -63.00M |
| Net borrowings | -18.00M | -18.00M | - | -7.00M | 4.00M |
| Total cash from financing activities | -116.00M | -100.00M | -156.00M | -9.00M | -29.00M |
| Change to operating activities | - | - | - | 10.00M | -11.00M |
| Net income | 213.00M | 284.00M | 505.00M | 130.00M | 50.00M |
| Change in cash | 147.00M | 108.00M | -5.00M | 68.00M | -45.00M |
| Begin period cash flow | 626.00M | 518.00M | 523.00M | 455.00M | 500.00M |
| End period cash flow | 773.00M | 626.00M | 518.00M | 523.00M | 455.00M |
| Total cash from operating activities | 410.00M | 427.00M | 267.00M | 167.00M | 58.00M |
| Depreciation | 109.00M | 96.00M | 104.00M | 108.00M | 108.00M |
| Other cashflows from investing activities | 2.00M | 3.00M | - | -81.00M | -62.00M |
| Dividends paid | 15.00M | 0.00M | 8.00M | 2.00M | 12.00M |
| Change to inventory | 30.00M | 1.00M | 52.00M | -105.00M | -92.00M |
| Change to account receivables | 6.00M | 61.00M | 13.00M | -156.00M | -78.00M |
| Sale purchase of stock | -57.00M | -63.00M | -106.00M | -30.00M | 0.00M |
| Other cashflows from financing activities | -29.00M | -19.00M | -37.00M | 341.00M | -25.00M |
| Change to netincome | - | - | - | 31.00M | 53.00M |
| Capital expenditures | 133.00M | 137.00M | 125.00M | 81.00M | 70.00M |
| Change receivables | - | - | - | -156.00M | -78.00M |
| Cash flows other operating | - | - | - | 13.00M | -11.00M |
| Cash and cash equivalents changes | - | - | - | 90.00M | -34.00M |
| Change in working capital | -16.00M | 38.00M | -72.00M | -105.00M | -153.00M |
| Stock based compensation | 45.00M | 41.00M | 34.00M | 26.00M | 18.00M |
| Other non cash items | 4.00M | 17.00M | 9.00M | 8.00M | 14.00M |
| Free cash flow | 277.00M | 290.00M | 142.00M | 86.00M | -12.00M |
Sector: Consumer Cyclical Industry: Auto Parts
|
Stock Name
|
Change
(USD) |
Price
(USD) |
Trailing
PE (x) |
Forward
PE (x) |
Price Sales
TTM (x) |
Price to Book Value (x)
|
Enterprise Value
to Revenue (x) |
Enterprise Value
to EBITDA (x) |
|---|---|---|---|---|---|---|---|---|
| VC Visteon Corp |
0.65 0.90% |
73.07 | 19.26 | 9.73 | 0.69 | 1.66 | 0.65 | 6.19 |
| ORLY O’Reilly Automotive Inc |
-2.37 2.62% |
88.07 | 27.74 | 23.75 | 3.71 | 206.18 | 4.30 | 19.07 |
| AZO AutoZone Inc |
-19.72 0.62% |
3137.04 | 25.25 | 24.21 | 3.05 | 13.38 | 3.65 | 17.03 |
| SMTOF Sumitomo Electric Industries Ltd |
- -% |
12.39 | 17.90 | 20.41 | 0.01 | 2.40 | 1.31 | 9.00 |
| SMTOY Sumitomo Electric Industries Ltd ADR |
0.06 1.00% |
6.06 | 16.31 | 18.35 | 0.01 | 2.16 | 1.31 | 9.05 |
Visteon Corporation, an automotive technology company, engages in the design, manufacture, and sale of automotive electronics and connected car solutions for vehicle manufacturers. It provides instrument clusters, including analog gauge clusters for 2-D and 3-D display-based devices; information displays that integrate a range of user interface technologies and graphics management capabilities, such as active privacy, TrueColor enhancement, local dimming, cameras, optics, haptic feedback, and light effects; and infotainment and connected car solutions, including scalable Android infotainment for seamless connectivity, as well as onboard artificial intelligence-based voice assistants with natural language understanding. It offers display audio and embedded infotainment platform that enables third-party developers to create apps through a software development kit and software simulation of the target hardware system; and wired and wireless battery management systems; and power electronics units. In addition, the company provides SmartCore, an automotive-grade, integrated domain controller; SmartCore Runtime, a middleware enabling communication between domains and apps to be shown on any display; and SmartCore Studio, a PC-based configuration tool to generate hypervisor configurations. Further, it offers CognitoAI, an in-house, automotive-grade A.I. software platform; Battery Management Systems, configurable battery management systems; High-Voltage Power Electronics, an integrated and scalable power electronics units; and engineering and software development services. It operates in the United States, Mexico, Portugal, Slovakia, Tunisia, rest of Europe, China, India, Japan, rest of the Asia Pacific, and South America. Visteon Corporation was incorporated in 2000 and is headquartered in Van Buren, Michigan.

One Village Center Drive, Van Buren, MI, United States, 48111

734 627 7384

10500
| Name | Title | Year Born |
|---|---|---|
| Mr. Sachin S. Lawande | Pres, CEO & Director | 1967 |
| Mr. Jerome J. Rouquet | Sr. VP & CFO | 1967 |
| Mr. Brett D. Pynnonen | Sr. VP & Chief Legal Officer | 1969 |
| Ms. Kristin E. Trecker | Sr. VP & Chief People Officer | 1965 |
| Mr. Robert R. Vallance | SVP of Global Customer Bus. Groups & New Technology Product Lines and GM of APAC Region | 1961 |
| Mr. Joao Paulo Ribeiro | Sr. VP of Operations, Supply Chain & Procurement | 1970 |
| Ms. Abigail S. Fleming | VP & Chief Accounting Officer | 1982 |
| Mr. Matthias Schulze | Sr. Director & Head of ADAS | NA |
| Mr. Wei Wei | Managing Director of China | NA |
| Qais Sharif | VP, GM of the Americas & Global VP of Display Product Lines | NA |
Disclaimer - (*)This information, including any data, is sourced from Unicorn Data Services SAS, trading as EOD Historical Data (“EODHD”) on an ‘as is’ basis, using their API. We cannot guarantee the completeness or validity of the information and data provided on this page, as well as via the API. In some cases, the data may include analyst ratings or recommendations sourced through the EODHD API, which are intended solely for general information purposes.
This information does not consider your personal objectives, financial situation, or needs. Kalkine is not liable for any errors or omissions in the information provided or for any actions taken in reliance on it. You should seek advice from a financial adviser, stockbroker or other professional adviser (including taxation and legal advice) as necessary before acting on this information.

Download a free report with stock ideas and industry insights for general information.
Download Free Report Now →


Basic Materials
 -0.49%
Communication Services
 +0.04%

Consumer Cyclical
+0.85%

Consumer Defensive
-0.18%

Energy
-0.08%

Financial Services
+0.51%
Financials
-2.62%

Healthcare
+0.41%

Industrials
+0.58%

Real Estate
+0.42%

Technology
-0.56%

Utilities
+0.40%
Note: Daily price change (%) by sector excluding stocks with +/-90% daily price change. Companies above $500 million market capitalization are considered.
 Portfolio
 Watchlist


 Please wait processing your request...