 CA
 NZ
 UK
 AU
 IND

 US


…
Trinity Biotech plc acquires, together with its subsidiaries, develops, acquires, manufactures, and markets medical diagnostic products for the clinical laboratory and point-of-care (POC) segments of the diagnostic market in the Americas and Ireland. The company offers clinical laboratory products, including diagnostic tests and instrumentation, which detects infectious diseases; sexually transmitted diseases consisting of syphilis and herpes; SARS-CoV-2; and epstein barr, measles, mumps, toxoplasmosis, cytomegalovirus, rubella, varicella and other viral pathogens, as well as products for the in-vitro diagnostic testing for haemoglobin A1c used in the monitoring and diagnosis of diabetes, and identifying those who are at a risk of developing diabetes. It also provides laboratory-testing services for Sjogren's syndrome, hearing loss, celiac disease, lupus, rheumatoid arthritis, systemic sclerosis, and other laboratory-testing services for autoimmune disorders. The company develops, manufactures, and sells products in the immunofluorescence assay, enzyme-linked immunosorbent, western blot, and line immunoassay formats; and provides reagent products, such as ACE, bile acids, oxalate, and glucose-6-phosphate dehydrogenase for diagnosis of liver and kidney diseases, as well as haemolytic anaemia. It serves public health authorities, non-governmental organisations, and clinical and reference laboratories through its direct sales force, as well as through a network of independent distributors and strategic partners. Trinity Biotech plc was incorporated in 1992 and is headquartered in Bray, Ireland.
Source: TradingView
The charts and visual representations are sourced from TradingView through embedded widgets. For any issues with chart display, please visit the TradingView website
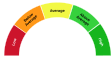
A unique technical analysis driven score developed by Kalkine showing momentum in stock prices based on select technical indicators identified.
Trinity Biotech plc is an Ireland-based medical diagnostics company that develops, manufactures and sells laboratory and point-of-care tests, notably for diabetes (HbA1c) and infectious disease assays, serving hospitals, clinics and reference laboratories. Long-term growth drivers include rising diabetes prevalence, expanding point-of-care testing demand and recurring consumable sales, which may benefit revenue stability and support scaling through its distribution network.
Material risks include strong competition from larger diagnostics companies, regulatory and reimbursement uncertainty, execution risk from limited scale, and exposure to supply-chain and currency fluctuations.

Note: The summary and risk score provided above is created by AI and should not be construed as a recommendation of Kalkine.


| Breakdown | 2022-12-31 | 2021-12-31 | 2020-12-31 | 2019-12-31 | 2018-12-31 |
|---|---|---|---|---|---|
| Type | yearly | yearly | yearly | yearly | yearly |
| Date | 2022-12-31 | 2021-12-31 | 2020-12-31 | 2019-12-31 | 2018-12-31 |
| Income before tax | -41.19M | 0.75M | -6.63M | 0.82M | 3.03M |
| Net income | -41.00M | 0.88M | -6.01M | -4.07M | 2.39M |
| Selling general administrative | 29.17M | 24.68M | 25.07M | 27.58M | 29.50M |
| Gross profit | 22.05M | 38.08M | 48.58M | 38.12M | 41.45M |
| Reconciled depreciation | 2.33M | 2.74M | 3.08M | 4.89M | 4.12M |
| Ebit | -10.91M | 13.15M | 19.11M | 0.87M | 3.30M |
| Ebitda | -8.28M | 15.90M | 22.18M | 5.77M | 7.42M |
| Depreciation and amortization | 2.64M | 2.74M | 3.08M | 4.89M | 4.12M |
| Operating income | -10.91M | 13.15M | 19.11M | 0.87M | 3.30M |
| Other operating expenses | 85.69M | 79.40M | 81.70M | 85.13M | 90.35M |
| Interest expense | 24.75M | 5.46M | 5.54M | 4.95M | 4.39M |
| Tax provision | -0.19M | -0.17M | -0.18M | -1.01M | -0.53M |
| Interest income | 0.30M | 0.00M | 0.04M | 0.70M | 2.12M |
| Net interest income | -24.44M | -4.81M | -4.86M | -5.88M | -2.96M |
| Extraordinary items | - | - | - | 0.08M | 0.57M |
| Income tax expense | -0.19M | -0.18M | -0.62M | 4.89M | 0.64M |
| Total revenue | 74.78M | 92.97M | 101.98M | 90.44M | 97.03M |
| Total operating expenses | 32.96M | 24.51M | 28.30M | 32.82M | 34.77M |
| Cost of revenue | 52.73M | 54.89M | 53.40M | 52.31M | 55.59M |
| Total other income expense net | -30.28M | -12.40M | -25.74M | -0.05M | -0.27M |
| Discontinued operations | - | -0.05M | -0.38M | 0.08M | 0.57M |
| Net income from continuing ops | -41.00M | 9.15M | 15.67M | -28.99M | -22.66M |
| Net income applicable to common shares | - | 0.88M | -6.39M | -28.91M | -22.09M |
| Breakdown | 2023-12-31 | 2022-12-31 | 2021-12-31 | 2020-12-31 | 2019-12-31 |
|---|---|---|---|---|---|
| Type | yearly | yearly | yearly | yearly | yearly |
| Date | 2023-12-31 | 2022-12-31 | 2021-12-31 | 2020-12-31 | 2019-12-31 |
| Total assets | 59.44M | 92.10M | 118.89M | 130.40M | 131.07M |
| Intangible assets | 16.27M | 22.73M | 23.44M | 21.27M | 31.06M |
| Other current assets | 2.04M | - | 1.95M | 1.16M | 22.97M |
| Total liab | 83.38M | 94.28M | 119.21M | 132.62M | 126.36M |
| Total stockholder equity | -23.95M | -2.18M | -0.32M | -2.22M | 4.71M |
| Deferred long term liab | - | - | 17.68M | 13.44M | 22.78M |
| Other current liab | 9.20M | -0.04M | 8.29M | 10.45M | -2.60M |
| Common stock | 1.97M | 1.96M | 1.21M | 1.21M | 1.22M |
| Capital stock | 1.97M | 1.96M | 1.21M | 1.21M | 1.21M |
| Retained earnings | -48.64M | -26.70M | 12.56M | 10.57M | 11.51M |
| Other liab | - | - | 4.86M | 6.28M | 7.14M |
| Good will | 0.00M | 12.54M | 12.54M | 12.59M | 12.59M |
| Other assets | - | - | 4.31M | 18.13M | 29.52M |
| Cash | 3.69M | 6.58M | 25.91M | 27.33M | 16.40M |
| Total current liabilities | 15.04M | 17.34M | 100.49M | 27.06M | 19.45M |
| Current deferred revenue | 0.05M | 0.11M | 0.14M | 4.45M | 0.29M |
| Net debt | 63.74M | 51.68M | 73.25M | 77.01M | 65.62M |
| Short term debt | 1.90M | 0.21M | 85.29M | 5.06M | 2.40M |
| Short long term debt | 0.21M | 0.21M | 83.31M | 2.90M | - |
| Short long term debt total | 67.43M | 58.26M | 99.16M | 104.34M | 82.03M |
| Other stockholder equity | 21.70M | 28.25M | -8.73M | -8.73M | 16.19M |
| Property plant equipment | - | - | 5.92M | 8.55M | 9.29M |
| Total current assets | 39.04M | 46.67M | 72.69M | 83.30M | 71.39M |
| Net tangible assets | - | - | -36.30M | -22.64M | -16.16M |
| Short term investments | - | - | - | 0.00M | 1.17M |
| Net receivables | 13.38M | 17.59M | 15.71M | 24.59M | 22.97M |
| Long term debt | 54.65M | 58.05M | - | 83.88M | 82.02M |
| Inventory | 19.93M | 22.50M | 29.12M | 30.22M | 32.02M |
| Accounts payable | 3.88M | 17.05M | 6.76M | 7.10M | 19.35M |
| Accumulated other comprehensive income | 1.03M | -5.69M | -5.36M | -5.27M | -24.21M |
| Common stock total equity | - | - | - | 1.21M | 1.21M |
| Treasury stock | - | - | - | - | -24.92M |
| Non currrent assets other | 0.04M | 0.27M | 0.06M | 0.06M | 0.48M |
| Non current assets total | 20.39M | 45.44M | 46.21M | 47.10M | 59.68M |
| Capital lease obligations | 12.57M | 13.94M | 15.85M | 18.74M | 20.15M |
| Long term debt total | - | - | - | - | 99.77M |
| Breakdown | 2022-12-31 | 2021-12-31 | 2020-12-31 | 2019-12-31 | 2018-12-31 |
|---|---|---|---|---|---|
| Type | yearly | yearly | yearly | yearly | yearly |
| Date | 2022-12-31 | 2021-12-31 | 2020-12-31 | 2019-12-31 | 2018-12-31 |
| Investments | -5.98M | -8.69M | -10.20M | -11.85M | -17.39M |
| Change to liabilities | - | -7.59M | 4.99M | 0.15M | -3.42M |
| Total cashflows from investing activities | - | -7.07M | -10.20M | -11.85M | -17.39M |
| Net borrowings | - | -1.08M | 1.28M | -3.53M | -11.94M |
| Total cash from financing activities | -12.32M | -6.02M | -2.72M | -4.00M | -16.98M |
| Change to operating activities | - | -4.98M | 7.69M | 7.69M | 7.69M |
| Net income | -41.01M | 0.88M | -6.39M | 12.20M | 13.07M |
| Change in cash | -19.33M | -1.42M | 10.93M | -13.88M | -27.33M |
| Begin period cash flow | 25.91M | 27.33M | 16.40M | 30.28M | 57.61M |
| End period cash flow | 6.58M | 25.91M | 27.33M | 16.40M | 30.28M |
| Total cash from operating activities | -0.92M | 13.24M | 23.75M | 5.47M | 6.93M |
| Issuance of capital stock | 25.34M | - | - | - | 0.00M |
| Depreciation | 2.33M | 2.74M | 3.08M | 4.89M | 4.12M |
| Other cashflows from investing activities | - | 1.62M | -0.89M | -0.89M | 1.46M |
| Dividends paid | 0.00M | 0.00M | 0.00M | 0.00M | 0.00M |
| Change to inventory | -0.88M | -4.41M | -3.42M | -2.96M | 1.99M |
| Change to account receivables | - | 6.24M | -2.49M | 3.14M | -5.96M |
| Sale purchase of stock | - | - | 0.00M | 0.00M | -0.43M |
| Other cashflows from financing activities | 86.36M | -3.08M | 0.52M | -0.46M | -4.13M |
| Change to netincome | - | 12.81M | 27.42M | 30.42M | 30.98M |
| Capital expenditures | 5.98M | 8.69M | 10.20M | 15.36M | 17.29M |
| Change in working capital | -1.66M | -0.17M | 4.14M | -0.80M | -7.60M |
| Stock based compensation | 1.76M | 1.10M | 0.79M | 0.76M | 1.37M |
| Other non cash items | 37.85M | 8.86M | 22.31M | -10.57M | -2.92M |
| Free cash flow | -6.90M | 4.55M | 13.56M | -9.88M | -10.35M |
Sector: Healthcare Industry: Medical Devices
|
Stock Name
|
Change
(USD) |
Price
(USD) |
Trailing
PE (x) |
Forward
PE (x) |
Price Sales
TTM (x) |
Price to Book Value (x)
|
Enterprise Value
to Revenue (x) |
Enterprise Value
to EBITDA (x) |
|---|---|---|---|---|---|---|---|---|
| TRIB Trinity Biotech plc |
0.04 0.69% |
5.86 | - | - | 0.28 | 5.11 | 1.82 | -6.06 |
| ABT Abbott Laboratories |
-0.71 0.65% |
108.58 | 25.97 | 17.24 | 3.57 | 3.20 | 3.81 | 16.75 |
| MDT Medtronic PLC |
0.28 0.28% |
101.89 | 26.60 | 15.87 | 3.35 | 2.08 | 3.90 | 14.12 |
| SYK Stryker Corporation |
-2.16 0.68% |
316.63 | 29.23 | 16.86 | 4.18 | 4.51 | 4.63 | 17.16 |
| SEMHF Siemens Healthineers AG |
- -% |
47.31 | 39.57 | 21.32 | 3.01 | 3.29 | 2.95 | 16.92 |
Trinity Biotech plc acquires, together with its subsidiaries, develops, acquires, manufactures, and markets medical diagnostic products for the clinical laboratory and point-of-care (POC) segments of the diagnostic market in the Americas and Ireland. The company offers clinical laboratory products, including diagnostic tests and instrumentation, which detects infectious diseases; sexually transmitted diseases consisting of syphilis and herpes; SARS-CoV-2; and epstein barr, measles, mumps, toxoplasmosis, cytomegalovirus, rubella, varicella and other viral pathogens, as well as products for the in-vitro diagnostic testing for haemoglobin A1c used in the monitoring and diagnosis of diabetes, and identifying those who are at a risk of developing diabetes. It also provides laboratory-testing services for Sjogren's syndrome, hearing loss, celiac disease, lupus, rheumatoid arthritis, systemic sclerosis, and other laboratory-testing services for autoimmune disorders. The company develops, manufactures, and sells products in the immunofluorescence assay, enzyme-linked immunosorbent, western blot, and line immunoassay formats; and provides reagent products, such as ACE, bile acids, oxalate, and glucose-6-phosphate dehydrogenase for diagnosis of liver and kidney diseases, as well as haemolytic anaemia. It serves public health authorities, non-governmental organisations, and clinical and reference laboratories through its direct sales force, as well as through a network of independent distributors and strategic partners. Trinity Biotech plc was incorporated in 1992 and is headquartered in Bray, Ireland.
| Name | Title | Year Born |
|---|---|---|
| Mr. John Gillard | CFO, Company Sec. & Exec. Director | 1981 |
| Dr. James Walsh Ph.D. | Exec. Director | 1958 |
| Mr. Aris Kekedjian | CEO & Chairman | 1967 |
| Mr. Simon Dunne | Chief Accounting Officer | 1974 |
| Ms. Eibhlin Kelly | Chief Information Officer | 1984 |
| Mr. Fernando Devia | Exec. VP of Sales | 1963 |
| Mr. Sanjiv Suri | Sr. VP of Global Sales & GM of North America | 1959 |
| Mr. John Gillard | President, CEO, Company Secretary & Director | 1981 |
| Mr. Ronan O'Caoimh | Founder & Director | 1956 |
| Dr. James Walsh Ph.D. | Executive Director of Business Development & Executive Director | 1958 |
Disclaimer - (*)This information, including any data, is sourced from Unicorn Data Services SAS, trading as EOD Historical Data (“EODHD”) on an ‘as is’ basis, using their API. We cannot guarantee the completeness or validity of the information and data provided on this page, as well as via the API. In some cases, the data may include analyst ratings or recommendations sourced through the EODHD API, which are intended solely for general information purposes.
This information does not consider your personal objectives, financial situation, or needs. Kalkine is not liable for any errors or omissions in the information provided or for any actions taken in reliance on it. You should seek advice from a financial adviser, stockbroker or other professional adviser (including taxation and legal advice) as necessary before acting on this information.

Download a free report with stock ideas and industry insights for general information.
Download Free Report Now →


Basic Materials
 -1.40%
Communication Services
-0.45%

Consumer Cyclical
-0.55%

Consumer Defensive
-0.01%

Energy
-0.01%

Financial Services
-0.40%
Financials
-0.15%

Healthcare
-1.15%

Industrials
-0.46%

Real Estate
-0.29%

Technology
-1.22%

Utilities
-0.10%
Note: Daily price change (%) by sector excluding stocks with +/-90% daily price change. Companies above $500 million market capitalization are considered.
 Portfolio
 Watchlist


 +0.55%
 Please wait processing your request...