 CA
 NZ
 UK
 AU
 IND

 US


…
Stratasys Ltd. provides connected polymer-based 3D printing solutions. It offers range of 3D printing systems, including polyjet printers, fused deposition modeling (FDM) printers designed for prototyping, manufacturing tools, and production parts; PolyJet printers to print multiple materials including color printing in a single part build; pantone having validated colors, and multiple material properties; TechStyleTM, which allows 3D printing directly on different kinds of fabrics, enabling series productions in the fashion industry; Anatomy, which helps medical device companies optimize design throughout the product lifecycle; GelMatrix resin; TissueMatrix resin; BoneMatrix resin; and Digital Anatomy Creator to create different anatomical structures by customizing specific bio-mechanical properties and color. It also offers GrabCAD software for medical users; J35 Pro 3D an all-in-one, multi material desktop 3D printer; 5 DentaJet and J3 DentaJet for the dental and medical; stereolithography printers; Neo range of industrial stereolithography (SLA) 3D printers; Somos resin; Titanium control software; and Origin P3 printer; Origin 3D printers; SAF printers. In addition, it provides consumables, software, paid parts, and professional services; and prototyping, design, and manufacturing aids and production solutions. Stratasys Ltd. is headquartered in Minnetonka, Minnesota.
Source: TradingView
The charts and visual representations are sourced from TradingView through embedded widgets. For any issues with chart display, please visit the TradingView website
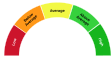
A unique technical analysis driven score developed by Kalkine showing momentum in stock prices based on select technical indicators identified.
Stratasys Ltd is an established additive-manufacturing company that develops and sells industrial 3D printers, specialty materials and software to aerospace, healthcare, automotive and other industrial customers. Long-term growth may be supported by broader adoption of additive manufacturing for production parts, recurring consumables and services revenue, and expansion of software-enabled workflows; investors may find the company attractive for its installed base and diversified technology portfolio.
Principal risks include cyclical capital spending, intense competition from other hardware and materials providers, technological obsolescence and execution risk in scaling higher-margin production applications.

Note: The summary and risk score provided above is created by AI and should not be construed as a recommendation of Kalkine.


| Breakdown | 2025-12-31 | 2024-12-31 | 2023-12-31 | 2022-12-31 | 2021-12-31 |
|---|---|---|---|---|---|
| Type | yearly | yearly | yearly | yearly | yearly |
| Date | 2025-12-31 | 2024-12-31 | 2023-12-31 | 2022-12-31 | 2021-12-31 |
| Income before tax | -101.20M | -117.31M | -117.29M | -17.79M | -66.84M |
| Minority interest | - | - | - | 0.00M | 0.00M |
| Net income | -104.28M | -120.28M | -123.07M | -23.25M | -62.93M |
| Selling general administrative | 222.47M | 233.92M | 251.78M | 240.75M | 250.94M |
| Selling and marketing expenses | - | 4.30M | 4.20M | - | - |
| Gross profit | 259.26M | 256.82M | 267.02M | 276.47M | 260.08M |
| Reconciled depreciation | 43.17M | 45.34M | 52.52M | 59.77M | 56.10M |
| Ebit | -101.20M | -114.59M | -80.68M | -57.16M | -79.16M |
| Ebitda | -58.03M | -69.25M | -31.71M | -96.30M | -37.47M |
| Depreciation and amortization | 43.17M | 45.34M | 48.97M | -39.14M | 41.70M |
| Operating income | -58.79M | -85.66M | -87.58M | -57.16M | -79.16M |
| Other operating expenses | 609.90M | 658.12M | 715.18M | 708.64M | 686.38M |
| Interest expense | - | 2.72M | - | 0.23M | 27.67M |
| Tax provision | 3.08M | 2.97M | 7.80M | 5.45M | -3.91M |
| Net interest income | 10.39M | 1.68M | 4.46M | 0.23M | -2.08M |
| Income tax expense | 3.08M | 2.97M | 5.78M | 5.45M | -3.91M |
| Total revenue | 551.10M | 572.46M | 627.60M | 651.48M | 607.22M |
| Total operating expenses | 318.06M | 342.48M | 354.60M | 333.63M | 339.24M |
| Cost of revenue | 291.84M | 315.64M | 360.57M | 375.02M | 347.14M |
| Total other income expense net | -42.41M | -31.65M | -29.71M | 39.37M | 12.32M |
| Net income from continuing ops | -104.28M | -120.28M | -110.51M | -28.97M | -61.98M |
| Net income applicable to common shares | - | - | - | -28.97M | -61.98M |
| Breakdown | 2025-12-31 | 2024-12-31 | 2023-12-31 | 2022-12-31 | 2021-12-31 |
|---|---|---|---|---|---|
| Type | yearly | yearly | yearly | yearly | yearly |
| Date | 2025-12-31 | 2024-12-31 | 2023-12-31 | 2022-12-31 | 2021-12-31 |
| Total assets | 1073.76M | 1029.75M | 1133.90M | 1259.79M | 1277.22M |
| Intangible assets | 95.84M | 106.25M | 127.78M | 121.40M | 152.24M |
| Other current assets | 31.74M | 29.47M | 32.52M | 27.82M | 33.12M |
| Total liab | 230.86M | 236.75M | 249.07M | 300.36M | 321.21M |
| Total stockholder equity | 842.90M | 792.99M | 884.84M | 959.43M | 956.01M |
| Deferred long term liab | - | - | - | 9.60M | 7.40M |
| Other current liab | 65.59M | 68.95M | 70.53M | 80.34M | 100.04M |
| Common stock | 0.24M | 0.20M | 0.20M | 0.19M | 0.18M |
| Capital stock | 0.24M | 0.20M | 0.20M | 0.19M | 0.18M |
| Retained earnings | -2424.49M | -2320.21M | -2199.93M | -2076.85M | -2047.88M |
| Other liab | - | - | - | 79.03M | 103.05M |
| Good will | 101.60M | 99.08M | 100.05M | 64.95M | 65.14M |
| Other assets | - | - | - | 18.42M | 12.52M |
| Cash | 94.53M | 70.20M | 82.58M | 150.47M | 243.18M |
| Total current liabilities | 163.04M | 167.21M | 176.43M | 210.65M | 210.47M |
| Current deferred revenue | 47.84M | 46.35M | 52.61M | 50.22M | 51.17M |
| Net debt | -68.03M | -38.11M | -63.92M | -132.63M | -228.21M |
| Short term debt | 6.60M | 6.93M | 6.50M | 7.17M | 7.28M |
| Short long term debt total | 26.50M | 32.09M | 18.66M | 17.84M | 14.97M |
| Other stockholder equity | 3273.35M | 3121.03M | 3091.65M | 3048.91M | 3012.48M |
| Property plant equipment | - | - | - | 213.19M | 217.95M |
| Total current assets | 581.98M | 512.96M | 560.10M | 700.22M | 800.70M |
| Long term investments | 63.10M | 80.20M | 115.08M | 141.61M | 28.67M |
| Net tangible assets | - | - | - | 773.08M | 738.63M |
| Short term investments | 150.00M | 80.50M | 80.00M | 177.37M | 259.00M |
| Net receivables | 160.48M | 152.98M | 172.01M | 144.74M | 129.38M |
| Inventory | 145.24M | 179.81M | 192.98M | 194.05M | 129.15M |
| Accounts payable | 43.02M | 44.98M | 46.78M | 72.92M | 51.98M |
| Accumulated other comprehensive income | -6.20M | -8.03M | -7.08M | -12.82M | -8.77M |
| Non currrent assets other | 13.25M | 13.73M | -113.33M | 18.42M | 12.52M |
| Non current assets total | 491.78M | 516.78M | 573.81M | 559.57M | 476.52M |
| Capital lease obligations | 26.50M | 32.09M | 18.66M | 17.84M | 14.97M |
| Breakdown | 2025-12-31 | 2024-12-31 | 2023-12-31 | 2022-12-31 | 2021-12-31 |
|---|---|---|---|---|---|
| Type | yearly | yearly | yearly | yearly | yearly |
| Date | 2025-12-31 | 2024-12-31 | 2023-12-31 | 2022-12-31 | 2021-12-31 |
| Investments | -69.50M | -14.82M | -3.83M | -7.21M | -243.78M |
| Change to liabilities | - | - | - | 26.19M | 24.98M |
| Total cashflows from investing activities | -112.23M | -14.82M | -3.83M | -7.21M | -291.17M |
| Total cash from financing activities | 117.97M | -3.31M | -1.52M | -2.77M | 227.31M |
| Change to operating activities | - | - | - | -15.30M | 19.65M |
| Net income | -104.28M | -120.28M | -123.07M | -28.97M | -61.98M |
| Change in cash | 24.28M | -11.79M | -67.82M | -92.61M | -28.92M |
| Begin period cash flow | 71.08M | 82.86M | 150.69M | 243.29M | 272.22M |
| End period cash flow | 95.36M | 71.08M | 82.86M | 150.69M | 243.29M |
| Total cash from operating activities | 15.14M | 7.83M | -61.65M | -75.41M | 35.82M |
| Issuance of capital stock | 119.29M | 0.00M | 0.00M | 0.00M | 218.85M |
| Depreciation | 43.17M | 45.34M | 48.97M | 59.77M | 56.10M |
| Other cashflows from investing activities | -1.06M | -1.79M | -1.61M | 0.05M | -0.08M |
| Change to inventory | 35.35M | 9.36M | 4.57M | -87.34M | -0.05M |
| Change to account receivables | -17.97M | 4.46M | -25.65M | -28.88M | -25.00M |
| Sale purchase of stock | 0.00M | -2.00M | 0.00M | - | - |
| Other cashflows from financing activities | -1.32M | -1.32M | -1.53M | -2.77M | 8.46M |
| Change to netincome | - | - | - | -0.87M | 22.13M |
| Capital expenditures | 22.11M | 12.71M | 15.03M | 19.75M | 26.75M |
| Change in working capital | 10.56M | 9.92M | -40.52M | -105.33M | 19.58M |
| Stock based compensation | 24.27M | 25.62M | 31.61M | 33.46M | 30.98M |
| Other non cash items | 40.18M | 45.95M | 23.13M | -35.26M | -11.49M |
| Free cash flow | -6.97M | -4.89M | -76.67M | -95.16M | 9.07M |
Sector: Technology Industry: Computer Hardware
|
Stock Name
|
Change
(USD) |
Price
(USD) |
Trailing
PE (x) |
Forward
PE (x) |
Price Sales
TTM (x) |
Price to Book Value (x)
|
Enterprise Value
to Revenue (x) |
Enterprise Value
to EBITDA (x) |
|---|---|---|---|---|---|---|---|---|
| SSYS Stratasys Ltd |
0.26 4.05% |
6.68 | - | 30.12 | 1.20 | 0.81 | 0.87 | 494.84 |
| SNDK Sandisk Corp |
53.95 6.46% |
889.01 | 21.05 | 6.87 | 11.07 | 14.44 | 11.00 | 16.82 |
| STX Seagate Technology PLC |
42.79 9.28% |
503.78 | 57.81 | 22.52 | 14.39 | 84.53 | 15.20 | 43.61 |
| DELL Dell Technologies Inc |
0.13 0.04% |
346.31 | 24.44 | 15.65 | 1.22 | 4.39 | 1.34 | 12.81 |
| ANET Arista Networks |
15.32 8.97% |
186.12 | 39.49 | 31.45 | 13.08 | 11.15 | 12.18 | 31.54 |
Stratasys Ltd. provides connected polymer-based 3D printing solutions. It offers range of 3D printing systems, including polyjet printers, fused deposition modeling (FDM) printers designed for prototyping, manufacturing tools, and production parts; PolyJet printers to print multiple materials including color printing in a single part build; pantone having validated colors, and multiple material properties; TechStyleTM, which allows 3D printing directly on different kinds of fabrics, enabling series productions in the fashion industry; Anatomy, which helps medical device companies optimize design throughout the product lifecycle; GelMatrix resin; TissueMatrix resin; BoneMatrix resin; and Digital Anatomy Creator to create different anatomical structures by customizing specific bio-mechanical properties and color. It also offers GrabCAD software for medical users; J35 Pro 3D an all-in-one, multi material desktop 3D printer; 5 DentaJet and J3 DentaJet for the dental and medical; stereolithography printers; Neo range of industrial stereolithography (SLA) 3D printers; Somos resin; Titanium control software; and Origin P3 printer; Origin 3D printers; SAF printers. In addition, it provides consumables, software, paid parts, and professional services; and prototyping, design, and manufacturing aids and production solutions. Stratasys Ltd. is headquartered in Minnetonka, Minnesota.
| Name | Title | Year Born |
|---|---|---|
| Mr. Yoav Zeif | Chief Exec. Officer | 1966 |
| Mr. David Reis | Vice Chairman | 1961 |
| Mr. S. Scott Crump | Co-Founder & Director | 1953 |
| Mr. Omer Krieger | Exec. VP of Product Strategy & Corp. Devel. | NA |
| Mr. Richard Garrity | Chief Industrial Bus. Officer | NA |
| Mr. Guy Yair | ROW Pres | 1972 |
| Mr. Eitan Zamir | Chief Financial Officer | NA |
| Mr. Yossi Azarzar | Chief Operating Officer | 1962 |
| Mr. Guy Menchik | Chief Technology Officer | NA |
| Mr. Yonah Lloyd | CCO & VP of Investor Relations | 1965 |
Disclaimer - (*)This information, including any data, is sourced from Unicorn Data Services SAS, trading as EOD Historical Data (“EODHD”) on an ‘as is’ basis, using their API. We cannot guarantee the completeness or validity of the information and data provided on this page, as well as via the API. In some cases, the data may include analyst ratings or recommendations sourced through the EODHD API, which are intended solely for general information purposes.
This information does not consider your personal objectives, financial situation, or needs. Kalkine is not liable for any errors or omissions in the information provided or for any actions taken in reliance on it. You should seek advice from a financial adviser, stockbroker or other professional adviser (including taxation and legal advice) as necessary before acting on this information.

Download a free report with stock ideas and industry insights for general information.
Download Free Report Now →


Basic Materials
 +1.88%
Communication Services
+1.14%

Consumer Cyclical
+1.04%

Consumer Defensive
+0.57%

Energy
+0.50%

Financial Services
+0.81%
Financials
+0.24%

Healthcare
+1.35%

Industrials
+1.54%

Real Estate
+0.24%

Technology
+2.32%

Utilities
+0.48%
Note: Daily price change (%) by sector excluding stocks with +/-90% daily price change. Companies above $500 million market capitalization are considered.
 Portfolio
 Watchlist


 -4.40%
 Please wait processing your request...