 CA
 NZ
 UK
 AU
 IND

 US


…
Smithfield Foods, Inc., together with its subsidiaries, produces various packaged meats and fresh pork products in the United States and internationally. It operates through Packaged Meats, Fresh Pork, Hog Production, and Other segments. The Packaged Meats segment processes fresh meat into various packaged meats products, including bacon, sausage, hot dogs, deli and lunch meats, dry sausage products, ham products, ready-to-eat products, and prepared foods to retail and foodservice customers. This segment markets its packaged meat products under the Smithfield, Eckrich, Nathan's Famous, Farmland, Armour, Farmer John, Kretschmar, Krakus, John Morrell, Cook's, Gwaltney, Carando, Margherita, Curly's and Smithfield Culinary, as well as under private labels. The Fresh Pork segment processes live hogs into a variety of primal, sub-primal, and offal products, such as bellies, butts, hams, loins, trimmings, picnics, and ribs. This segment sells its fresh pork products to retail, foodservice and industrial customers, as well as to export markets, including China, Mexico, Japan, South Korea, and Canada. The Hog Production segment produces and raises its hogs on various company-owned farms and farms that are owned and operated by contract farmers. This segment also sells livestock feed and grains; and provides transportation and other ancillary services. The Other segment engages in the bioscience operations uses raw materials from hogs that process to manufacture heparin products, including an active pharmaceutical ingredient that mitigates the risk of blood clots; and produces fresh pork products in Mexico. The company was founded in 1936 and is headquartered in Smithfield, Virginia. Smithfield Foods, Inc. is a subsidiary of SFDS UK Holdings Limited.
Source: TradingView
The charts and visual representations are sourced from TradingView through embedded widgets. For any issues with chart display, please visit the TradingView website
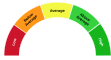
A unique technical analysis driven score developed by Kalkine showing momentum in stock prices based on select technical indicators identified.


| Breakdown | 2025-12-31 | 2024-12-31 | 2023-12-31 | 2022-12-31 | 2021-12-31 |
|---|---|---|---|---|---|
| Type | yearly | yearly | yearly | yearly | yearly |
| Date | 2025-12-31 | 2024-12-31 | 2023-12-31 | 2022-12-31 | 2021-12-31 |
| Income before tax | 1282.00M | 1069.00M | -174.00M | 1042.00M | 486.00M |
| Minority interest | -11.00M | -16.00M | -5.00M | -11.00M | -1.00M |
| Net income | 987.00M | 953.00M | 17.00M | 870.00M | 472.00M |
| Selling general administrative | 849.00M | 737.00M | 714.00M | 680.00M | 939.00M |
| Selling and marketing expenses | - | 97.00M | 123.00M | 127.00M | 116.00M |
| Gross profit | 2089.00M | 1897.00M | 889.00M | 1495.00M | 1572.00M |
| Reconciled depreciation | 332.00M | 339.00M | 427.00M | 440.00M | 331.00M |
| Ebit | 1311.00M | 1127.00M | -53.00M | 1134.00M | 551.00M |
| Ebitda | 1643.00M | 1466.00M | 374.00M | 1574.00M | 882.00M |
| Depreciation and amortization | 332.00M | 339.00M | 427.00M | 440.00M | 331.00M |
| Operating income | 1292.00M | 1118.00M | -56.00M | 1117.00M | 521.00M |
| Other operating expenses | 14239.00M | 13024.00M | 14696.00M | 15082.00M | 14488.00M |
| Interest expense | 41.00M | 66.00M | 76.00M | 87.00M | 93.00M |
| Tax provision | 283.00M | 271.00M | -41.00M | 231.00M | 97.00M |
| Net interest income | -41.00M | -66.00M | -76.00M | -87.00M | -93.00M |
| Income tax expense | 283.00M | 271.00M | -41.00M | 231.00M | 97.00M |
| Total revenue | 15531.00M | 14142.00M | 14640.00M | 16199.00M | 15009.00M |
| Total operating expenses | 797.00M | 780.00M | 945.00M | 378.00M | 1051.00M |
| Cost of revenue | 13442.00M | 12244.00M | 13751.00M | 14704.00M | 13437.00M |
| Total other income expense net | -10.00M | -49.00M | -118.00M | -75.00M | -35.00M |
| Net income from continuing ops | 998.00M | 798.00M | -133.00M | 811.00M | 389.00M |
| Breakdown | 2025-12-31 | 2024-12-31 | 2023-12-31 | 2022-12-31 | 2021-12-31 |
|---|---|---|---|---|---|
| Type | yearly | yearly | yearly | yearly | yearly |
| Date | 2025-12-31 | 2024-12-31 | 2023-12-31 | 2022-12-31 | 2021-12-31 |
| Total assets | 12177.00M | 11054.00M | 13317.00M | 13847.00M | - |
| Intangible assets | 1260.00M | 1266.00M | 1273.00M | 1281.00M | - |
| Other current assets | 276.00M | 289.00M | 1121.00M | 1306.00M | - |
| Total liab | 5112.00M | 4995.00M | 5830.00M | 6276.00M | - |
| Total stockholder equity | 6801.00M | 6059.00M | 7487.00M | 7571.00M | - |
| Other current liab | 811.00M | 856.00M | 1529.00M | 1493.00M | - |
| Capital stock | 0.00M | 0.00M | 0.00M | 0.00M | - |
| Retained earnings | 3776.00M | 3184.00M | 3588.00M | 3894.00M | - |
| Good will | 1623.00M | 1613.00M | 1627.00M | 1617.00M | - |
| Other assets | - | - | - | -1.00M | - |
| Cash | 1539.00M | 943.00M | 687.00M | 547.00M | - |
| Total current liabilities | 1741.00M | 1706.00M | 2450.00M | 2589.00M | - |
| Net debt | 857.00M | 1415.00M | 1776.00M | 1922.00M | - |
| Short term debt | 74.00M | 73.00M | 132.00M | 81.00M | - |
| Short long term debt | 3.00M | 17.00M | 69.00M | 9.00M | - |
| Short long term debt total | 2396.00M | 2358.00M | 2463.00M | 2469.00M | - |
| Other stockholder equity | 3339.00M | 3102.00M | 4153.00M | 4188.00M | - |
| Total current assets | 5166.00M | 4202.00M | 4921.00M | 5543.00M | - |
| Long term investments | 209.00M | 202.00M | 191.00M | 224.00M | - |
| Net receivables | 1023.00M | 558.00M | 577.00M | 756.00M | - |
| Long term debt | 2000.00M | 1983.00M | 2006.00M | 2029.00M | - |
| Inventory | 2328.00M | 2412.00M | 2536.00M | 2934.00M | - |
| Accounts payable | 856.00M | 777.00M | 789.00M | 1015.00M | - |
| Accumulated other comprehensive income | -314.00M | -452.00M | -500.00M | -708.00M | - |
| Non currrent assets other | 306.00M | 260.00M | 1577.00M | 1397.00M | - |
| Non current assets total | 7011.00M | 6852.00M | 8396.00M | 8305.00M | - |
| Capital lease obligations | 393.00M | 358.00M | 388.00M | 431.00M | - |
| Breakdown | 2025-12-31 | 2024-12-31 | 2023-12-31 | 2022-12-31 | 2021-12-31 |
|---|---|---|---|---|---|
| Type | yearly | yearly | yearly | yearly | yearly |
| Date | 2025-12-31 | 2024-12-31 | 2023-12-31 | 2022-12-31 | 2021-12-31 |
| Investments | - | -469.00M | -322.00M | 193.00M | -330.00M |
| Total cashflows from investing activities | -309.00M | -469.00M | -322.00M | 193.00M | -330.00M |
| Net borrowings | -3.00M | -32.00M | -11.00M | -16.00M | -230.00M |
| Total cash from financing activities | -164.00M | -464.00M | -533.00M | -477.00M | -337.00M |
| Net income | 987.00M | 798.00M | -139.00M | 811.00M | 388.00M |
| Change in cash | 596.00M | 192.00M | 140.00M | 245.00M | -704.90M |
| Begin period cash flow | 943.00M | 751.00M | 547.00M | 325.00M | 704.90M |
| End period cash flow | 1539.00M | 943.00M | 687.00M | 570.00M | 325.00M |
| Total cash from operating activities | 1059.00M | 1137.00M | 1034.00M | 517.00M | 786.00M |
| Issuance of capital stock | 236.00M | 0.00M | 0.00M | - | - |
| Depreciation | 332.00M | 339.00M | 427.00M | 440.00M | 331.00M |
| Other cashflows from investing activities | 32.00M | -106.00M | -126.00M | -52.00M | -122.00M |
| Dividends paid | 396.00M | 288.00M | 323.00M | 496.00M | 192.00M |
| Change to inventory | 118.00M | 138.00M | 469.00M | -307.00M | -184.00M |
| Change to account receivables | -470.00M | -6.00M | 157.00M | -33.00M | -2.00M |
| Other cashflows from financing activities | -1.00M | -144.00M | -199.00M | 35.00M | 85.00M |
| Capital expenditures | 341.00M | 350.00M | 401.00M | 338.00M | 213.00M |
| Change in working capital | -339.00M | -285.00M | 551.00M | -308.00M | 30.00M |
| Stock based compensation | 9.00M | 0.00M | 0.00M | - | - |
| Other non cash items | -24.00M | 194.00M | 325.00M | -428.00M | 5.00M |
| Free cash flow | 718.00M | 787.00M | 633.00M | 179.00M | 573.00M |
Sector: Consumer Defensive Industry: Packaged Foods
|
Stock Name
|
Change
(USD) |
Price
(USD) |
Trailing
PE (x) |
Forward
PE (x) |
Price Sales
TTM (x) |
Price to Book Value (x)
|
Enterprise Value
to Revenue (x) |
Enterprise Value
to EBITDA (x) |
|---|---|---|---|---|---|---|---|---|
| SFD Smithfield Foods, Inc. Common Stock |
0.02 0.11% |
18.33 | 7.55 | 10.24 | 0.51 | 1.14 | 0.58 | 5.30 |
| NSRGF Nestle SA |
1.11 1.12% |
100.36 | 26.86 | 18.76 | 3.13 | 7.10 | 3.81 | 21.70 |
| NSRGY Nestle SA ADR |
-0.52 0.52% |
100.31 | 26.82 | 18.66 | 3.18 | 7.07 | 3.81 | 21.70 |
| DANOY Danone PK |
-0.09 0.65% |
13.74 | 24.23 | 17.64 | 1.88 | 2.57 | 1.88 | 11.70 |
| GPDNF Danone S.A |
- -% |
69.76 | 20.30 | 14.75 | 1.65 | 2.24 | 1.76 | 10.92 |
Smithfield Foods, Inc., together with its subsidiaries, produces various packaged meats and fresh pork products in the United States and internationally. It operates through Packaged Meats, Fresh Pork, Hog Production, and Other segments. The Packaged Meats segment processes fresh meat into various packaged meats products, including bacon, sausage, hot dogs, deli and lunch meats, dry sausage products, ham products, ready-to-eat products, and prepared foods to retail and foodservice customers. This segment markets its packaged meat products under the Smithfield, Eckrich, Nathan's Famous, Farmland, Armour, Farmer John, Kretschmar, Krakus, John Morrell, Cook's, Gwaltney, Carando, Margherita, Curly's and Smithfield Culinary, as well as under private labels. The Fresh Pork segment processes live hogs into a variety of primal, sub-primal, and offal products, such as bellies, butts, hams, loins, trimmings, picnics, and ribs. This segment sells its fresh pork products to retail, foodservice and industrial customers, as well as to export markets, including China, Mexico, Japan, South Korea, and Canada. The Hog Production segment produces and raises its hogs on various company-owned farms and farms that are owned and operated by contract farmers. This segment also sells livestock feed and grains; and provides transportation and other ancillary services. The Other segment engages in the bioscience operations uses raw materials from hogs that process to manufacture heparin products, including an active pharmaceutical ingredient that mitigates the risk of blood clots; and produces fresh pork products in Mexico. The company was founded in 1936 and is headquartered in Smithfield, Virginia. Smithfield Foods, Inc. is a subsidiary of SFDS UK Holdings Limited.

200 Commerce Street, Smithfield, VA, United States, 23430

757 365 3000

34000
| Name | Title | Year Born |
|---|---|---|
| Mr. Charles Shane Smith | President, CEO & Director | 1974 |
| Mr. Mark L. Hall | Chief Financial Officer | 1970 |
| Mr. Steven J. France | President of Packaged Meats | 1967 |
| Mr. Keller D. Watts | Chief Business Officer | 1972 |
| Dr. Doug Sutton Ph.D. | Chief Manufacturing Officer | 1971 |
| Mr. Robert Allen Brobst Jr. | Principal Accounting Officer | NA |
| Ms. Julie MacMedan | Vice President of Investor Relations | NA |
| Ms. Tennille J. Checkovich J.D. | Chief Legal Officer | 1977 |
| Ms. Allyson Bouldon Esq., J.D. | Chief Ethics & Compliance Officer | NA |
| Mr. Brendan Smith | Chief Marketing Officer | NA |
Disclaimer - (*)This information, including any data, is sourced from Unicorn Data Services SAS, trading as EOD Historical Data (“EODHD”) on an ‘as is’ basis, using their API. We cannot guarantee the completeness or validity of the information and data provided on this page, as well as via the API. In some cases, the data may include analyst ratings or recommendations sourced through the EODHD API, which are intended solely for general information purposes.
This information does not consider your personal objectives, financial situation, or needs. Kalkine is not liable for any errors or omissions in the information provided or for any actions taken in reliance on it. You should seek advice from a financial adviser, stockbroker or other professional adviser (including taxation and legal advice) as necessary before acting on this information.

Download a free report with stock ideas and industry insights for general information.
Download Free Report Now →


Basic Materials
 +1.59%
Communication Services
+0.05%

Consumer Cyclical
+0.14%

Consumer Defensive
 -0.43%

Energy
-0.03%

Financial Services
+0.19%
Financials
-0.35%

Healthcare
+1.05%

Industrials
+0.67%

Real Estate
-0.25%

Technology
+1.31%

Utilities
+0.32%
Note: Daily price change (%) by sector excluding stocks with +/-90% daily price change. Companies above $500 million market capitalization are considered.
 Portfolio
 Watchlist


 Please wait processing your request...