 CA
 NZ
 UK
 AU
 IND

 US


…
Park-Ohio Holdings Corp. provides supply chain management outsourcing services, capital equipment, and manufactured components in the United States, Europe, Asia, Mexico, Canada, and internationally. The company operates through three segments: Supply Technologies, Assembly Components, and Engineered Products. The Supply Technologies segment offers Total Supply Management, a solution that manages aspects of supplying production parts and materials, such as engineering and design support, part usage and cost analysis, supplier selection, quality assurance, bar coding, product packaging and tracking, just-in-time and point-of-use delivery, electronic billing services, and ongoing technical support. This segment also provides production components, including valves, fuel hose assemblies, electro-mechanical hardware, labels, fittings, and steering components; and precision cold-formed and cold-extruded fasteners, and locknuts, as well as nuts, bolts, and wheel hardware under the SPAC brand. The Assembly Components segment offers high pressure direct fuel injection fuel rails and pipes; fuel filler pipes; plastic and rubber assemblies; Turbo Charging and Turbo Coolant hoses; and design engineering, machining, and parts assembly value-added services. The Engineered Products segment provides field services, induction heating and melting systems, pipe threading systems, and forged and machined products for the ferrous and non-ferrous metals, silicon, coatings, forging, foundry, automotive, and construction equipment industries. This segment also engineers and installs mechanical forging presses; sells spare parts, machine, induction harden, and surface finish crankshafts and camshafts for use in locomotives; and forge aerospace and defense structural components comprising landing gears and struts, and railcar center plate and draft lug rail products. Park-Ohio Holdings Corp. was founded in 1907 and is headquartered in Cleveland, Ohio.
Source: TradingView
The charts and visual representations are sourced from TradingView through embedded widgets. For any issues with chart display, please visit the TradingView website
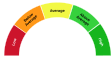
A unique technical analysis driven score developed by Kalkine showing momentum in stock prices based on select technical indicators identified.


| Breakdown | 2025-12-31 | 2024-12-31 | 2023-12-31 | 2022-12-31 | 2021-12-31 |
|---|---|---|---|---|---|
| Type | yearly | yearly | yearly | yearly | yearly |
| Date | 2025-12-31 | 2024-12-31 | 2023-12-31 | 2022-12-31 | 2021-12-31 |
| Income before tax | 23.80M | 44.40M | 41.50M | 10.70M | -32.50M |
| Minority interest | 3.80M | 2.70M | 0.50M | 1.30M | 1.20M |
| Net income | 24.80M | 31.80M | 7.80M | 11.40M | -26.00M |
| Selling general administrative | 189.60M | 187.40M | 181.50M | 162.20M | 178.30M |
| Selling and marketing expenses | - | - | 2.50M | - | - |
| Gross profit | 271.20M | 281.40M | 271.40M | 210.50M | 156.10M |
| Reconciled depreciation | 33.00M | 33.60M | 30.90M | 30.20M | 38.70M |
| Ebit | 71.30M | 91.80M | 86.60M | 59.40M | -12.50M |
| Ebitda | 104.30M | 125.40M | 118.30M | 89.60M | 26.20M |
| Depreciation and amortization | 33.00M | 33.60M | 31.70M | 30.20M | 38.70M |
| Operating income | 81.60M | 86.60M | 84.10M | 59.40M | -12.50M |
| Other operating expenses | 1517.50M | 1569.60M | 1575.60M | 1444.60M | 1460.20M |
| Interest expense | 47.50M | 47.40M | 45.10M | 33.80M | 30.10M |
| Tax provision | 2.80M | 4.90M | 10.70M | -0.70M | -6.50M |
| Net interest income | -47.50M | -47.40M | -43.50M | -33.80M | -30.10M |
| Non recurring | - | - | - | - | 4.60M |
| Income tax expense | 2.80M | 4.90M | 8.50M | -0.70M | -6.50M |
| Total revenue | 1599.10M | 1656.20M | 1659.70M | 1492.90M | 1438.00M |
| Total operating expenses | 189.60M | 194.80M | 187.30M | 162.20M | 178.30M |
| Cost of revenue | 1327.90M | 1374.80M | 1388.30M | 1282.40M | 1281.90M |
| Total other income expense net | -57.80M | -42.20M | -42.60M | -48.70M | -20.00M |
| Discontinued operations | - | - | - | -24.30M | -25.90M |
| Net income from continuing ops | 21.00M | 39.50M | 19.50M | 11.40M | -26.00M |
| Net income applicable to common shares | - | - | - | -14.20M | -24.80M |
| Breakdown | 2025-12-31 | 2024-12-31 | 2023-12-31 | 2022-12-31 | 2021-12-31 |
|---|---|---|---|---|---|
| Type | yearly | yearly | yearly | yearly | yearly |
| Date | 2025-12-31 | 2024-12-31 | 2023-12-31 | 2022-12-31 | 2021-12-31 |
| Total assets | 1419.60M | 1365.10M | 1340.70M | 1436.60M | 1360.00M |
| Intangible assets | 69.20M | 71.90M | 73.30M | 78.70M | 81.70M |
| Other current assets | 121.80M | 110.50M | 35.30M | 89.20M | 28.20M |
| Total liab | 1036.80M | 1028.00M | 1050.80M | 1168.70M | 1035.20M |
| Total stockholder equity | 382.80M | 330.80M | 280.40M | 256.50M | 314.10M |
| Deferred long term liab | - | - | - | 10.60M | 31.80M |
| Other current liab | 147.60M | 147.20M | 85.70M | 152.90M | 79.80M |
| Common stock | 18.60M | 18.30M | 17.00M | 16.60M | 16.30M |
| Capital stock | 18.60M | 18.30M | 17.00M | 16.60M | 16.30M |
| Retained earnings | 281.80M | 265.20M | 240.10M | 238.80M | 259.40M |
| Other liab | - | - | - | 21.30M | 44.00M |
| Good will | 115.80M | 111.70M | 110.20M | 108.90M | 106.00M |
| Other assets | - | - | - | 80.80M | 104.30M |
| Cash | 44.80M | 53.10M | 54.80M | 58.20M | 54.10M |
| Total current liabilities | 366.60M | 361.10M | 363.60M | 448.60M | 349.00M |
| Current deferred revenue | - | - | 53.90M | 52.60M | 51.70M |
| Net debt | 625.50M | 614.10M | 633.00M | 662.70M | 611.60M |
| Short term debt | 19.20M | 19.10M | 20.00M | 22.10M | 23.50M |
| Short long term debt | 8.30M | 8.40M | 9.40M | 10.90M | 10.70M |
| Short long term debt total | 670.30M | 667.20M | 687.80M | 720.90M | 665.70M |
| Other stockholder equity | 102.50M | 99.10M | 67.00M | 62.90M | 57.60M |
| Property plant equipment | - | - | - | 235.80M | 292.50M |
| Total current assets | 852.50M | 836.00M | 824.40M | 932.40M | 775.50M |
| Net tangible assets | - | - | - | 256.50M | 126.40M |
| Net receivables | 265.00M | 249.50M | 323.20M | 271.30M | 310.30M |
| Long term debt | 620.70M | 618.30M | 633.40M | 655.10M | 591.50M |
| Inventory | 420.90M | 422.90M | 411.10M | 406.50M | 382.90M |
| Accounts payable | 199.80M | 194.80M | 204.00M | 221.00M | 194.00M |
| Noncontrolling interest in consolidated entity | - | - | - | 11.40M | 10.70M |
| Accumulated other comprehensive income | -22.00M | -51.80M | -43.70M | -61.80M | -19.20M |
| Common stock total equity | - | - | - | 16.60M | 16.30M |
| Retained earnings total equity | - | - | - | 238.80M | 259.40M |
| Treasury stock | - | - | - | - | -85.30M |
| Non currrent assets other | 142.40M | 122.30M | 103.20M | 70.20M | 104.30M |
| Non current assets total | 567.10M | 529.10M | 516.30M | 504.20M | 584.50M |
| Capital lease obligations | 41.30M | 40.50M | 45.00M | 54.90M | 63.50M |
| Long term debt total | - | - | - | 655.10M | 591.50M |
| Breakdown | 2025-12-31 | 2024-12-31 | 2023-12-31 | 2022-12-31 | 2021-12-31 |
|---|---|---|---|---|---|
| Type | yearly | yearly | yearly | yearly | yearly |
| Date | 2025-12-31 | 2024-12-31 | 2023-12-31 | 2022-12-31 | 2021-12-31 |
| Investments | - | -30.90M | -22.80M | -40.70M | -16.20M |
| Change to liabilities | - | - | - | 33.10M | 43.10M |
| Total cashflows from investing activities | -40.30M | -30.90M | -15.80M | -40.70M | -16.20M |
| Net borrowings | 5.00M | -16.00M | -24.30M | 84.70M | 72.40M |
| Total cash from financing activities | -11.10M | 1.60M | -39.00M | 84.60M | 59.90M |
| Change to operating activities | - | - | - | -18.60M | -6.60M |
| Net income | 24.80M | 31.80M | 33.00M | 11.40M | -26.00M |
| Change in cash | -8.30M | -1.70M | -3.40M | 4.10M | -0.90M |
| Begin period cash flow | 53.10M | 54.80M | 58.20M | 54.10M | 55.00M |
| End period cash flow | 44.80M | 53.10M | 54.80M | 58.20M | 54.10M |
| Total cash from operating activities | 41.30M | 29.80M | 50.50M | -26.60M | -43.30M |
| Issuance of capital stock | 0.00M | 30.40M | 0.00M | - | - |
| Depreciation | 33.00M | 33.60M | 31.70M | 30.20M | 38.70M |
| Other cashflows from investing activities | - | 11.50M | 13.60M | -18.60M | 14.90M |
| Dividends paid | 7.80M | 6.70M | 7.40M | -7.00M | -7.00M |
| Change to inventory | 2.80M | -14.80M | -1.30M | -56.00M | -71.20M |
| Change to account receivables | -4.90M | 12.10M | -14.10M | -23.20M | -8.40M |
| Sale purchase of stock | - | -2.60M | -2.00M | 0.00M | -2.50M |
| Other cashflows from financing activities | -1.80M | 26.90M | -7.30M | 95.20M | -3.00M |
| Change to netincome | - | - | - | -12.00M | -14.10M |
| Capital expenditures | 40.30M | 31.40M | 28.20M | 26.90M | 31.10M |
| Change receivables | - | - | - | -23.20M | -8.40M |
| Cash flows other operating | - | - | - | 0.30M | 2.50M |
| Cash and cash equivalents changes | - | - | - | 17.30M | 0.40M |
| Change in working capital | -14.20M | -23.90M | -9.80M | -64.70M | -43.10M |
| Stock based compensation | 5.50M | 5.60M | 6.50M | 7.20M | 6.50M |
| Other non cash items | 11.60M | -17.30M | -3.70M | -2.40M | -10.10M |
| Free cash flow | 1.00M | -1.60M | 22.30M | -53.50M | -74.40M |
Sector: Industrials Industry: Specialty Industrial Machinery
|
Stock Name
|
Change
(USD) |
Price
(USD) |
Trailing
PE (x) |
Forward
PE (x) |
Price Sales
TTM (x) |
Price to Book Value (x)
|
Enterprise Value
to Revenue (x) |
Enterprise Value
to EBITDA (x) |
|---|---|---|---|---|---|---|---|---|
| PKOH Park Ohio Holdings Corp |
3.23 7.44% |
46.62 | 23.20 | 13.07 | 0.39 | 1.72 | 0.80 | 12.04 |
| GEV GE Vernova LLC |
55.23 7.13% |
829.34 | 56.16 | 67.57 | 7.02 | 23.82 | 6.79 | 115.11 |
| SMAWF Siemens AG Class N |
19.98 6.86% |
311.25 | 25.72 | 20.16 | 2.87 | 2.96 | 2.85 | 13.79 |
| SBGSF Schneider Electric SE |
11.73 4.63% |
265.00 | 32.06 | 22.47 | 4.40 | 6.27 | 4.00 | 19.13 |
| ETN Eaton Corporation PLC |
17.58 5.14% |
359.30 | 39.21 | 30.77 | 5.80 | 8.18 | 6.15 | 27.30 |
Park-Ohio Holdings Corp. provides supply chain management outsourcing services, capital equipment, and manufactured components in the United States, Europe, Asia, Mexico, Canada, and internationally. The company operates through three segments: Supply Technologies, Assembly Components, and Engineered Products. The Supply Technologies segment offers Total Supply Management, a solution that manages aspects of supplying production parts and materials, such as engineering and design support, part usage and cost analysis, supplier selection, quality assurance, bar coding, product packaging and tracking, just-in-time and point-of-use delivery, electronic billing services, and ongoing technical support. This segment also provides production components, including valves, fuel hose assemblies, electro-mechanical hardware, labels, fittings, and steering components; and precision cold-formed and cold-extruded fasteners, and locknuts, as well as nuts, bolts, and wheel hardware under the SPAC brand. The Assembly Components segment offers high pressure direct fuel injection fuel rails and pipes; fuel filler pipes; plastic and rubber assemblies; Turbo Charging and Turbo Coolant hoses; and design engineering, machining, and parts assembly value-added services. The Engineered Products segment provides field services, induction heating and melting systems, pipe threading systems, and forged and machined products for the ferrous and non-ferrous metals, silicon, coatings, forging, foundry, automotive, and construction equipment industries. This segment also engineers and installs mechanical forging presses; sells spare parts, machine, induction harden, and surface finish crankshafts and camshafts for use in locomotives; and forge aerospace and defense structural components comprising landing gears and struts, and railcar center plate and draft lug rail products. Park-Ohio Holdings Corp. was founded in 1907 and is headquartered in Cleveland, Ohio.
| Name | Title | Year Born |
|---|---|---|
| Mr. Matthew V. Crawford | Chairman, CEO & Pres | 1970 |
| Mr. Patrick W. Fogarty | VP & CFO | 1961 |
| Mr. Robert D. Vilsack | Chief Legal & Admin. Officer and Corp. Sec. | 1961 |
| Mr. Matthew V. Crawford | Chairman, CEO & President | 1970 |
| Mr. Robert D. Vilsack | Chief Legal & Administrative Officer and Corporate Secretary | 1961 |
Disclaimer - (*)This information, including any data, is sourced from Unicorn Data Services SAS, trading as EOD Historical Data (“EODHD”) on an ‘as is’ basis, using their API. We cannot guarantee the completeness or validity of the information and data provided on this page, as well as via the API. In some cases, the data may include analyst ratings or recommendations sourced through the EODHD API, which are intended solely for general information purposes.
This information does not consider your personal objectives, financial situation, or needs. Kalkine is not liable for any errors or omissions in the information provided or for any actions taken in reliance on it. You should seek advice from a financial adviser, stockbroker or other professional adviser (including taxation and legal advice) as necessary before acting on this information.

Download a free report with stock ideas and industry insights for general information.
Download Free Report Now →


Basic Materials
 +1.88%
Communication Services
+1.14%

Consumer Cyclical
+1.04%

Consumer Defensive
+0.57%

Energy
+0.50%

Financial Services
+0.81%
Financials
+0.24%

Healthcare
+1.35%

Industrials
+1.54%

Real Estate
+0.24%

Technology
+2.32%

Utilities
+0.48%
Note: Daily price change (%) by sector excluding stocks with +/-90% daily price change. Companies above $500 million market capitalization are considered.
 Portfolio
 Watchlist


 -4.40%
 Please wait processing your request...