 CA
 NZ
 UK
 AU
 IND

 US


…
ModivCare Inc., a technology-enabled healthcare services company, provides a suite of integrated supportive care solutions for public and private payors and their members. The company operates through four segments: Non-Emergency Medical Transportation (NEMT), Personal Care, Remote Patient Monitoring (RPM), and Corporate and Other. The company offers risk underwriting, contact center management, network credentialing, claims management, and non-emergency medical transport management services for Medicaid or Medicare eligible members, whose limited mobility or financial resources hinder their ability to access necessary healthcare and social services. It also provides in-home personal care services, such as bathing, personal hygiene, grooming, oral care, dressing, medication reminders, meal planning, preparation and feeding, housekeeping, transportation services, prescription reminders, and assistance with dressing and ambulation services through placing non-medical personal care assistants, home health aides, and skilled nurses primarily to Medicaid patients in need of care monitoring and assistance in performing daily living activities, including senior citizens and disabled adults. In addition, the company offers remote patient monitoring solutions, including personal emergency response systems, vitals monitoring, medication management, and data-driven patient engagement solutions. It serves federal, state, and local government agencies, MCOs, commercial insurers, private individuals, and health systems. The company was formerly known as The Providence Service Corporation and changed its name to ModivCare Inc. in January 2021. ModivCare Inc. was incorporated in 1996 and is headquartered in Denver, Colorado.
Source: TradingView
The charts and visual representations are sourced from TradingView through embedded widgets. For any issues with chart display, please visit the TradingView website
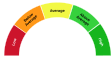
A unique technical analysis driven score developed by Kalkine showing momentum in stock prices based on select technical indicators identified.


| Breakdown | 2022-12-31 | 2021-12-31 | 2020-12-31 | 2019-12-31 | 2018-12-31 |
|---|---|---|---|---|---|
| Type | yearly | yearly | yearly | yearly | yearly |
| Date | 2022-12-31 | 2021-12-31 | 2020-12-31 | 2019-12-31 | 2018-12-31 |
| Income before tax | -4.88M | 40.69M | 114.42M | -5.53M | 22.91M |
| Minority interest | - | - | 0.00M | 0.00M | -0.16M |
| Net income | -1.84M | 31.96M | 88.84M | -4.95M | -18.98M |
| Selling general administrative | 322.17M | 271.27M | 140.54M | 67.24M | 46.10M |
| Gross profit | 472.32M | 412.59M | 289.88M | 108.79M | 100.36M |
| Reconciled depreciation | 100.42M | 57.00M | 26.18M | 16.82M | 27.68M |
| Ebit | 57.08M | 89.77M | 123.16M | -4.68M | 32.29M |
| Ebitda | 157.50M | 146.77M | 158.20M | 12.14M | 59.97M |
| Depreciation and amortization | 100.42M | 57.00M | 35.04M | 16.82M | 27.68M |
| Non operating income net other | - | - | - | - | 6.58M |
| Operating income | 57.08M | 89.77M | 123.16M | -4.68M | 24.28M |
| Other operating expenses | 2447.31M | 1907.12M | 1245.52M | 1485.21M | 1346.51M |
| Interest expense | 61.96M | 49.08M | 17.60M | 0.85M | 1.78M |
| Tax provision | -3.04M | 8.73M | 24.80M | -0.57M | 4.68M |
| Interest income | - | - | - | 30.54M | 1.36M |
| Net interest income | -61.96M | -49.08M | -17.60M | -0.85M | -1.78M |
| Extraordinary items | - | - | - | 5.92M | -36.92M |
| Income tax expense | -3.04M | 8.73M | 24.80M | -0.57M | 4.68M |
| Total revenue | 2504.39M | 1996.89M | 1368.67M | 1509.94M | 1384.96M |
| Total operating expenses | 415.24M | 322.82M | 166.72M | 84.06M | 61.91M |
| Cost of revenue | 2032.07M | 1584.30M | 1078.80M | 1401.15M | 1284.60M |
| Total other income expense net | -61.96M | -49.08M | -8.74M | -0.85M | -13.76M |
| Discontinued operations | - | -0.30M | -0.78M | 5.92M | -37.05M |
| Net income from continuing ops | -31.81M | -6.29M | 89.61M | -4.95M | 18.23M |
| Net income applicable to common shares | -31.81M | -6.58M | 32.47M | -3.44M | -25.26M |
| Breakdown | 2023-12-31 | 2022-12-31 | 2021-12-31 | 2020-12-31 | 2019-12-31 |
|---|---|---|---|---|---|
| Type | yearly | yearly | yearly | yearly | yearly |
| Date | 2023-12-31 | 2022-12-31 | 2021-12-31 | 2020-12-31 | 2019-12-31 |
| Total assets | 1767.28M | 1944.27M | 2027.42M | 1425.91M | 597.38M |
| Intangible assets | 360.94M | 439.41M | 490.21M | 345.65M | 19.91M |
| Other current assets | 21.52M | 37.36M | 43.57M | 44.63M | 14.49M |
| Total liab | 1611.08M | 1589.72M | 1654.16M | 1014.30M | 202.67M |
| Total stockholder equity | 156.19M | 354.56M | 373.27M | 411.61M | 394.71M |
| Deferred long term liab | - | - | - | - | 22.91M |
| Other current liab | 340.00M | 424.80M | 504.44M | 203.34M | 117.41M |
| Common stock | 0.02M | 0.02M | 0.02M | 0.02M | 0.02M |
| Capital stock | 0.02M | 0.02M | 0.02M | 0.02M | 77.14M |
| Retained earnings | -24.44M | 180.02M | 211.83M | 218.41M | 183.73M |
| Other liab | - | 86.67M | 117.17M | 180.13M | 37.94M |
| Good will | 785.55M | 968.65M | 924.79M | 444.93M | 135.22M |
| Other assets | - | 40.21M | 22.22M | 181.17M | 11.62M |
| Cash | 2.78M | 14.45M | 133.14M | 183.28M | 61.37M |
| Total current liabilities | 520.40M | 491.60M | 527.23M | 324.75M | 150.19M |
| Current deferred revenue | 2.63M | 2.20M | 4.23M | 104.63M | 15.93M |
| Net debt | 1137.29M | 1006.64M | 886.48M | 334.46M | -39.78M |
| Short term debt | 122.53M | 9.64M | 9.87M | 8.32M | 7.04M |
| Short long term debt | 113.80M | - | - | 0.04M | 0.31M |
| Short long term debt total | 1140.07M | 1021.09M | 1019.62M | 517.74M | 21.59M |
| Other stockholder equity | 180.61M | 174.51M | 161.42M | 193.20M | 133.86M |
| Property plant equipment | - | 108.54M | 97.30M | 27.54M | 23.24M |
| Total current assets | 399.41M | 346.15M | 409.83M | 426.62M | 256.43M |
| Long term investments | 41.53M | 41.30M | 83.07M | 137.47M | 130.87M |
| Net tangible assets | - | 307.13M | -1041.73M | 411.61M | 239.59M |
| Short term investments | - | - | - | 137.47M | - |
| Net receivables | 375.11M | 294.34M | 233.12M | 197.94M | 180.42M |
| Long term debt | 983.76M | 979.36M | 975.23M | 485.98M | 0.04M |
| Inventory | - | 2.04M | 1.46M | 0.76M | 0.15M |
| Accounts payable | 55.24M | 54.96M | 8.69M | 8.46M | 9.80M |
| Accumulated other comprehensive income | 0.00M | - | - | -1425.93M | -0.02M |
| Common stock total equity | - | 0.02M | 0.02M | 0.02M | 0.02M |
| Retained earnings total equity | - | 180.02M | 211.83M | 218.41M | 183.73M |
| Treasury stock | - | - | -269.03M | -228.14M | -217.69M |
| Non currrent assets other | 54.44M | 40.21M | 22.22M | 12.78M | 11.62M |
| Non current assets total | 1367.87M | 1598.12M | 1617.59M | 999.30M | 340.95M |
| Capital lease obligations | 42.51M | 41.73M | 44.40M | 517.69M | 21.23M |
| Long term debt total | - | - | 975.23M | 485.98M | 0.04M |
| Breakdown | 2022-12-31 | 2021-12-31 | 2020-12-31 | 2019-12-31 | 2018-12-31 |
|---|---|---|---|---|---|
| Type | yearly | yearly | yearly | yearly | yearly |
| Date | 2022-12-31 | 2021-12-31 | 2020-12-31 | 2019-12-31 | 2018-12-31 |
| Investments | -111.81M | -685.62M | -635.01M | -10.86M | 3.13M |
| Change to liabilities | 47.71M | -6.54M | 186.97M | 3.39M | -21.61M |
| Total cashflows from investing activities | -111.81M | -685.62M | -635.01M | -10.86M | -45.32M |
| Net borrowings | -2.42M | 500.00M | 500.00M | -0.72M | -0.72M |
| Total cash from financing activities | 3.81M | 448.85M | 408.26M | -0.78M | -51.55M |
| Change to operating activities | -108.41M | 83.36M | 219.80M | 8.16M | 14.45M |
| Net income | -31.81M | -6.58M | 88.84M | 0.97M | -18.82M |
| Change in cash | -118.45M | -49.93M | 121.68M | 49.31M | -89.24M |
| Begin period cash flow | 133.42M | 183.36M | 61.67M | 12.37M | 101.61M |
| End period cash flow | 14.97M | 133.42M | 183.36M | 61.67M | 12.37M |
| Total cash from operating activities | -10.44M | 186.84M | 348.44M | 60.94M | 7.90M |
| Issuance of capital stock | - | - | - | - | 12.41M |
| Depreciation | 100.42M | 57.00M | 26.18M | 16.82M | 27.68M |
| Other cashflows from investing activities | -78.81M | -664.31M | -622.86M | - | -30.93M |
| Dividends paid | 0.00M | -3.23M | -1.99M | -4.40M | 4.41M |
| Change to inventory | - | 11.45M | -55.88M | 38.18M | 17.19M |
| Change to account receivables | -55.78M | -11.45M | 55.88M | -29.93M | -31.00M |
| Sale purchase of stock | -0.79M | -40.89M | -98.96M | -6.80M | -56.09M |
| Other cashflows from financing activities | 111.81M | 614.74M | -16.21M | -0.72M | 38.53M |
| Change to netincome | 11.12M | 53.07M | 3.46M | 39.25M | 90.72M |
| Capital expenditures | 33.00M | 21.32M | 12.15M | 10.86M | 17.52M |
| Change receivables | -55.78M | -11.45M | 55.88M | -29.93M | -31.00M |
| Cash flows other operating | -6.87M | 156.93M | 2.87M | 30.16M | -39.58M |
| Cash and cash equivalents changes | -118.45M | -49.93M | 121.68M | 49.31M | -88.98M |
| Change in working capital | -106.94M | 83.36M | 219.80M | 3.62M | -40.33M |
| Stock based compensation | 6.87M | 5.90M | 3.93M | 5.41M | 8.99M |
| Other non cash items | 57.68M | 64.86M | -2.23M | 34.06M | 82.79M |
| Free cash flow | -43.45M | 165.52M | 336.29M | 50.08M | -9.62M |
Sector: Healthcare Industry: Medical Care Facilities
|
Stock Name
|
Change
(USD) |
Price
(USD) |
Trailing
PE (x) |
Forward
PE (x) |
Price Sales
TTM (x) |
Price to Book Value (x)
|
Enterprise Value
to Revenue (x) |
Enterprise Value
to EBITDA (x) |
|---|---|---|---|---|---|---|---|---|
| HCA HCA Healthcare, Inc. |
1.17 0.23% |
507.21 | 14.27 | 13.46 | 1.21 | 291.34 | 1.83 | 8.99 |
| THC Tenet Healthcare Corporation |
-1.82 0.62% |
291.15 | 10.08 | 12.66 | 0.96 | 4.57 | 1.43 | 5.80 |
| FSNUY Fresenius SE & Co KGaA ADR |
0.12 0.84% |
14.84 | 16.87 | 9.44 | 0.42 | 0.78 | 0.79 | 5.37 |
| JDHIY JD Health International Inc |
- -% |
5.57 | 62.50 | 35.97 | 0.30 | 2.32 | 0.16 | 3.90 |
ModivCare Inc., a technology-enabled healthcare services company, provides a suite of integrated supportive care solutions for public and private payors and their members. The company operates through four segments: Non-Emergency Medical Transportation (NEMT), Personal Care, Remote Patient Monitoring (RPM), and Corporate and Other. The company offers risk underwriting, contact center management, network credentialing, claims management, and non-emergency medical transport management services for Medicaid or Medicare eligible members, whose limited mobility or financial resources hinder their ability to access necessary healthcare and social services. It also provides in-home personal care services, such as bathing, personal hygiene, grooming, oral care, dressing, medication reminders, meal planning, preparation and feeding, housekeeping, transportation services, prescription reminders, and assistance with dressing and ambulation services through placing non-medical personal care assistants, home health aides, and skilled nurses primarily to Medicaid patients in need of care monitoring and assistance in performing daily living activities, including senior citizens and disabled adults. In addition, the company offers remote patient monitoring solutions, including personal emergency response systems, vitals monitoring, medication management, and data-driven patient engagement solutions. It serves federal, state, and local government agencies, MCOs, commercial insurers, private individuals, and health systems. The company was formerly known as The Providence Service Corporation and changed its name to ModivCare Inc. in January 2021. ModivCare Inc. was incorporated in 1996 and is headquartered in Denver, Colorado.

6900 East Layton Avenue, Denver, CO, United States, 80237

303 728 7012

21200
| Name | Title | Year Born |
|---|---|---|
| Mr. L. Heath Sampson | CEO, Pres, CFO, Interim Pres of Modivcare Home & Director | 1971 |
| Mr. Walt A. Meffert Jr. | Chief Information Officer | 1964 |
| Mr. Grover N. Wray | Chief HR Officer | 1961 |
| Ms. Rebecca Orcutt | VP & Chief Accounting Officer | NA |
| Mr. Kevin Kim Ellich | Head of Investor Relations | NA |
| Ms. Jody Kepler J.D., L.L.M. | Chief Compliance Officer | 1970 |
| Mr. Jonathan B. Bush | Sr. VP, Gen. Counsel & Sec. | 1969 |
| Kate Zerone | Director of Ombudsman & Communications | NA |
| Mr. Zachary B. Miller C.F.A., CFA | Associate of Corp. Devel. & Investor Relations | NA |
| Mr. Kenneth Shepard | Chief Financial Officer of NEMT Bus. | 1981 |
Disclaimer - (*)This information, including any data, is sourced from Unicorn Data Services SAS, trading as EOD Historical Data (“EODHD”) on an ‘as is’ basis, using their API. We cannot guarantee the completeness or validity of the information and data provided on this page, as well as via the API. In some cases, the data may include analyst ratings or recommendations sourced through the EODHD API, which are intended solely for general information purposes.
This information does not consider your personal objectives, financial situation, or needs. Kalkine is not liable for any errors or omissions in the information provided or for any actions taken in reliance on it. You should seek advice from a financial adviser, stockbroker or other professional adviser (including taxation and legal advice) as necessary before acting on this information.

Download a free report with stock ideas and industry insights for general information.
Download Free Report Now →


Basic Materials
 -1.40%
Communication Services
-0.45%

Consumer Cyclical
-0.55%

Consumer Defensive
-0.01%

Energy
-0.01%

Financial Services
-0.40%
Financials
-0.15%

Healthcare
-1.15%

Industrials
-0.46%

Real Estate
-0.29%

Technology
-1.22%

Utilities
-0.10%
Note: Daily price change (%) by sector excluding stocks with +/-90% daily price change. Companies above $500 million market capitalization are considered.
 Portfolio
 Watchlist


 +0.55%
 Please wait processing your request...