 CA
 NZ
 UK
 AU
 IND

 US


…
Lifeward Ltd., a medical device company, designs, develops, and commercializes technologies that enable mobility and wellness in rehabilitation and daily life for individuals with physical and neurological conditions in the United States, Europe, Germany, the Asia-Pacific, and internationally. It offers ReWalk personal exoskeleton and rehabilitation exoskeleton devices for individuals with spinal cord injury; ReStore Exo-Suit, a soft exo-suit intended for use in the rehabilitation of individuals with lower limb disability due to stroke; AlterG Anti-Gravity System for use in physical and neurological rehabilitation and athletic training; MyoCycle devices; and ReBoot, a personal soft exo-suit for home and community use by individuals' post-stroke. The company markets and sells its products directly to institutions and individuals, as well as through third-party distributors. The company was formerly known as ReWalk Robotics Ltd. and changed its name to Lifeward Ltd. in September 2024. Lifeward Ltd. was incorporated in 2001 and is based in Yokneam Illit, Israel.
Source: TradingView
The charts and visual representations are sourced from TradingView through embedded widgets. For any issues with chart display, please visit the TradingView website
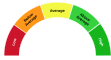
A unique technical analysis driven score developed by Kalkine showing momentum in stock prices based on select technical indicators identified.


| Breakdown | 2025-12-31 | 2024-12-31 | 2023-12-31 | 2023-09-30 | 2022-12-31 |
|---|---|---|---|---|---|
| Type | yearly | yearly | yearly | yearly | yearly |
| Date | 2025-12-31 | 2024-12-31 | 2023-12-31 | 2023-09-30 | 2022-12-31 |
| Income before tax | -19.97M | -28.90M | -22.14M | -22.14M | -19.10M |
| Net income | -19.91M | -28.94M | -22.13M | -22.13M | -19.57M |
| Selling general administrative | 8.20M | 5.20M | 9.99M | 9.99M | 7.13M |
| Selling and marketing expenses | 13.88M | 17.95M | 13.92M | 13.92M | 9.84M |
| Gross profit | 8.43M | 8.22M | 4.45M | 4.45M | 1.91M |
| Reconciled depreciation | 0.33M | 3.84M | 1.85M | 1.85M | 0.20M |
| Ebit | -19.67M | -28.77M | -22.12M | -23.75M | -19.10M |
| Ebitda | -19.34M | -24.93M | -20.28M | -21.90M | -18.90M |
| Depreciation and amortization | 0.33M | 3.84M | 1.85M | 1.85M | 0.20M |
| Operating income | -16.89M | -19.55M | -23.61M | -23.61M | -19.10M |
| Other operating expenses | 38.92M | 45.22M | 37.47M | 37.47M | 24.61M |
| Interest expense | 0.29M | 0.13M | 0.02M | - | 0.02M |
| Tax provision | -0.06M | 0.04M | -0.01M | -0.01M | 0.47M |
| Interest income | - | 0.64M | 1.35M | 1.35M | 0.00M |
| Net interest income | -0.44M | 0.52M | 1.33M | 1.33M | -0.02M |
| Income tax expense | -0.06M | 0.04M | -0.01M | -0.01M | 0.47M |
| Total revenue | 22.03M | 25.66M | 13.85M | 13.85M | 5.51M |
| Total operating expenses | 25.32M | 27.77M | 28.07M | 28.07M | 21.01M |
| Cost of revenue | 13.61M | 17.45M | 9.40M | 9.40M | 3.61M |
| Total other income expense net | -3.08M | -9.35M | 1.47M | 0.13M | 0.02M |
| Net income from continuing ops | -19.91M | -28.94M | -22.13M | -22.13M | -19.57M |
| Breakdown | 2025-12-31 | 2024-12-31 | 2023-12-31 | 2023-09-30 | 2022-12-31 |
|---|---|---|---|---|---|
| Type | yearly | yearly | yearly | yearly | yearly |
| Date | 2025-12-31 | 2024-12-31 | 2023-12-31 | 2023-09-30 | 2022-12-31 |
| Total assets | 22.90M | 30.49M | 63.19M | 63.19M | 74.24M |
| Intangible assets | - | - | 12.53M | 12.53M | - |
| Other current assets | 1.77M | 1.62M | 2.37M | 1.00M | 0.65M |
| Total liab | 14.49M | 11.64M | 16.68M | 16.68M | 6.07M |
| Total stockholder equity | 8.41M | 18.85M | 46.51M | 46.51M | 68.17M |
| Other current liab | 2.30M | 3.10M | 3.93M | 3.93M | 1.97M |
| Common stock | 9.42M | 4.59M | 4.49M | 4.49M | 4.49M |
| Capital stock | 9.42M | 4.59M | 4.49M | 4.49M | 4.49M |
| Retained earnings | -284.74M | -264.82M | -235.88M | -235.88M | -213.75M |
| Good will | 4.75M | 7.54M | 7.54M | 7.54M | 0.00M |
| Other assets | - | 0.00M | - | - | - |
| Cash | 2.17M | 6.94M | 28.08M | 28.08M | 67.90M |
| Total current liabilities | 12.04M | 10.22M | 11.79M | 11.79M | 4.78M |
| Current deferred revenue | 0.92M | 1.25M | 1.50M | 1.50M | 0.30M |
| Net debt | 2.22M | -6.06M | -26.18M | -26.18M | -67.00M |
| Short term debt | 3.23M | 0.86M | 1.30M | 1.30M | 0.56M |
| Short long term debt | 2.80M | - | - | - | - |
| Short long term debt total | 4.39M | 0.88M | 1.90M | 1.90M | 0.90M |
| Other stockholder equity | 283.73M | 279.08M | 277.91M | 277.91M | 277.43M |
| Total current assets | 15.81M | 21.29M | 39.22M | 39.22M | 72.51M |
| Net receivables | 6.14M | 6.00M | 3.12M | 3.12M | 1.04M |
| Inventory | 5.73M | 6.72M | 5.65M | 5.65M | 2.93M |
| Accounts payable | 5.59M | 5.02M | 5.07M | 5.07M | 1.95M |
| Non currrent assets other | -0.20M | -0.12M | 0.07M | 0.78M | 0.04M |
| Non current assets total | 7.09M | 9.19M | 23.97M | 23.97M | 1.73M |
| Capital lease obligations | 1.58M | 0.88M | 1.90M | 1.90M | 0.90M |
| Breakdown | 2025-12-31 | 2024-12-31 | 2023-12-31 | 2023-09-30 | 2022-12-31 |
|---|---|---|---|---|---|
| Type | yearly | yearly | yearly | yearly | yearly |
| Date | 2025-12-31 | 2024-12-31 | 2023-12-31 | 2023-09-30 | 2022-12-31 |
| Investments | - | 0.00M | -18.15M | -18.15M | -0.03M |
| Total cashflows from investing activities | -0.02M | - | -18.15M | - | -0.03M |
| Net borrowings | 1.44M | 0.00M | 0.00M | - | 0.00M |
| Total cash from financing activities | 12.20M | 0.00M | -0.99M | -0.99M | -2.50M |
| Net income | -16.23M | -28.94M | -22.13M | -22.13M | -19.57M |
| Change in cash | -4.53M | -21.68M | -39.76M | -39.76M | -20.50M |
| Begin period cash flow | 7.11M | 28.79M | 68.56M | 68.56M | 89.05M |
| End period cash flow | 2.58M | 7.11M | 28.79M | 28.79M | 68.56M |
| Total cash from operating activities | -16.83M | -21.72M | -20.67M | -20.67M | -17.89M |
| Issuance of capital stock | 9.20M | 0.00M | 0.00M | 0.00M | 0.00M |
| Depreciation | 0.33M | 3.84M | 1.85M | 1.85M | 0.20M |
| Change to inventory | 0.90M | -0.92M | -0.28M | -0.28M | -0.12M |
| Change to account receivables | -0.13M | -2.88M | -0.31M | -0.31M | -0.41M |
| Sale purchase of stock | 0.00M | 0.00M | -0.99M | -0.99M | -2.50M |
| Other cashflows from financing activities | 1.56M | - | -18.15M | -18.15M | -0.03M |
| Capital expenditures | 0.02M | 0.00M | 0.08M | 0.08M | 0.03M |
| Change in working capital | -0.30M | -4.97M | -1.34M | -1.34M | 0.09M |
| Stock based compensation | 0.74M | 1.28M | 1.33M | 1.33M | 0.99M |
| Other non cash items | -1.37M | 7.08M | -0.33M | -0.33M | 0.08M |
| Free cash flow | -16.83M | -21.72M | -20.75M | -20.75M | -17.92M |
Sector: Healthcare Industry: Medical Devices
|
Stock Name
|
Change
(USD) |
Price
(USD) |
Trailing
PE (x) |
Forward
PE (x) |
Price Sales
TTM (x) |
Price to Book Value (x)
|
Enterprise Value
to Revenue (x) |
Enterprise Value
to EBITDA (x) |
|---|---|---|---|---|---|---|---|---|
| LFWD ReWalk Robotics Ltd |
-0.29 4.80% |
5.75 | - | - | 0.92 | 1.65 | 0.81 | 1.04 |
| ABT Abbott Laboratories |
-0.46 0.45% |
102.64 | 25.97 | 17.24 | 3.57 | 3.20 | 3.81 | 16.75 |
| MDT Medtronic PLC |
0.83 0.88% |
94.78 | 26.60 | 15.87 | 3.35 | 2.08 | 3.90 | 14.12 |
| SYK Stryker Corporation |
2.58 0.86% |
304.00 | 29.23 | 16.86 | 4.18 | 4.51 | 4.63 | 17.16 |
| SEMHF Siemens Healthineers AG |
- -% |
47.39 | 39.57 | 21.32 | 3.01 | 3.29 | 2.95 | 16.92 |
Lifeward Ltd., a medical device company, designs, develops, and commercializes technologies that enable mobility and wellness in rehabilitation and daily life for individuals with physical and neurological conditions in the United States, Europe, Germany, the Asia-Pacific, and internationally. It offers ReWalk personal exoskeleton and rehabilitation exoskeleton devices for individuals with spinal cord injury; ReStore Exo-Suit, a soft exo-suit intended for use in the rehabilitation of individuals with lower limb disability due to stroke; AlterG Anti-Gravity System for use in physical and neurological rehabilitation and athletic training; MyoCycle devices; and ReBoot, a personal soft exo-suit for home and community use by individuals' post-stroke. The company markets and sells its products directly to institutions and individuals, as well as through third-party distributors. The company was formerly known as ReWalk Robotics Ltd. and changed its name to Lifeward Ltd. in September 2024. Lifeward Ltd. was incorporated in 2001 and is based in Yokneam Illit, Israel.
| Name | Title | Year Born |
|---|---|---|
| Mr. Lawrence J. Jasinski BS, MBA | CEO & Director | 1957 |
| Mr. Michael A. Lawless | Chief Financial Officer | 1968 |
| Ms. Miri Pariente | Vice President of Operations, Regulatory & Quality | 1977 |
| Ms. Jeannine Lynch | Vice President of Market Access & Strategy | 1965 |
| Ms. Kathleen O'Donnell | Vice President of Marketing & New Business Development | NA |
| Mr. Charles Remsberg | Chief Sales Officer | NA |
| Ms. Judy Kula | Vice President of Customer Service, Human Resources & Business Affairs | NA |
| Mr. Almog Adar | Chief Financial Officer | 1984 |
| Mr. William Mark Grant | Senior Advisor | 1970 |
| Mr. Joshua Hexter | Interim Chief Executive Officer | 1970 |
Disclaimer - (*)This information, including any data, is sourced from Unicorn Data Services SAS, trading as EOD Historical Data (“EODHD”) on an ‘as is’ basis, using their API. We cannot guarantee the completeness or validity of the information and data provided on this page, as well as via the API. In some cases, the data may include analyst ratings or recommendations sourced through the EODHD API, which are intended solely for general information purposes.
This information does not consider your personal objectives, financial situation, or needs. Kalkine is not liable for any errors or omissions in the information provided or for any actions taken in reliance on it. You should seek advice from a financial adviser, stockbroker or other professional adviser (including taxation and legal advice) as necessary before acting on this information.

Download a free report with stock ideas and industry insights for general information.
Download Free Report Now →


Basic Materials
 +0.02%
Communication Services
 -0.63%

Consumer Cyclical
-0.11%

Consumer Defensive
-0.45%

Energy
+0.39%

Financial Services
-0.10%
Financials
-0.81%

Healthcare
+1.03%

Industrials
+0.32%

Real Estate
-0.31%

Technology
+0.59%

Utilities
-0.18%
Note: Daily price change (%) by sector excluding stocks with +/-90% daily price change. Companies above $500 million market capitalization are considered.
 Portfolio
 Watchlist


 Please wait processing your request...