 CA
 NZ
 UK
 AU
 IND

 US


…
EDAP TMS S.A., doing business as FocalTherics, operates as a medical technology company that develops, manufactures, markets, and sells non-invasive therapeutic ultrasound and energy-based medical devices in Asia, France, the United States, and internationally. The company develops, manufactures, markets, and distributes non-invasive robotic HIFU systems for urology-related and other indications. It also offers Focal One, a HIFU robotic system to treat patients diagnosed with prostate cancer, as well as disposables, and leasing and treatment related services; and maintenance services. In addition, the company manufactures and markets lithotripter for the treatment of urinary tract stones; and provides disposables, replacement parts, and services for lithotripters; and sells spare parts and disposables, such as electrodes. Further, it markets, distributes, and services lasers, micro-ultrasound systems, and other medical products from third parties, as well as leases devices; sells disposables and spare parts; and offers maintenance services. The company markets and sells its products through its direct marketing, sales channels, and third-party distributors and agents. The company serves academic, public, and private hospitals, as well as clinics. The company has a strategic collaboration with Telix Pharmaceuticals Limited to develop clinical workflows combining PSMA PET imaging and Focal One Robotic HIFU for prostate cancer. EDAP TMS S.A. was incorporated in 1979 and is headquartered in Vaulx-en-Velin, France.
Source: TradingView
The charts and visual representations are sourced from TradingView through embedded widgets. For any issues with chart display, please visit the TradingView website
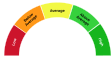
A unique technical analysis driven score developed by Kalkine showing momentum in stock prices based on select technical indicators identified.
EDAP TMS S.A. develops and sells high‑intensity focused ultrasound (HIFU) systems and related consumables for urology, primarily targeting prostate cancer and benign prostatic conditions. Long-term growth may be supported by rising interest in minimally invasive focal therapies, geographic expansion and recurring revenue from disposables and service contracts. It appears positioned in a narrow technology niche that could support higher-margin revenue if clinical adoption and reimbursement improve.
Key investment risks include limited commercial scale and cash runway, dependence on regulatory approvals and reimbursement outcomes, competition from established surgical and radiotherapy treatments, and execution risk in expanding international sales.

Note: The summary and risk score provided above is created by AI and should not be construed as a recommendation of Kalkine.


| Breakdown | 2025-12-31 | 2024-12-31 | 2023-12-31 | 2022-12-31 | 2021-12-31 |
|---|---|---|---|---|---|
| Type | yearly | yearly | yearly | yearly | yearly |
| Date | 2025-12-31 | 2024-12-31 | 2023-12-31 | 2022-12-31 | 2021-12-31 |
| Income before tax | -29.27M | -20.75M | -22.64M | -2.81M | 0.33M |
| Net income | -29.34M | -20.57M | -22.90M | -3.08M | 0.83M |
| Selling general administrative | 45.03M | 42.61M | 41.19M | 25.23M | - |
| Gross profit | 30.09M | 28.73M | 26.39M | 25.43M | 21.77M |
| Reconciled depreciation | 3.41M | 2.78M | 2.11M | 1.72M | - |
| Ebit | -28.47M | -20.50M | -22.39M | -2.64M | 0.39M |
| Ebitda | -25.05M | -17.70M | -20.31M | -0.92M | 2.66M |
| Depreciation and amortization | 3.43M | 2.80M | 2.08M | 1.72M | 2.27M |
| Operating income | -25.21M | -22.95M | -22.10M | -5.35M | -3.51M |
| Other operating expenses | 95.95M | 92.31M | 87.43M | 63.27M | 55.59M |
| Interest expense | 0.79M | 0.26M | 0.25M | 0.18M | 0.06M |
| Tax provision | 0.44M | 0.31M | 0.71M | 0.90M | - |
| Interest income | 0.25M | 0.86M | 1.45M | 0.43M | - |
| Net interest income | -0.54M | 0.60M | 1.19M | 0.25M | - |
| Income tax expense | 0.07M | -0.18M | 0.25M | 0.27M | -0.50M |
| Total revenue | 70.75M | 69.35M | 65.32M | 57.92M | 52.08M |
| Total operating expenses | 55.30M | 51.68M | 48.49M | 30.77M | 25.28M |
| Cost of revenue | 40.65M | 40.63M | 38.93M | 32.49M | 30.31M |
| Total other income expense net | -4.06M | 2.20M | -0.54M | 2.54M | 3.83M |
| Net income from continuing ops | -29.25M | -20.58M | -23.41M | -3.15M | - |
| Breakdown | 2025-12-31 | 2024-12-31 | 2023-12-31 | 2022-12-31 | 2021-12-31 |
|---|---|---|---|---|---|
| Type | yearly | yearly | yearly | yearly | yearly |
| Date | 2025-12-31 | 2024-12-31 | 2023-12-31 | 2022-12-31 | 2021-12-31 |
| Total assets | 79.00M | 89.12M | 101.13M | 107.92M | 87.82M |
| Intangible assets | 1.80M | 1.12M | 1.20M | 0.77M | 0.83M |
| Other current assets | 1.30M | 1.30M | 0.73M | 0.70M | 0.66M |
| Total liab | 59.58M | 46.77M | 38.25M | 31.47M | 30.90M |
| Total stockholder equity | 19.41M | 42.35M | 62.88M | 76.45M | 56.92M |
| Other current liab | 8.91M | 9.05M | 7.88M | 6.87M | 6.00M |
| Common stock | 6.07M | 5.06M | 5.36M | 5.10M | 4.99M |
| Capital stock | 6.07M | 6.06M | 5.36M | 5.12M | - |
| Retained earnings | -128.62M | -85.50M | -70.20M | -45.22M | -44.85M |
| Good will | 2.83M | 2.50M | 2.66M | 2.57M | 2.74M |
| Cash | 20.45M | 30.90M | 48.02M | 67.38M | 53.66M |
| Total current liabilities | 37.14M | 39.15M | 30.48M | 23.17M | 20.41M |
| Current deferred revenue | 7.10M | 6.88M | 4.47M | 4.32M | 3.88M |
| Net debt | 7.23M | -16.48M | -38.65M | -57.36M | -42.28M |
| Short term debt | 9.35M | 10.17M | 5.71M | 4.89M | 4.27M |
| Short long term debt | 8.11M | 8.99M | 4.44M | 3.70M | - |
| Short long term debt total | 27.68M | 14.41M | 9.37M | 10.02M | 11.38M |
| Other stockholder equity | 150.30M | 127.85M | 132.68M | 120.66M | 100.86M |
| Total current assets | 57.16M | 72.36M | 86.69M | 96.61M | 76.63M |
| Net receivables | 22.58M | 21.01M | 21.25M | 15.95M | 13.78M |
| Long term debt | 15.90M | 2.25M | 2.21M | 3.85M | - |
| Inventory | 12.83M | 19.15M | 16.69M | 12.57M | 8.53M |
| Accounts payable | 11.78M | 13.06M | 12.41M | 7.09M | 6.27M |
| Accumulated other comprehensive income | -8.34M | -5.07M | -4.96M | -4.09M | -4.08M |
| Non currrent assets other | 2.06M | 1.57M | 0.72M | 0.70M | 0.72M |
| Non current assets total | 21.83M | 16.76M | 14.44M | 11.32M | 11.19M |
| Capital lease obligations | 3.67M | 3.23M | 2.66M | 2.52M | - |
| Breakdown | 2025-12-31 | 2024-12-31 | 2023-12-31 | 2022-12-31 | 2021-12-31 |
|---|---|---|---|---|---|
| Type | yearly | yearly | yearly | yearly | yearly |
| Date | 2025-12-31 | 2024-12-31 | 2023-12-31 | 2022-12-31 | 2021-12-31 |
| Investments | 0.00M | 0.00M | 0.00M | 0.00M | - |
| Total cashflows from investing activities | -5.73M | -4.46M | -4.70M | -2.50M | -1.94M |
| Net borrowings | 8.61M | 4.89M | -1.30M | -0.97M | - |
| Total cash from financing activities | 8.64M | 5.01M | -0.98M | 22.85M | 23.95M |
| Net income | -29.34M | -20.57M | -22.90M | -3.08M | 0.83M |
| Change in cash | -10.44M | -17.13M | -19.36M | 13.73M | 23.44M |
| Begin period cash flow | 30.90M | 48.02M | 67.38M | 53.66M | 30.22M |
| End period cash flow | 20.45M | 30.90M | 48.02M | 67.38M | 53.66M |
| Total cash from operating activities | -16.46M | -14.69M | -15.87M | -3.18M | 5.26M |
| Issuance of capital stock | - | 0.00M | 0.00M | 23.55M | - |
| Depreciation | 3.43M | 2.80M | 2.08M | 1.72M | 2.27M |
| Other cashflows from investing activities | 0.04M | -2.79M | -2.85M | -1.71M | -1.38M |
| Change to inventory | 6.87M | -4.37M | -4.55M | -4.71M | 0.20M |
| Change to account receivables | -0.57M | -0.15M | -5.31M | -2.07M | -0.12M |
| Other cashflows from financing activities | - | - | 0.00M | -0.00M | 0.00M |
| Capital expenditures | 4.94M | 1.42M | 1.27M | 0.64M | 0.46M |
| Change in working capital | 2.94M | -2.12M | -3.14M | -4.54M | 0.62M |
| Stock based compensation | 2.56M | 3.55M | 7.59M | 2.26M | - |
| Other non cash items | 6.74M | 5.30M | 8.04M | 2.67M | 2.21M |
| Free cash flow | -21.40M | -16.12M | -17.14M | -3.82M | 4.79M |
Sector: Healthcare Industry: Medical Distribution
|
Stock Name
|
Change
(USD) |
Price
(USD) |
Trailing
PE (x) |
Forward
PE (x) |
Price Sales
TTM (x) |
Price to Book Value (x)
|
Enterprise Value
to Revenue (x) |
Enterprise Value
to EBITDA (x) |
|---|---|---|---|---|---|---|---|---|
| FOCL EDAP TMS S.A. |
-0.02 0.57% |
3.50 | - | 38.91 | 2.36 | 17.22 | 2.64 | 1165.78 |
| MCK McKesson Corporation |
24.46 2.31% |
1083.84 | 24.45 | 20.41 | 0.26 | 5.04 | 0.27 | 15.03 |
| COR Cencora Inc. |
2.97 0.86% |
348.73 | 24.22 | 16.39 | 0.19 | 20.41 | 0.21 | 13.72 |
| CAH Cardinal Health Inc |
2.50 0.91% |
276.79 | 29.48 | 17.92 | 0.20 | 16.07 | 0.22 | 15.67 |
| HSIC Henry Schein Inc |
- -% |
88.74 | 25.89 | 15.08 | 0.72 | 3.14 | 1.00 | 13.43 |
EDAP TMS S.A., doing business as FocalTherics, operates as a medical technology company that develops, manufactures, markets, and sells non-invasive therapeutic ultrasound and energy-based medical devices in Asia, France, the United States, and internationally. The company develops, manufactures, markets, and distributes non-invasive robotic HIFU systems for urology-related and other indications. It also offers Focal One, a HIFU robotic system to treat patients diagnosed with prostate cancer, as well as disposables, and leasing and treatment related services; and maintenance services. In addition, the company manufactures and markets lithotripter for the treatment of urinary tract stones; and provides disposables, replacement parts, and services for lithotripters; and sells spare parts and disposables, such as electrodes. Further, it markets, distributes, and services lasers, micro-ultrasound systems, and other medical products from third parties, as well as leases devices; sells disposables and spare parts; and offers maintenance services. The company markets and sells its products through its direct marketing, sales channels, and third-party distributors and agents. The company serves academic, public, and private hospitals, as well as clinics. The company has a strategic collaboration with Telix Pharmaceuticals Limited to develop clinical workflows combining PSMA PET imaging and Focal One Robotic HIFU for prostate cancer. EDAP TMS S.A. was incorporated in 1979 and is headquartered in Vaulx-en-Velin, France.

Parc dActivites la Poudrette-Lamartine, Vaulx-En-Velin, France, 69120

33 4 72 15 31 50

289
| Name | Title | Year Born |
|---|---|---|
| Mr. Ryan Rhodes | CEO & Director | 1962 |
| Mr. Kenneth Mobeck | Chief Financial Officer | 1971 |
| Mr. Steven Annen | Executive Vice President of Marketing & Product Management | 1964 |
| Mr. Carre Emmanuel | Chief Operating Officer | NA |
| Mr. Francois Dietsch | Chief Accounting Officer | 1976 |
| Ms. Blandine Confort | Head of Legal Affairs & Investor Relations and Secretary | NA |
| Mr. Frederic Pech | President of EDAP TMS France | 1969 |
| Mr. Jean-Francois Bachelard | President & Chief Executive Officer of Edaptechnomed Co. Ltd. | 1964 |
| Mr. Sanket Shah J.D. | General Counsel & Corporate Secretary | 1983 |
Disclaimer - (*)This information, including any data, is sourced from Unicorn Data Services SAS, trading as EOD Historical Data (“EODHD”) on an ‘as is’ basis, using their API. We cannot guarantee the completeness or validity of the information and data provided on this page, as well as via the API. In some cases, the data may include analyst ratings or recommendations sourced through the EODHD API, which are intended solely for general information purposes.
This information does not consider your personal objectives, financial situation, or needs. Kalkine is not liable for any errors or omissions in the information provided or for any actions taken in reliance on it. You should seek advice from a financial adviser, stockbroker or other professional adviser (including taxation and legal advice) as necessary before acting on this information.

Download a free report with stock ideas and industry insights for general information.
Download Free Report Now →


Basic Materials
 -1.26%
Communication Services
-0.18%

Consumer Cyclical
-0.36%

Consumer Defensive
 +0.07%

Energy
-0.01%

Financial Services
-0.26%
Financials
-2.20%

Healthcare
-0.55%

Industrials
-0.08%

Real Estate
-0.33%

Technology
-0.70%

Utilities
-0.41%
Note: Daily price change (%) by sector excluding stocks with +/-90% daily price change. Companies above $500 million market capitalization are considered.
 Portfolio
 Watchlist


 Please wait processing your request...