 CA
 NZ
 UK
 AU
 IND

 US


…
CytomX Therapeutics, Inc. operates as an oncology-focused biopharmaceutical company that focuses on developing potent biologics designed to treat tumor microenvironment. The company utilizes conditional activation platform technology for oncology biologics research and development comprising the validation of targets for antibody-drug conjugates (ADCs), opening therapeutic window for novel T-cell engagers (TCEs) targeting solid tumors, and increasing the therapeutic index for immune modulators, such as cytokines; and PROBODY platform in preclinical research in areas outside of oncology. It also develops CX-904, a T-cell engaging bispecific antibody targeting the epidermal growth factor receptor (EGFR) on tumor cells and the CD3 receptor on T cells; CX-2051, a conditionally activated ADC for optimizing the therapeutic index for EpCAM-expressing epithelial cancers, including colorectal cancer; and CX-801, an interferon alpha-2b PROBODY cytokine. In addition, the company's development pipeline comprises CX-2029, a conditional activated ADC targeting CD71; and BMS-986288, a PROBODY version of non-fucosylated ipilimumab. It has strategic collaborations with Amgen, Astellas, Bristol Myers Squibb, Regeneron, and Moderna; and clinical trial collaboration and supply agreement with Merck for the evaluation of CX-801 in combination with anti-PD-1 therapy, KEYTRUDA (pembrolizumab). The company was founded in 2008 and is based in South San Francisco, California.
Source: TradingView
The charts and visual representations are sourced from TradingView through embedded widgets. For any issues with chart display, please visit the TradingView website
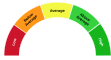
A unique technical analysis driven score developed by Kalkine showing momentum in stock prices based on select technical indicators identified.


| Breakdown | 2025-12-31 | 2024-12-31 | 2023-12-31 | 2022-12-31 | 2021-12-31 |
|---|---|---|---|---|---|
| Type | yearly | yearly | yearly | yearly | yearly |
| Date | 2025-12-31 | 2024-12-31 | 2023-12-31 | 2022-12-31 | 2021-12-31 |
| Income before tax | -17.13M | 32.09M | 3.32M | -99.32M | -83.61M |
| Net income | -17.37M | 31.87M | -0.57M | -97.30M | -80.65M |
| Selling general administrative | 29.84M | 29.73M | 30.02M | 42.85M | 39.16M |
| Selling and marketing expenses | - | - | 0.15M | - | - |
| Gross profit | 76.20M | 138.10M | 101.21M | 53.16M | 69.57M |
| Reconciled depreciation | 1.38M | 1.77M | 2.30M | 2.44M | 2.71M |
| Ebit | -19.56M | 25.00M | -6.48M | -103.78M | -86.49M |
| Ebitda | -18.19M | 26.76M | -4.31M | -101.33M | -83.78M |
| Depreciation and amortization | 1.38M | 1.77M | 2.17M | 2.44M | 2.71M |
| Non operating income net other | - | - | - | 0.17M | 0.17M |
| Operating income | -19.56M | 25.00M | -6.48M | -101.33M | -83.78M |
| Other operating expenses | 95.77M | 113.11M | 107.70M | 154.50M | 153.35M |
| Interest expense | - | - | - | -2.02M | 0.17M |
| Tax provision | 0.24M | 0.22M | 2.82M | 0.00M | 0.00M |
| Interest income | 5.21M | 7.14M | 8.07M | 1.68M | 0.26M |
| Net interest income | 5.21M | 7.14M | 8.07M | 1.68M | 0.26M |
| Income tax expense | 0.24M | 0.22M | 3.89M | -2.02M | -2.96M |
| Total revenue | 76.20M | 138.10M | 101.21M | 53.16M | 69.57M |
| Total operating expenses | 95.77M | 113.11M | 107.70M | 154.50M | 153.35M |
| Cost of revenue | - | 1.77M | 2.17M | - | - |
| Total other income expense net | 2.43M | 7.10M | 9.81M | 2.02M | 0.17M |
| Net income from continuing ops | -17.37M | 31.87M | -10.18M | -115.87M | -83.61M |
| Net income applicable to common shares | - | - | - | -115.87M | -83.61M |
| Breakdown | 2025-12-31 | 2024-12-31 | 2023-12-31 | 2022-12-31 | 2021-12-31 |
|---|---|---|---|---|---|
| Type | yearly | yearly | yearly | yearly | yearly |
| Date | 2025-12-31 | 2024-12-31 | 2023-12-31 | 2022-12-31 | 2021-12-31 |
| Total assets | 151.57M | 120.53M | 205.15M | 260.89M | 339.41M |
| Intangible assets | 0.44M | 0.58M | 0.73M | 0.88M | 1.02M |
| Other current assets | 4.86M | 3.58M | 5.00M | 7.47M | 4.29M |
| Total liab | 52.56M | 120.99M | 252.60M | 346.64M | 250.03M |
| Total stockholder equity | 99.01M | -0.46M | -47.45M | -85.75M | 89.38M |
| Other current liab | 14.20M | 12.34M | 17.60M | 24.45M | 30.62M |
| Common stock | 0.00M | 0.00M | 0.00M | 0.00M | 0.00M |
| Capital stock | 0.00M | 0.00M | 0.00M | 0.00M | 0.00M |
| Retained earnings | -711.95M | -691.58M | -723.45M | -722.88M | -533.72M |
| Other liab | - | - | - | 180.06M | 125.66M |
| Good will | 0.95M | 0.95M | 0.95M | 0.95M | 0.95M |
| Other assets | - | - | - | 0.94M | 1.82M |
| Cash | 12.67M | 38.05M | 17.17M | 193.65M | 205.53M |
| Total current liabilities | 46.62M | 85.77M | 155.91M | 152.61M | 106.32M |
| Current deferred revenue | 26.88M | 67.20M | 132.27M | 121.27M | 69.26M |
| Net debt | -8.43M | -28.67M | -3.20M | -175.59M | -187.47M |
| Short term debt | 4.24M | 5.14M | 4.59M | 4.08M | 3.62M |
| Short long term debt total | 4.24M | 9.38M | 13.97M | 18.06M | 18.06M |
| Other stockholder equity | 810.84M | 691.10M | 675.90M | 637.12M | 623.34M |
| Property plant equipment | - | - | - | 5.96M | 5.96M |
| Total current assets | 143.92M | 107.31M | 182.94M | 237.10M | 310.30M |
| Net tangible assets | - | - | - | -2.43M | 87.41M |
| Short term investments | 124.39M | 62.57M | 157.34M | 99.70M | 99.70M |
| Net receivables | 2.01M | 3.10M | 3.43M | 35.99M | 0.79M |
| Accounts payable | 1.30M | 1.09M | 1.46M | 2.81M | 2.82M |
| Accumulated other comprehensive income | 0.11M | 0.03M | 0.10M | 0.01M | -0.24M |
| Common stock total equity | - | - | - | 0.00M | 0.00M |
| Retained earnings total equity | - | - | - | -623.56M | -533.72M |
| Non currrent assets other | 1.56M | 1.09M | 0.08M | 0.94M | 1.82M |
| Non current assets total | 7.64M | 13.23M | 22.21M | 23.79M | 29.11M |
| Capital lease obligations | 4.24M | 9.38M | 13.97M | 18.06M | 21.67M |
| Breakdown | 2025-12-31 | 2024-12-31 | 2023-12-31 | 2022-12-31 | 2021-12-31 |
|---|---|---|---|---|---|
| Type | yearly | yearly | yearly | yearly | yearly |
| Date | 2025-12-31 | 2024-12-31 | 2023-12-31 | 2022-12-31 | 2021-12-31 |
| Investments | -59.52M | 99.70M | -63.72M | 24.10M | 24.10M |
| Change to liabilities | - | - | - | -0.14M | -0.14M |
| Total cashflows from investing activities | -59.74M | 99.70M | -150.67M | 22.49M | 22.49M |
| Total cash from financing activities | 110.45M | 7.52M | 30.23M | 0.65M | 110.21M |
| Change to operating activities | - | - | - | -12.09M | 11.64M |
| Net income | -20.37M | 31.87M | -0.57M | -99.32M | -83.61M |
| Change in cash | -24.89M | 20.99M | -176.48M | -11.88M | 13.67M |
| Begin period cash flow | 39.08M | 18.09M | 193.65M | 206.45M | 192.78M |
| End period cash flow | 14.19M | 39.08M | 17.17M | 194.57M | 206.45M |
| Total cash from operating activities | -75.59M | -86.23M | -56.03M | -110.79M | -119.03M |
| Issuance of capital stock | 109.64M | 6.91M | - | 0.00M | 107.71M |
| Depreciation | 0.15M | 1.77M | 2.17M | 2.44M | 2.71M |
| Dividends paid | 3.00M | - | - | - | - |
| Change to inventory | - | - | - | - | 11.64M |
| Change to account receivables | 1.09M | 0.33M | 32.55M | -35.20M | 0.01M |
| Sale purchase of stock | - | - | - | 110.21M | 110.21M |
| Other cashflows from financing activities | 3.00M | 0.61M | 30.23M | 98.26M | 2.50M |
| Change to netincome | - | - | - | 13.17M | 13.17M |
| Capital expenditures | 0.22M | 0.31M | 0.84M | 1.74M | 1.61M |
| Change receivables | - | - | - | 0.01M | 0.01M |
| Cash flows other operating | - | - | - | -19.18M | -57.70M |
| Cash and cash equivalents changes | - | - | - | 13.67M | 13.67M |
| Change in working capital | -68.58M | -126.42M | -62.51M | -30.65M | -54.70M |
| Stock based compensation | 6.30M | 7.67M | 8.56M | 13.12M | 13.17M |
| Other non cash items | 6.91M | -1.12M | -3.69M | 3.62M | 3.13M |
| Free cash flow | -75.81M | -86.54M | -56.88M | -112.53M | -120.64M |
Sector: Healthcare Industry: Biotechnology
|
Stock Name
|
Change
(USD) |
Price
(USD) |
Trailing
PE (x) |
Forward
PE (x) |
Price Sales
TTM (x) |
Price to Book Value (x)
|
Enterprise Value
to Revenue (x) |
Enterprise Value
to EBITDA (x) |
|---|---|---|---|---|---|---|---|---|
| CTMX CytomX Therapeutics Inc |
0.09 3.82% |
2.31 | - | 14.20 | 32.02 | 1.95 | 14.41 | 24.67 |
| NVO Novo Nordisk A/S |
-0.46 1.18% |
38.67 | 41.58 | 31.15 | 2.13 | 32.99 | 2.11 | 4.70 |
| VRTX Vertex Pharmaceuticals Inc |
3.54 0.68% |
521.03 | 30.22 | 24.27 | 10.36 | 6.50 | 9.99 | 24.66 |
| REGN Regeneron Pharmaceuticals Inc |
8.43 1.04% |
816.10 | 29.07 | 20.12 | 7.57 | 3.82 | 6.95 | 19.42 |
| ARGNF argenx SE |
- -% |
790.15 | 45.77 | 31.25 | 13.84 | 7.12 | 11.38 | 36.06 |
CytomX Therapeutics, Inc. operates as an oncology-focused biopharmaceutical company that focuses on developing potent biologics designed to treat tumor microenvironment. The company utilizes conditional activation platform technology for oncology biologics research and development comprising the validation of targets for antibody-drug conjugates (ADCs), opening therapeutic window for novel T-cell engagers (TCEs) targeting solid tumors, and increasing the therapeutic index for immune modulators, such as cytokines; and PROBODY platform in preclinical research in areas outside of oncology. It also develops CX-904, a T-cell engaging bispecific antibody targeting the epidermal growth factor receptor (EGFR) on tumor cells and the CD3 receptor on T cells; CX-2051, a conditionally activated ADC for optimizing the therapeutic index for EpCAM-expressing epithelial cancers, including colorectal cancer; and CX-801, an interferon alpha-2b PROBODY cytokine. In addition, the company's development pipeline comprises CX-2029, a conditional activated ADC targeting CD71; and BMS-986288, a PROBODY version of non-fucosylated ipilimumab. It has strategic collaborations with Amgen, Astellas, Bristol Myers Squibb, Regeneron, and Moderna; and clinical trial collaboration and supply agreement with Merck for the evaluation of CX-801 in combination with anti-PD-1 therapy, KEYTRUDA (pembrolizumab). The company was founded in 2008 and is based in South San Francisco, California.

151 Oyster Point Boulevard, South San Francisco, CA, United States, 94080

650 515 3185

69
| Name | Title | Year Born |
|---|---|---|
| Dr. Sean A. McCarthy D.Phil., DPHIL | Chairman & CEO | 1967 |
| Mr. Lloyd A. Rowland Jr., J.D. | Sr. VP, Gen. Counsel, Chief Compliance Officer & Sec. | 1957 |
| Mr. Christopher W. Ogden | Sr. VP of Fin. and Accounting, Principal Financial Officer & Principal Accounting Officer | 1984 |
| Dr. Chau Cheng M.B.A., Ph.D. | VP of Investor Relations & Corp. Communications | NA |
| Ms. Danielle Olander-Moghadassian | Sr. VP & Chief HR Officer | NA |
| Ms. Leslie Robbins | Sr. VP of Intellectual Property | NA |
| Dr. Marcia P. Belvin Ph.D. | Sr. VP & Head of Research | NA |
| Mr. Jeffrey Landau B.S., M.B.A. | Sr. VP, Head of Strategy & Chief Bus. Officer | 1978 |
| Dr. Jamie Moore Ph.D. | Sr. VP & Head of Protein and Process Sciences and Manufacturing | NA |
| Dr. Hoyoung Huh M.D., Ph.D. | Special Advisor to Chief Exec. Officer | 1969 |
Disclaimer - (*)This information, including any data, is sourced from Unicorn Data Services SAS, trading as EOD Historical Data (“EODHD”) on an ‘as is’ basis, using their API. We cannot guarantee the completeness or validity of the information and data provided on this page, as well as via the API. In some cases, the data may include analyst ratings or recommendations sourced through the EODHD API, which are intended solely for general information purposes.
This information does not consider your personal objectives, financial situation, or needs. Kalkine is not liable for any errors or omissions in the information provided or for any actions taken in reliance on it. You should seek advice from a financial adviser, stockbroker or other professional adviser (including taxation and legal advice) as necessary before acting on this information.

Download a free report with stock ideas and industry insights for general information.
Download Free Report Now →


Basic Materials
 +1.59%
Communication Services
+0.05%

Consumer Cyclical
+0.14%

Consumer Defensive
 -0.43%

Energy
-0.03%

Financial Services
+0.19%
Financials
-0.35%

Healthcare
+1.05%

Industrials
+0.67%

Real Estate
-0.25%

Technology
+1.31%

Utilities
+0.32%
Note: Daily price change (%) by sector excluding stocks with +/-90% daily price change. Companies above $500 million market capitalization are considered.
 Portfolio
 Watchlist


 Please wait processing your request...