 CA
 NZ
 UK
 AU
 IND

 US


…
CEVA, Inc. provides silicon and software intellectual property (IP) solutions to semiconductor and original equipment manufacturer companies in the United States, Europe, the Middle East, the Asia Pacific, and internationally. The company offers PentaG-RAN, a hardware and software IP for implementing L1 PHY baseband processing in 5G and 5G-A base station and other cellular infrastructure system-on-chips (SoCs); Ceva XC20 DSPs and the PentaG2 platform support 5G/5G Advanced baseband for mobile broadband, RedCap, and IoT devices; Ceva-BX2 baseband processor; Ceva-XC21, high-efficiency vector DSP cores for 5G and 5G-advanced; Ceva-XC23, DSP for 5G and 5G-advanced; and Ceva-Waves Bluetooth platform, a set of hardware IP, software modules, and radios addressing a range of processes and nodes. It also provides Ceva-Waves Wi-Fi platform, a set of hardware IP and CPU-agnostic host software for energy-efficient SoC implementation of Wi-Fi subsystems; Ceva-Waves ultra-wideband platform; Ceva-Waves Links, which provide solutions for SoCs requiring multiple connectivity standards; and Ceva-Waves DragonFly, a turnkey platform for implementing NB-IoT cellular modem SoCs. In addition, the company offers Ceva-SensPro, a family of DSP cores; Ceva-BX1 audio digital signal controller IP; Ceva-ClearVox ENC software, a neural-network-based noise cancellation; Ceva-RealSpace, a spatial audio and head tracking software solution; and Ceva-MotionEngine, a sensor fusion software. Further, it provides Ceva-NeuPro-M, a neural processing unit (NPU) IP for generative AI; a Ceva-NeuPro-Nano, an NPU IP for embedded AI; and Ceva-NeuPro Studio, a software development environment for the development and deployment of AI models on the Ceva-NeuPro NPUs. The company was formerly known as ParthusCeva, Inc. and changed its name to CEVA, Inc. in December 2003. The company was incorporated in 1999 and is headquartered in Rockville, Maryland.
Source: TradingView
The charts and visual representations are sourced from TradingView through embedded widgets. For any issues with chart display, please visit the TradingView website
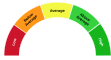
A unique technical analysis driven score developed by Kalkine showing momentum in stock prices based on select technical indicators identified.


| Breakdown | 2025-12-31 | 2024-12-31 | 2023-12-31 | 2022-12-31 | 2021-12-31 |
|---|---|---|---|---|---|
| Type | yearly | yearly | yearly | yearly | yearly |
| Date | 2025-12-31 | 2024-12-31 | 2023-12-31 | 2022-12-31 | 2021-12-31 |
| Income before tax | -4.69M | -2.75M | -8.21M | -5.11M | 5.69M |
| Net income | -10.64M | -8.79M | -11.88M | -23.18M | 0.40M |
| Selling general administrative | 18.09M | 16.88M | 14.91M | 15.32M | 14.30M |
| Selling and marketing expenses | 13.26M | 12.62M | 11.04M | 12.90M | 12.86M |
| Gross profit | 95.44M | 94.17M | 85.77M | 107.60M | 105.88M |
| Reconciled depreciation | 4.27M | 4.14M | 5.65M | 2.72M | 2.71M |
| Ebit | -4.69M | -7.54M | -13.47M | 4.21M | 1.52M |
| Ebitda | -0.55M | -3.41M | -8.58M | 6.94M | 4.23M |
| Depreciation and amortization | 4.14M | 4.14M | 4.88M | 2.72M | 2.71M |
| Non operating income net other | - | - | - | 2.81M | 0.20M |
| Operating income | -11.35M | -7.54M | -13.47M | 4.21M | 1.52M |
| Other operating expenses | 120.94M | 114.48M | 110.89M | 136.50M | 119.20M |
| Interest expense | - | - | - | 0.40M | 0.42M |
| Tax provision | 5.95M | 6.03M | 1.34M | 18.07M | 5.29M |
| Interest income | 6.25M | 5.88M | 5.88M | 3.19M | 1.87M |
| Net interest income | 6.25M | 5.88M | 5.49M | 2.81M | 0.20M |
| Non recurring | - | - | - | 3.56M | - |
| Income tax expense | 5.95M | 6.03M | 10.23M | 18.07M | 5.29M |
| Total revenue | 109.60M | 106.94M | 97.42M | 134.65M | 122.71M |
| Total operating expenses | 106.79M | 101.72M | 99.24M | 109.45M | 102.37M |
| Cost of revenue | 14.16M | 12.77M | 11.65M | 27.05M | 16.83M |
| Total other income expense net | 6.66M | 4.79M | 5.26M | -9.32M | 4.16M |
| Net income from continuing ops | -10.64M | -8.79M | -15.12M | -23.18M | 0.40M |
| Net income applicable to common shares | - | - | - | -23.18M | 0.40M |
| Breakdown | 2025-12-31 | 2024-12-31 | 2023-12-31 | 2022-12-31 | 2021-12-31 |
|---|---|---|---|---|---|
| Type | yearly | yearly | yearly | yearly | yearly |
| Date | 2025-12-31 | 2024-12-31 | 2023-12-31 | 2022-12-31 | 2021-12-31 |
| Total assets | 388.26M | 308.95M | 304.08M | 308.44M | 328.66M |
| Intangible assets | 1.04M | 1.88M | 2.97M | 6.68M | 14.61M |
| Other current assets | 13.50M | 15.49M | 8.46M | 6.90M | 6.67M |
| Total liab | 51.80M | 42.39M | 39.74M | 49.57M | 51.93M |
| Total stockholder equity | 336.46M | 266.56M | 264.34M | 258.87M | 276.73M |
| Other current liab | 21.03M | 20.48M | 20.94M | 25.13M | 22.04M |
| Common stock | 0.03M | 0.02M | 0.02M | 0.02M | 0.02M |
| Capital stock | 0.03M | 0.02M | 0.02M | 0.02M | 0.02M |
| Retained earnings | -0.02M | 11.19M | 20.17M | 32.16M | 55.48M |
| Other liab | - | - | - | 9.59M | 11.36M |
| Good will | 58.31M | 58.31M | 58.31M | 74.78M | 74.78M |
| Other assets | - | 1.14M | 0.00M | 23.36M | 34.70M |
| Cash | 40.59M | 18.50M | 23.29M | 21.29M | 33.15M |
| Total current liabilities | 28.68M | 30.53M | 27.62M | 33.28M | 35.44M |
| Current deferred revenue | 3.50M | 4.61M | 3.02M | 3.17M | 8.66M |
| Net debt | -10.07M | -12.94M | -16.83M | -11.60M | -24.75M |
| Short term debt | 1.74M | 2.60M | 2.51M | 2.98M | 3.27M |
| Short long term debt total | 30.52M | 5.56M | 6.46M | 9.69M | 8.40M |
| Other stockholder equity | 336.38M | 256.67M | 246.48M | 232.94M | 221.60M |
| Property plant equipment | - | - | - | 7.10M | 15.59M |
| Total current assets | 284.84M | 216.34M | 205.31M | 177.65M | 188.98M |
| Long term investments | 0.06M | 0.31M | 0.41M | 0.41M | 2.92M |
| Net tangible assets | - | - | - | 177.41M | 187.35M |
| Short term investments | 181.40M | 145.15M | 143.25M | 118.19M | 121.71M |
| Net receivables | 49.35M | 37.21M | 30.31M | 31.27M | 27.45M |
| Accounts payable | 2.42M | 1.12M | 1.15M | 2.00M | 1.46M |
| Accumulated other comprehensive income | 0.08M | -1.33M | -2.33M | -6.25M | -0.37M |
| Common stock total equity | - | - | - | 0.02M | 0.02M |
| Retained earnings total equity | - | - | - | 32.16M | 55.48M |
| Treasury stock | - | - | - | -9.90M | -13.79M |
| Non currrent assets other | 19.22M | 17.97M | 17.71M | 22.97M | 8.68M |
| Non current assets total | 103.42M | 92.61M | 98.78M | 130.79M | 139.68M |
| Capital lease obligations | 16.13M | 5.56M | 6.46M | 9.69M | 8.40M |
| Breakdown | 2025-12-31 | 2024-12-31 | 2023-12-31 | 2022-12-31 | 2021-12-31 |
|---|---|---|---|---|---|
| Type | yearly | yearly | yearly | yearly | yearly |
| Date | 2025-12-31 | 2024-12-31 | 2023-12-31 | 2022-12-31 | 2021-12-31 |
| Investments | -34.55M | -2.45M | -4.58M | -28.50M | -3.11M |
| Change to liabilities | - | - | - | 2.97M | -1.14M |
| Total cashflows from investing activities | -2.45M | -2.45M | - | -15.12M | -16.71M |
| Total cash from financing activities | -5.57M | -5.57M | -2.77M | -3.31M | 3.24M |
| Change to operating activities | - | - | - | 0.67M | 0.60M |
| Net income | -10.64M | -8.79M | -11.88M | -23.18M | 0.40M |
| Change in cash | -4.79M | -4.79M | 2.00M | -11.87M | 12.01M |
| Begin period cash flow | 23.29M | 23.29M | 21.29M | 33.15M | 21.14M |
| End period cash flow | 18.50M | 18.50M | 23.29M | 21.29M | 33.15M |
| Total cash from operating activities | 3.47M | 3.47M | -6.33M | 6.92M | 25.80M |
| Issuance of capital stock | 63.26M | 0.00M | - | - | - |
| Depreciation | 4.14M | 4.14M | 4.88M | 7.56M | 6.99M |
| Other cashflows from investing activities | 117.87M | -0.75M | - | 16.89M | -11.40M |
| Change to inventory | - | - | -9.02M | - | 0.79M |
| Change to account receivables | -11.85M | -6.78M | -0.03M | -3.75M | 5.84M |
| Sale purchase of stock | -7.15M | -8.46M | -6.16M | -6.79M | 3.24M |
| Other cashflows from financing activities | -64.91M | 2.88M | 3.39M | 3.48M | 3.24M |
| Change to netincome | - | - | - | 25.52M | 14.22M |
| Capital expenditures | 2.96M | 2.96M | 2.88M | 3.50M | 2.19M |
| Cash flows other operating | - | - | - | -6.34M | 4.93M |
| Cash and cash equivalents changes | - | - | - | -11.50M | 12.34M |
| Change in working capital | -16.25M | -7.72M | -3.21M | 1.87M | 5.78M |
| Stock based compensation | 15.57M | 15.57M | 16.20M | 14.51M | 13.05M |
| Other non cash items | 10.72M | 0.33M | -19.01M | 12.47M | -0.08M |
| Free cash flow | 0.52M | 0.52M | -9.21M | 3.42M | 23.61M |
Sector: Technology Industry: Semiconductors
|
Stock Name
|
Change
(USD) |
Price
(USD) |
Trailing
PE (x) |
Forward
PE (x) |
Price Sales
TTM (x) |
Price to Book Value (x)
|
Enterprise Value
to Revenue (x) |
Enterprise Value
to EBITDA (x) |
|---|---|---|---|---|---|---|---|---|
| CEVA CEVA Inc |
1.00 3.19% |
32.37 | - | 39.68 | 6.79 | 2.30 | 5.00 | 126.83 |
| NVDA NVIDIA Corporation |
-2.56 1.17% |
215.38 | 26.82 | 23.26 | 16.91 | 22.25 | 16.73 | 21.68 |
| AVGO Broadcom Inc |
9.48 2.77% |
351.81 | 78.55 | 35.84 | 27.93 | 23.69 | 28.47 | 52.08 |
| SKHY SK Hynix Inc. American Depositary Shares |
19.34 13.30% |
164.70 | 10.38 | 4.93 | 0.01 | 6.38 | 6.01 | 5.12 |
| TSM Taiwan Semiconductor Manufacturing |
2.64 0.60% |
439.51 | 19.45 | 15.92 | 0.24 | 4.85 | 0.22 | 0.30 |
CEVA, Inc. provides silicon and software intellectual property (IP) solutions to semiconductor and original equipment manufacturer companies in the United States, Europe, the Middle East, the Asia Pacific, and internationally. The company offers PentaG-RAN, a hardware and software IP for implementing L1 PHY baseband processing in 5G and 5G-A base station and other cellular infrastructure system-on-chips (SoCs); Ceva XC20 DSPs and the PentaG2 platform support 5G/5G Advanced baseband for mobile broadband, RedCap, and IoT devices; Ceva-BX2 baseband processor; Ceva-XC21, high-efficiency vector DSP cores for 5G and 5G-advanced; Ceva-XC23, DSP for 5G and 5G-advanced; and Ceva-Waves Bluetooth platform, a set of hardware IP, software modules, and radios addressing a range of processes and nodes. It also provides Ceva-Waves Wi-Fi platform, a set of hardware IP and CPU-agnostic host software for energy-efficient SoC implementation of Wi-Fi subsystems; Ceva-Waves ultra-wideband platform; Ceva-Waves Links, which provide solutions for SoCs requiring multiple connectivity standards; and Ceva-Waves DragonFly, a turnkey platform for implementing NB-IoT cellular modem SoCs. In addition, the company offers Ceva-SensPro, a family of DSP cores; Ceva-BX1 audio digital signal controller IP; Ceva-ClearVox ENC software, a neural-network-based noise cancellation; Ceva-RealSpace, a spatial audio and head tracking software solution; and Ceva-MotionEngine, a sensor fusion software. Further, it provides Ceva-NeuPro-M, a neural processing unit (NPU) IP for generative AI; a Ceva-NeuPro-Nano, an NPU IP for embedded AI; and Ceva-NeuPro Studio, a software development environment for the development and deployment of AI models on the Ceva-NeuPro NPUs. The company was formerly known as ParthusCeva, Inc. and changed its name to CEVA, Inc. in December 2003. The company was incorporated in 1999 and is headquartered in Rockville, Maryland.

15245 Shady Grove Road, Rockville, MD, United States, 20850

240 308 8328

374
| Name | Title | Year Born |
|---|---|---|
| Mr. Gideon Wertheizer | CEO & Director | 1956 |
| Mr. Yaniv Arieli | CFO & Treasurer | 1968 |
| Mr. Michael Boukaya | Chief Operating Officer | 1975 |
| Mr. Issachar Ohana | Exec. VP of Worldwide Sales | 1966 |
| Mr. Erez Bar-Niv | Chief Technology Officer | NA |
| Mr. Richard Kingston | VP of Market Intelligence, Investor & PR | NA |
| Ms. Geraldine Kutas | Director of Corp. Affairs & Communication | NA |
| Mr. Moshe Sheier | VP of Marketing | NA |
| Ms. Dana Maor-Megiddo | VP of People | NA |
| Mr. Jim Gobes | Chief Exec. Officer of Intrinsix | NA |
Disclaimer - (*)This information, including any data, is sourced from Unicorn Data Services SAS, trading as EOD Historical Data (“EODHD”) on an ‘as is’ basis, using their API. We cannot guarantee the completeness or validity of the information and data provided on this page, as well as via the API. In some cases, the data may include analyst ratings or recommendations sourced through the EODHD API, which are intended solely for general information purposes.
This information does not consider your personal objectives, financial situation, or needs. Kalkine is not liable for any errors or omissions in the information provided or for any actions taken in reliance on it. You should seek advice from a financial adviser, stockbroker or other professional adviser (including taxation and legal advice) as necessary before acting on this information.

Download a free report with stock ideas and industry insights for general information.
Download Free Report Now →


Basic Materials
 +0.02%
Communication Services
 -0.63%

Consumer Cyclical
-0.11%

Consumer Defensive
-0.45%

Energy
+0.39%

Financial Services
-0.10%
Financials
-0.81%

Healthcare
+1.03%

Industrials
+0.32%

Real Estate
-0.31%

Technology
+0.59%

Utilities
-0.18%
Note: Daily price change (%) by sector excluding stocks with +/-90% daily price change. Companies above $500 million market capitalization are considered.
 Portfolio
 Watchlist


 Please wait processing your request...