 CA
 NZ
 UK
 AU
 IND

 US


…
argenx SE, a biotechnology company, engages in the developing of various therapies for the treatment of autoimmune diseases in the United States, Japan, Europe, Middle East, Africa, and China. Its lead product candidate is efgartigimod for the treatment of patients with myasthenia gravis, immune thrombocytopenia, pemphigus vulgaris, generalized myasthenia gravis, chronic inflammatory demyelinating polyneuropathy, thyroid eye disease, bullous pemphigoid, myositis, primary sjögren's syndrome, post-covid postural orthostatic tachycardia syndrome, membranous nephropathy, lupus nephropathy, anca-associated vasculitis, and antibody mediated rejection; ENHANZE SC; Empasiprubart for multifocal motor neuropath, delayed graft function, and dermatomyositis; and ARGX-119 for congenital myasthenic syndrome and amyotrophic lateral sclerosis. The company is developing ARGX-213 targets FcRn; ARGX-121 and ARGX-220 targets immune system; ARGX-109 targets IL-6; ARGX-118 for inflammation; and ARGX-109, as well as cusatuzumab, ARGX-112, ARGX-114, and ARGX-115. It owns VYVGART; VYVGART HYTRULO; VYVDURA; ARGENX; ABDEG; NHANCE; SIMPLE ANTIBODY; and ARGENXMEDHUB. The company has strategic partnership with AbbVie S.À.R.L., Zai Lab Limited, and LEO Pharma A/S; and collaboration and license agreement with Genor Biopharma Co. Ltd, Université Catholique de Louvain, Sopartec S.A., NYU Langone Health, Leiden University Medical Center, AgomAb Therapeutics NV, Broteio Pharma B.V., VIB vzw, University of Texas, BioWa, Inc., and Shire International GmbH. It has collaboration agreement with Genmab A/S to discover, develop, and commercialize novel therapeutic antibodies with applications in immunology and oncology, as well as a strategic collaboration with IQVIA Holdings Inc. to provide safety systems and services. argenx SE was incorporated in 2008 and is based in Amsterdam, the Netherlands.
Source: TradingView
The charts and visual representations are sourced from TradingView through embedded widgets. For any issues with chart display, please visit the TradingView website
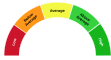
A unique technical analysis driven score developed by Kalkine showing momentum in stock prices based on select technical indicators identified.
argenx NV is a commercial-stage biopharma using an FcRn-targeting antibody platform; its lead drug efgartigimod is marketed for autoimmune disease and the company maintains a development pipeline. Long-term growth may be driven by geographic and label expansion of the approved product, advancement of pipeline candidates and further platform-enabled programs, which could support revenue scaling if commercial uptake continues.
Material risks include clinical or regulatory setbacks, slower-than-expected commercial adoption and reimbursement hurdles, competition from other immunotherapies and potential financing needs.

Note: The summary and risk score provided above is created by AI and should not be construed as a recommendation of Kalkine.


| Breakdown | 2023-12-31 | 2022-12-31 | 2021-12-31 | 2020-12-31 | 2019-12-31 |
|---|---|---|---|---|---|
| Type | yearly | yearly | yearly | yearly | yearly |
| Date | 2023-12-31 | 2022-12-31 | 2021-12-31 | 2020-12-31 | 2019-12-31 |
| Income before tax | -304.50M | -729.31M | -399.74M | -647.81M | -177.23M |
| Minority interest | - | - | - | - | 0.00M |
| Net income | -295.05M | -709.59M | -408.26M | -651.23M | -182.55M |
| Selling general administrative | 507.39M | 469.92M | 307.64M | 183.91M | 60.32M |
| Selling and marketing expenses | 202.15M | 2.21M | 59.97M | - | 12.01M |
| Gross profit | 1108.48M | 381.31M | -12.77M | -259.08M | -118.65M |
| Reconciled depreciation | 111.31M | 104.34M | 5.87M | 3.43M | 2.17M |
| Ebit | -327.50M | -686.35M | -320.29M | -605.89M | -200.01M |
| Ebitda | -216.02M | -582.01M | -314.42M | -601.67M | -182.68M |
| Depreciation and amortization | 111.48M | 104.34M | 5.87M | 4.22M | 17.33M |
| Non operating income net other | - | - | - | - | 0.00M |
| Operating income | -425.05M | -719.66M | -348.75M | -514.38M | -200.01M |
| Other operating expenses | 1651.37M | 1130.41M | 846.02M | 562.36M | 279.41M |
| Interest expense | 0.90M | 3.91M | 1.10M | 1.74M | 0.14M |
| Tax provision | -9.44M | -19.72M | 8.52M | 2.78M | 4.75M |
| Interest income | 92.96M | 27.66M | 3.49M | 5.12M | 7.87M |
| Net interest income | 92.06M | 23.76M | -0.94M | -1.41M | 7.75M |
| Extraordinary items | - | - | - | - | 0.00M |
| Non recurring | - | - | - | - | 0.00M |
| Other items | - | - | - | - | 0.00M |
| Income tax expense | -9.44M | -19.72M | 8.52M | 3.43M | 5.32M |
| Total revenue | 1226.32M | 410.75M | 497.28M | 44.85M | 78.17M |
| Total operating expenses | 1533.53M | 1100.98M | 846.02M | 562.36M | 279.41M |
| Cost of revenue | 117.83M | 29.43M | 510.04M | 303.93M | 196.82M |
| Total other income expense net | 120.55M | -5.04M | -35.01M | -127.87M | 22.79M |
| Discontinued operations | - | - | - | - | 0.00M |
| Net income from continuing ops | -295.05M | -709.59M | -408.26M | -528.92M | -162.97M |
| Net income applicable to common shares | - | -709.59M | -408.26M | -528.92M | -162.97M |
| Preferred stock and other adjustments | - | - | - | - | 0.00M |
| Breakdown | 2023-12-31 | 2022-12-31 | 2021-12-31 | 2020-12-31 | 2019-12-31 |
|---|---|---|---|---|---|
| Type | yearly | yearly | yearly | yearly | yearly |
| Date | 2023-12-31 | 2022-12-31 | 2021-12-31 | 2020-12-31 | 2019-12-31 |
| Total assets | 4542.46M | 3134.26M | 2850.27M | 2284.87M | 1605.59M |
| Intangible assets | 125.23M | 174.90M | 171.68M | 167.78M | 44.99M |
| Other current assets | 134.07M | -0.00M | 58.95M | 27.98M | 1033.11M |
| Total liab | 444.95M | 320.56M | 316.05M | 606.76M | 428.57M |
| Total stockholder equity | 4097.51M | 2813.70M | 2534.22M | 1678.11M | 1177.02M |
| Deferred long term liab | - | - | - | - | 0.00M |
| Other current liab | 172.79M | 110.14M | 88.88M | 72.53M | 0.39M |
| Common stock | 7.06M | 6.64M | 6.23M | 5.85M | 4.79M |
| Capital stock | 7.06M | 6.64M | 6.23M | 5.85M | 4.79M |
| Retained earnings | -2404.84M | -2109.79M | -1400.20M | -1059.59M | -372.53M |
| Other liab | - | 9.28M | 6.86M | 220.59M | 218.10M |
| Good will | - | - | - | - | 0.00M |
| Other assets | - | 128.45M | 119.78M | 30.34M | 0.00M |
| Cash | 2048.84M | 800.74M | 1334.68M | 1219.63M | 371.09M |
| Total current liabilities | 422.99M | 302.28M | 301.24M | 329.26M | 179.18M |
| Current deferred revenue | - | - | - | 46.44M | 81.03M |
| Net debt | -2028.84M | -788.31M | -1323.21M | -1209.95M | -363.80M |
| Short term debt | 4.65M | 3.42M | 3.51M | 3.48M | 2.21M |
| Short long term debt | - | - | - | - | 0.00M |
| Short long term debt total | 20.00M | 12.43M | 11.46M | 9.68M | 7.30M |
| Other stockholder equity | 6423.22M | 4309.88M | 3462.78M | 2531.39M | 1465.79M |
| Property plant equipment | - | 16.23M | 15.84M | 9.49M | 8.17M |
| Total current assets | 4123.74M | 2774.20M | 2542.97M | 2061.78M | 1538.24M |
| Long term investments | 47.16M | 40.48M | 53.17M | 5.14M | 2.60M |
| Net tangible assets | - | 2638.80M | 2362.54M | 1227.96M | 1010.59M |
| Short term investments | 1131.00M | 1391.81M | 1002.05M | 781.46M | 1125.26M |
| Net receivables | 499.27M | 277.27M | 38.22M | 7.46M | 31.79M |
| Long term debt | - | - | - | - | 0.00M |
| Inventory | 310.55M | 228.35M | 109.08M | 25.25M | -1023.00M |
| Accounts payable | 245.56M | 188.72M | 208.85M | 206.80M | 95.55M |
| Total permanent equity | - | - | - | - | 0.00M |
| Noncontrolling interest in consolidated entity | - | - | - | - | 0.00M |
| Temporary equity redeemable noncontrolling interests | - | - | - | - | 0.00M |
| Accumulated other comprehensive income | 72.07M | 606.97M | 465.41M | 200.46M | 78.97M |
| Additional paid in capital | - | - | - | - | 0.00M |
| Common stock total equity | - | - | - | 4.76M | 4.28M |
| Preferred stock total equity | - | - | - | - | 0.00M |
| Retained earnings total equity | - | - | - | - | 0.00M |
| Treasury stock | - | - | - | - | 0.00M |
| Accumulated amortization | - | - | - | - | 0.00M |
| Non currrent assets other | 126.45M | 49.23M | 34.42M | 22.24M | 0.71M |
| Deferred long term asset charges | - | - | - | - | 0.00M |
| Non current assets total | 418.72M | 360.06M | 307.30M | 223.09M | 67.34M |
| Capital lease obligations | 20.00M | 12.43M | 11.46M | 7.87M | 6.51M |
| Long term debt total | - | - | - | - | 0.00M |
| Breakdown | 2023-12-31 | 2022-12-31 | 2021-12-31 | 2020-12-31 | 2019-12-31 |
|---|---|---|---|---|---|
| Type | yearly | yearly | yearly | yearly | yearly |
| Date | 2023-12-31 | 2022-12-31 | 2021-12-31 | 2020-12-31 | 2019-12-31 |
| Investments | 308.21M | -461.18M | -228.24M | 307.64M | -744.34M |
| Change to liabilities | - | 0.33M | -180.47M | 12.28M | 310.63M |
| Total cashflows from investing activities | - | -461.18M | -347.07M | 310.25M | -744.34M |
| Net borrowings | - | -4.17M | -3.85M | -2.23M | -1.35M |
| Total cash from financing activities | 1336.73M | 843.76M | 1121.34M | 920.85M | 738.60M |
| Change to operating activities | - | -34.51M | -44.97M | -22.73M | -10.73M |
| Net income | -425.05M | -720.34M | -348.75M | -514.38M | -200.01M |
| Change in cash | 1248.10M | -533.94M | 117.87M | 813.03M | 56.28M |
| Begin period cash flow | 800.74M | 1334.68M | 1216.80M | 407.89M | 314.81M |
| End period cash flow | 2048.84M | 800.74M | 1334.68M | 1220.92M | 371.09M |
| Total cash from operating activities | -420.33M | -862.81M | -606.81M | -426.44M | 150.76M |
| Issuance of capital stock | 1196.73M | 760.95M | 1091.33M | 899.77M | 760.53M |
| Depreciation | 111.31M | 104.34M | 5.87M | 4.22M | 2.43M |
| Other cashflows from investing activities | - | 13.14M | 2.60M | 7.06M | 5.47M |
| Dividends paid | - | 5.47M | - | - | 0.00M |
| Change to inventory | -83.03M | -119.28M | -83.88M | -25.28M | -28.01M |
| Change to account receivables | -185.98M | -222.38M | -31.58M | 22.13M | -25.70M |
| Sale purchase of stock | -12.14M | -5.47M | - | - | 0.00M |
| Other cashflows from financing activities | 143.80M | 86.97M | 33.87M | 22.39M | -20.41M |
| Change to netincome | - | 118.17M | 136.54M | 190.35M | 18.44M |
| Capital expenditures | 43.81M | 103.82M | 121.43M | 5.48M | 46.76M |
| Change receivables | - | - | - | - | 0.00M |
| Cash flows other operating | - | - | - | - | 0.00M |
| Exchange rate changes | - | - | - | - | 0.00M |
| Cash and cash equivalents changes | - | - | - | - | 0.00M |
| Change in working capital | -404.49M | -375.72M | -340.95M | -13.80M | 310.22M |
| Stock based compensation | 232.97M | 157.03M | 179.37M | 97.03M | 44.31M |
| Other non cash items | 97.67M | -28.11M | -75.00M | -6.50M | -6.18M |
| Free cash flow | -464.14M | -966.63M | -728.25M | -431.92M | 103.99M |
Sector: Healthcare Industry: Biotechnology
|
Stock Name
|
Change
(USD) |
Price
(USD) |
Trailing
PE (x) |
Forward
PE (x) |
Price Sales
TTM (x) |
Price to Book Value (x)
|
Enterprise Value
to Revenue (x) |
Enterprise Value
to EBITDA (x) |
|---|---|---|---|---|---|---|---|---|
| ARGX argenx NV ADR |
-4.98 0.55% |
892.87 | - | 103.09 | 19.14 | 8.74 | 18.47 | -100.18 |
| NVO Novo Nordisk A/S |
0.86 2.20% |
40.00 | 41.58 | 31.15 | 2.13 | 32.99 | 2.11 | 4.70 |
| VRTX Vertex Pharmaceuticals Inc |
18.88 3.50% |
558.88 | 30.22 | 24.27 | 10.36 | 6.50 | 9.99 | 24.66 |
| REGN Regeneron Pharmaceuticals Inc |
109.12 13.33% |
927.89 | 29.07 | 20.12 | 7.57 | 3.82 | 6.95 | 19.42 |
| ARGNF argenx SE |
- -% |
900.30 | 45.77 | 31.25 | 13.84 | 7.12 | 11.38 | 36.06 |
argenx SE, a biotechnology company, engages in the developing of various therapies for the treatment of autoimmune diseases in the United States, Japan, Europe, Middle East, Africa, and China. Its lead product candidate is efgartigimod for the treatment of patients with myasthenia gravis, immune thrombocytopenia, pemphigus vulgaris, generalized myasthenia gravis, chronic inflammatory demyelinating polyneuropathy, thyroid eye disease, bullous pemphigoid, myositis, primary sjögren's syndrome, post-covid postural orthostatic tachycardia syndrome, membranous nephropathy, lupus nephropathy, anca-associated vasculitis, and antibody mediated rejection; ENHANZE SC; Empasiprubart for multifocal motor neuropath, delayed graft function, and dermatomyositis; and ARGX-119 for congenital myasthenic syndrome and amyotrophic lateral sclerosis. The company is developing ARGX-213 targets FcRn; ARGX-121 and ARGX-220 targets immune system; ARGX-109 targets IL-6; ARGX-118 for inflammation; and ARGX-109, as well as cusatuzumab, ARGX-112, ARGX-114, and ARGX-115. It owns VYVGART; VYVGART HYTRULO; VYVDURA; ARGENX; ABDEG; NHANCE; SIMPLE ANTIBODY; and ARGENXMEDHUB. The company has strategic partnership with AbbVie S.À.R.L., Zai Lab Limited, and LEO Pharma A/S; and collaboration and license agreement with Genor Biopharma Co. Ltd, Université Catholique de Louvain, Sopartec S.A., NYU Langone Health, Leiden University Medical Center, AgomAb Therapeutics NV, Broteio Pharma B.V., VIB vzw, University of Texas, BioWa, Inc., and Shire International GmbH. It has collaboration agreement with Genmab A/S to discover, develop, and commercialize novel therapeutic antibodies with applications in immunology and oncology, as well as a strategic collaboration with IQVIA Holdings Inc. to provide safety systems and services. argenx SE was incorporated in 2008 and is based in Amsterdam, the Netherlands.
| Name | Title | Year Born |
|---|---|---|
| Mr. Timothy Van Hauwermeiren EMBA, M.B.A., M.Sc., MSc | CEO & Exec. Director | 1972 |
| Prof. Hans de Haard Ir, Ph.D. | Co-Founder & Chief Scientific Officer | 1960 |
| Mr. Karl Gubitz | Chief Financial Officer | 1970 |
| Mr. R. Keith Woods | Chief Operating Officer | 1968 |
| Mr. Arjen Lemmen M.Sc. | VP of Corp. Devel. & Strategy | 1985 |
| Dr. David L. Lacey M.D. | Advisor | 1952 |
| Ms. Andria Wilk | Global Head of Quality | 1974 |
| Mr. Filip Borgions | VP & Global Head of Technical Operations | NA |
| Ms. Beth DelGiacco | VP and Global Head of Corp. Communications & Investor Relations | NA |
| Ms. Malini Moorthy | Gen. Counsel | 1970 |
Disclaimer - (*)This information, including any data, is sourced from Unicorn Data Services SAS, trading as EOD Historical Data (“EODHD”) on an ‘as is’ basis, using their API. We cannot guarantee the completeness or validity of the information and data provided on this page, as well as via the API. In some cases, the data may include analyst ratings or recommendations sourced through the EODHD API, which are intended solely for general information purposes.
This information does not consider your personal objectives, financial situation, or needs. Kalkine is not liable for any errors or omissions in the information provided or for any actions taken in reliance on it. You should seek advice from a financial adviser, stockbroker or other professional adviser (including taxation and legal advice) as necessary before acting on this information.

Download a free report with stock ideas and industry insights for general information.
Download Free Report Now →


Basic Materials
 -1.82%
Communication Services
-0.22%

Consumer Cyclical
-0.13%

Consumer Defensive
 +0.32%

Energy
+0.15%

Financial Services
-0.85%
Financials
+2.34%

Healthcare
-1.28%

Industrials
-0.96%

Real Estate
-0.38%

Technology
-2.73%

Utilities
-0.31%
Note: Daily price change (%) by sector excluding stocks with +/-90% daily price change. Companies above $500 million market capitalization are considered.
 Portfolio
 Watchlist


 Please wait processing your request...