 CA
 NZ
 UK
 AU
 IND

 US


…
Gooch & Housego PLC engages in the manufacture and sale of acousto-optics, electro-optics, fiber optics, and precision optics and systems in the United Kingdom, North America, Europe, the Asia Pacific, and internationally. The company operates through A&D, Life Sciences, and Industrial segments. It offers acousto-optic products, such as acoustic-optic modulators, deflectors, frequency shifters, mode lockers, pulse pickers, Q-switches, tunable filters, and RF drivers; crystal optics, including crystals and nonlinear optics, lithium niobate wafers, and periodically-poled lithium niobite; and electro-optics, such as pockels cells, lithium niobate Q-switches, and pockels cell drivers. The company also provides fiber optics, such as fiber-coupled acousto-optic modulators, high power combiners, PM and SM couplers, polarization diverse receivers, ruggedized and wideband couplers, and variable optical delay line; precision optics, including beam splitters, corner cubes, optical domes, optical windows and flats, polymer optics, precision lenses, precision mirrors, precision prisms, ring laser gyroscope components, synchrotron mirrors, waveplates, optical bindings, magnetorheological finishing, optical coatings, single point diamond turning, and super polishing; lens systems; and vision systems for armored fighting vehicles, including embedded image periscope and sighting systems, enhanced drivers vision system, saber commander/gunner sights, spares and repairs, specter camera modules, and unity vision periscopes; and medical devices, in-vitro diagnostics, and laboratory instruments. Its products are used in semiconductor and microelectronic, metrology, telecommunications, remote sensing, and scientific research industries. The company serves aerospace and defense, industrial and telecom, life sciences markets. Gooch & Housego PLC was founded in 1948 and is headquartered in Ilminster, the United Kingdom.
Source: TradingView
The charts and visual representations are sourced from TradingView through embedded widgets. For any issues with chart display, please visit the TradingView website
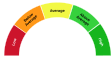
A unique technical analysis driven score developed by Kalkine showing momentum in stock prices based on select technical indicators identified.


| Breakdown | 2025-09-30 | 2024-09-30 | 2023-09-30 | 2022-09-30 | 2021-09-30 |
|---|---|---|---|---|---|
| Type | yearly | yearly | yearly | yearly | yearly |
| Date | 2025-09-30 | 2024-09-30 | 2023-09-30 | 2022-09-30 | 2021-09-30 |
| Income before tax | 5.33M | 4.21M | 5.02M | -2.27M | 4.68M |
| Net income | 3.54M | -6.38M | 4.05M | -2.01M | 3.40M |
| Selling general administrative | 26.50M | 15.67M | 13.98M | 12.88M | 12.29M |
| Selling and marketing expenses | - | 8.47M | 10.26M | 8.70M | 8.34M |
| Gross profit | 42.71M | 41.65M | 44.02M | 39.06M | 41.32M |
| Reconciled depreciation | 12.17M | 11.49M | 11.02M | 10.44M | 10.39M |
| Ebit | 7.86M | 6.85M | 9.68M | 0.23M | 11.26M |
| Ebitda | 20.03M | 18.34M | 20.70M | 10.68M | 21.65M |
| Depreciation and amortization | 12.17M | 11.49M | 11.02M | 10.44M | 10.39M |
| Operating income | 10.37M | 6.81M | 6.85M | 0.23M | 11.26M |
| Other operating expenses | 140.11M | 129.18M | 138.80M | 117.84M | 112.81M |
| Interest expense | 2.53M | 2.64M | 1.84M | 0.72M | 0.72M |
| Tax provision | 1.79M | 0.93M | 0.97M | -0.26M | 1.28M |
| Interest income | 0.01M | 0.04M | 0.01M | 0.00M | 0.00M |
| Net interest income | -2.81M | -2.60M | -1.83M | -0.72M | -0.72M |
| Income tax expense | 1.79M | 0.93M | 0.97M | -0.26M | 1.28M |
| Total revenue | 150.49M | 135.99M | 148.48M | 124.80M | 124.07M |
| Total operating expenses | 32.34M | 34.84M | 34.35M | 32.10M | 30.06M |
| Cost of revenue | 107.77M | 94.34M | 104.45M | 85.74M | 82.75M |
| Total other income expense net | -5.04M | -2.60M | -1.83M | -2.51M | -6.58M |
| Net income from continuing ops | 3.54M | 3.28M | 4.05M | -2.01M | 3.40M |
| Net income applicable to common shares | - | - | - | -2.01M | 3.40M |
| Breakdown | 2025-09-30 | 2024-09-30 | 2023-09-30 | 2022-09-30 | 2021-09-30 |
|---|---|---|---|---|---|
| Type | yearly | yearly | yearly | yearly | yearly |
| Date | 2025-09-30 | 2024-09-30 | 2023-09-30 | 2022-09-30 | 2021-09-30 |
| Total assets | 206.86M | 166.31M | 192.61M | 176.09M | 160.71M |
| Intangible assets | 25.61M | 11.05M | - | 12.32M | 14.12M |
| Other current assets | 1.95M | 1.54M | - | 35.60M | 28.31M |
| Total liab | 89.42M | 57.92M | 72.88M | 57.55M | 46.43M |
| Total stockholder equity | 117.44M | 108.39M | 119.73M | 118.54M | 114.28M |
| Deferred long term liab | - | - | - | 2.17M | 2.15M |
| Other current liab | 2.42M | 11.20M | 0.58M | 0.58M | 0.48M |
| Common stock | 5.42M | 5.16M | 5.16M | 5.01M | 5.01M |
| Capital stock | 5.42M | 5.16M | 5.16M | 5.01M | 5.01M |
| Retained earnings | 90.58M | 70.38M | 76.92M | 75.72M | 80.09M |
| Other liab | - | - | - | 9.14M | 9.03M |
| Good will | 40.96M | 40.00M | - | 35.62M | 36.72M |
| Other assets | - | - | - | 1.97M | 1.88M |
| Cash | 7.20M | 6.62M | 7.29M | 6.00M | 8.35M |
| Total current liabilities | 33.20M | 21.38M | 23.19M | 25.14M | 21.46M |
| Net debt | 43.86M | 25.81M | 31.71M | 19.07M | 9.24M |
| Short term debt | 2.23M | 1.30M | 1.45M | 1.80M | 1.65M |
| Short long term debt | 0.00M | 0.01M | 0.01M | 0.06M | 0.07M |
| Short long term debt total | 51.05M | 32.43M | 39.00M | 25.07M | 17.59M |
| Other stockholder equity | 16.05M | 32.85M | 37.65M | 37.82M | 29.18M |
| Property plant equipment | - | - | - | 47.51M | 43.17M |
| Total current assets | 90.82M | 68.16M | 78.95M | 78.67M | 64.81M |
| Net tangible assets | - | - | - | 70.60M | 63.44M |
| Short term investments | 0.76M | - | - | - | - |
| Net receivables | 40.12M | 29.37M | 34.08M | 35.60M | 28.31M |
| Long term debt | 37.07M | 22.56M | 28.16M | 18.73M | 10.90M |
| Inventory | 40.79M | 30.63M | 37.58M | 37.07M | 28.15M |
| Accounts payable | 28.54M | 5.58M | 21.16M | 22.77M | 19.32M |
| Accumulated other comprehensive income | 5.39M | 5.24M | - | - | - |
| Non currrent assets other | -4.33M | -4.68M | - | - | 50.84M |
| Non current assets total | 116.03M | 98.15M | 113.66M | 97.42M | 95.89M |
| Capital lease obligations | 13.99M | 9.86M | 10.84M | 6.27M | 6.63M |
| Breakdown | 2025-09-30 | 2024-09-30 | 2023-09-30 | 2022-09-30 | 2021-09-30 |
|---|---|---|---|---|---|
| Type | yearly | yearly | yearly | yearly | yearly |
| Date | 2025-09-30 | 2024-09-30 | 2023-09-30 | 2022-09-30 | 2021-09-30 |
| Investments | - | -3.89M | -18.49M | -9.29M | -9.96M |
| Change to liabilities | - | - | - | 1.22M | 1.25M |
| Total cashflows from investing activities | -16.03M | -3.89M | - | -9.29M | -9.96M |
| Net borrowings | 15.19M | -3.31M | - | 3.40M | -16.14M |
| Total cash from financing activities | 9.84M | -10.89M | 4.19M | 0.30M | -17.27M |
| Net income | 3.54M | -5.67M | 5.02M | -2.27M | 4.68M |
| Change in cash | 0.58M | -0.67M | 1.29M | -2.35M | -11.38M |
| Begin period cash flow | 6.62M | 7.29M | 6.00M | 8.35M | 19.73M |
| End period cash flow | 7.20M | 6.62M | 7.29M | 6.00M | 8.35M |
| Total cash from operating activities | 6.84M | 14.19M | 16.17M | 6.54M | 16.25M |
| Depreciation | 12.17M | 11.49M | 11.02M | 10.44M | 10.39M |
| Other cashflows from investing activities | - | -1.68M | - | -0.72M | -0.50M |
| Dividends paid | 3.47M | 3.38M | 3.18M | 3.10M | 1.13M |
| Change to inventory | -7.62M | 0.26M | -1.29M | -5.56M | 1.89M |
| Change to account receivables | -8.96M | 0.86M | - | -5.71M | -2.65M |
| Other cashflows from financing activities | -1.88M | -4.20M | 15.75M | 4.72M | -2.05M |
| Change to netincome | - | - | - | 8.15M | 1.97M |
| Capital expenditures | 4.57M | 5.24M | 7.32M | 8.57M | 6.24M |
| Change in working capital | -8.49M | -3.59M | -2.02M | -10.05M | 0.48M |
| Stock based compensation | 1.02M | 0.71M | 0.34M | 0.74M | 0.73M |
| Other non cash items | -0.38M | 11.24M | 1.57M | 7.67M | 0.44M |
| Free cash flow | 2.28M | 8.94M | 8.85M | -2.03M | 10.00M |
Sector: Technology Industry: Electronic Components
|
Stock Name
|
Change
(GBX) |
Price
(GBX) |
Trailing
PE (x) |
Forward
PE (x) |
Price Sales
TTM (x) |
Price to Book Value (x)
|
Enterprise Value
to Revenue (x) |
Enterprise Value
to EBITDA (x) |
|---|---|---|---|---|---|---|---|---|
| RPI Raspberry Pi Holdings PLC |
23.50 4.41% |
556.50 | 157.30 | 56.50 | 2.83 | 5.74 | 4.89 | 46.10 |
| DSCV Discoverie Group PLC |
23.00 2.84% |
832.00 | 21.62 | 13.12 | 1.27 | 1.72 | 1.54 | 8.68 |
| TTG TT Electronics Plc |
4.20 2.26% |
190.20 | - | 8.81 | 0.44 | 1.45 | 0.58 | 12.21 |
| SOLI Solid State Plc |
- -% |
170.00 | 40.00 | 13.70 | 0.61 | 1.26 | 0.61 | 9.60 |
Gooch & Housego PLC engages in the manufacture and sale of acousto-optics, electro-optics, fiber optics, and precision optics and systems in the United Kingdom, North America, Europe, the Asia Pacific, and internationally. The company operates through A&D, Life Sciences, and Industrial segments. It offers acousto-optic products, such as acoustic-optic modulators, deflectors, frequency shifters, mode lockers, pulse pickers, Q-switches, tunable filters, and RF drivers; crystal optics, including crystals and nonlinear optics, lithium niobate wafers, and periodically-poled lithium niobite; and electro-optics, such as pockels cells, lithium niobate Q-switches, and pockels cell drivers. The company also provides fiber optics, such as fiber-coupled acousto-optic modulators, high power combiners, PM and SM couplers, polarization diverse receivers, ruggedized and wideband couplers, and variable optical delay line; precision optics, including beam splitters, corner cubes, optical domes, optical windows and flats, polymer optics, precision lenses, precision mirrors, precision prisms, ring laser gyroscope components, synchrotron mirrors, waveplates, optical bindings, magnetorheological finishing, optical coatings, single point diamond turning, and super polishing; lens systems; and vision systems for armored fighting vehicles, including embedded image periscope and sighting systems, enhanced drivers vision system, saber commander/gunner sights, spares and repairs, specter camera modules, and unity vision periscopes; and medical devices, in-vitro diagnostics, and laboratory instruments. Its products are used in semiconductor and microelectronic, metrology, telecommunications, remote sensing, and scientific research industries. The company serves aerospace and defense, industrial and telecom, life sciences markets. Gooch & Housego PLC was founded in 1948 and is headquartered in Ilminster, the United Kingdom.
| Name | Title | Year Born |
|---|---|---|
| Mr. Chris Jewell | CFO & Exec. Director | 1965 |
| Mr. Charles St. John Stewart Peppiatt | CEO & Director | 1970 |
| Mr. Jon Fowler | Exec. VP of Commercial Devel. | NA |
| Mr. Gareth J. Crowe | Group Financial Controller & Company Sec. | NA |
| Mr. Gareth James Crowe | Company Secretary, Acting CFO & Director | NA |
| Andy Back | Group Global Head of Quality & Compliance | NA |
| Ms. Melinda Chudleigh | Chief People Officer | NA |
| Dr. Efstratios Kehayas BEng, DIC, MSc, Ph.D. | President of Photonics Division | NA |
| Mr. Bryan Bothwell | Executive Vice President of Life Sciences | NA |
| Mr. Jamie Pindard | Executive Vice President of Optical Systems | NA |
Disclaimer - (*)This information, including any data, is sourced from Unicorn Data Services SAS, trading as EOD Historical Data (“EODHD”) on an ‘as is’ basis, using their API. We cannot guarantee the completeness or validity of the information and data provided on this page, as well as via the API. In some cases, the data may include analyst ratings or recommendations sourced through the EODHD API, which are intended solely for general information purposes.
This information does not consider your personal objectives, financial situation, or needs. Kalkine is not liable for any errors or omissions in the information provided or for any actions taken in reliance on it. You should seek advice from a financial adviser, stockbroker or other professional adviser (including taxation and legal advice) as necessary before acting on this information.

Download a free report with stock ideas and industry insights for general information.
Download Free Report Now →


Basic Materials
 -1.10%
Communication Services
-0.42%

Consumer Cyclical
-0.41%

Consumer Defensive
-0.22%

Energy
-0.09%

Financial Services
-0.14%
Financials
-0.48%

Healthcare
-0.20%

Industrials
-0.11%

Real Estate
-0.53%

Technology
-0.23%

Utilities
-0.53%
Note: Daily price change (%) by sector excluding stocks with +/-90% daily price change. Companies above $500 million market capitalization are considered.
 Portfolio
 Watchlist


 +1.15%
 Please wait processing your request...