 CA
 NZ
 UK
 AU
 IND

 US


…
Newterra Resources Inc. engages in the acquisition, exploration, and developing of mineral properties in Canada. It primarily explores for gold, silver, copper, zinc, molybdenum, cobalt, and bismuth prospects. It holds an option to acquire a 100% interest in the Ironhorse property that consists of nine mineral claims in the Okanagan Valley in the Similkameen and Osoyoos mining divisions, British Columbia. It has an option to acquire a 100% interest in the Ferdinand Gold property located within the Red Lake Mining District in the Province of Ontario, Canada; and options to acquire 100% interest in the Wilans Gold Property, which includes mineral claims totaling over 5,700 hectares located in the Red Lake Mining District, Ontario, Canada. Newterra Resources Inc. was incorporated in 2021 and is headquartered in Langley, Canada.
Source: TradingView
The charts and visual representations are sourced from TradingView through embedded widgets. For any issues with chart display, please visit the TradingView website
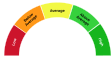
A unique technical analysis driven score developed by Kalkine showing momentum in stock prices based on select technical indicators identified.
Public disclosure on Newterra Resources Inc (ticker NT.CN) is limited, and available sources do not provide a comprehensive description of the company's operations or assets. Investors should review the company's regulatory filings for details on any holdings, development plans and financing needs; potential upside depends on future asset results, successful financing or strategic partnerships.
Key risks include illiquid trading, financing and execution risk typical of small-cap issuers, uncertain asset quality and development timelines, and regulatory or permitting obstacles that could prevent value realization.

Note: The summary and risk score provided above is created by AI and should not be construed as a recommendation of Kalkine.


| Breakdown | 2025-07-31 | 2024-07-31 | 2023-07-31 | 2022-07-31 |
|---|---|---|---|---|
| Type | yearly | yearly | yearly | yearly |
| Date | 2025-07-31 | 2024-07-31 | 2023-07-31 | 2022-07-31 |
| Income before tax | -0.07M | -0.25M | -0.21M | -0.05M |
| Net income | -0.07M | -0.25M | -0.20M | -0.06M |
| Selling general administrative | 0.04M | 0.18M | 0.19M | 0.04M |
| Operating income | -0.07M | -0.25M | -0.21M | -0.04M |
| Interest expense | - | - | 0.00M | 0.01M |
| Tax provision | - | 0.00M | -0.01M | 0.01M |
| Net interest income | - | - | 0.00M | -0.01M |
| Total revenue | 0.00M | 0.00M | 0.00M | 0.00M |
| Total operating expenses | 0.07M | 0.25M | 0.21M | 0.04M |
| Total other income expense net | - | - | -0.02M | - |
| Net income from continuing ops | -0.07M | -0.25M | -0.20M | -0.06M |
| Breakdown | 2025-07-31 | 2024-07-31 | 2023-07-31 | 2022-07-31 | 2021-07-31 |
|---|---|---|---|---|---|
| Type | yearly | yearly | yearly | yearly | yearly |
| Date | 2025-07-31 | 2024-07-31 | 2023-07-31 | 2022-07-31 | 2021-07-31 |
| Total assets | 0.21M | 0.27M | 0.22M | 0.14M | 0.05M |
| Total liab | 0.05M | 0.04M | 0.13M | 0.10M | 0.00M |
| Total stockholder equity | 0.17M | 0.23M | 0.08M | 0.04M | 0.05M |
| Capital stock | 0.67M | 0.67M | 0.31M | 0.11M | 0.11M |
| Retained earnings | -0.57M | -0.51M | -0.26M | -0.06M | -0.00M |
| Cash | 0.02M | 0.05M | 0.05M | 0.00M | 0.00M |
| Total current liabilities | 0.05M | 0.04M | 0.13M | 0.10M | 0.00M |
| Total current assets | 0.05M | 0.10M | 0.06M | 0.01M | 0.03M |
| Accounts payable | 0.00M | 0.00M | 0.11M | 0.07M | 0.00M |
| Non current assets total | 0.17M | 0.18M | 0.15M | 0.14M | 0.03M |
| Breakdown | 2025-07-31 | 2024-07-31 | 2023-07-31 | 2022-07-31 |
|---|---|---|---|---|
| Type | yearly | yearly | yearly | yearly |
| Date | 2025-07-31 | 2024-07-31 | 2023-07-31 | 2022-07-31 |
| Total cash from financing activities | 0.00M | 0.38M | 0.20M | 0.05M |
| Net income | -0.07M | -0.25M | -0.20M | -0.06M |
| Change in cash | -0.03M | 0.00M | 0.05M | -0.00M |
| Begin period cash flow | 0.05M | 0.05M | 0.00M | 0.00M |
| End period cash flow | 0.02M | 0.05M | 0.05M | 0.00M |
| Total cash from operating activities | -0.05M | -0.35M | -0.14M | 0.06M |
| Issuance of capital stock | 0.00M | 0.43M | 0.23M | 0.00M |
| Capital expenditures | 0.00M | 0.03M | 0.02M | 0.11M |
| Change in working capital | 0.02M | -0.11M | 0.03M | 0.11M |
| Stock based compensation | - | 0.00M | 0.04M | 0.00M |
| Other non cash items | - | 0.01M | - | - |
| Free cash flow | -0.05M | -0.38M | -0.16M | -0.05M |
Sector: Basic Materials Industry: Other Industrial Metals & Mining
|
Stock Name
|
Change
(CAD) |
Price
(CAD) |
Trailing
PE (x) |
Forward
PE (x) |
Price Sales
TTM (x) |
Price to Book Value (x)
|
|---|---|---|---|---|---|---|
| NT Newterra Resources Inc |
0.03 25.00% |
0.15 | - | - | - | 22.62 |
| CACR-A KWG Resources Inc. |
0.03 7.89% |
0.41 | - | - | - | 9.82 |
| ACM Allied Critical Metals Inc. |
0.13 13.00% |
1.13 | - | - | - | 14.87 |
| MAXX Max Power Mining Corp |
-0.14 6.39% |
2.05 | - | - | - | 26.86 |
| PHOS First Phosphate Corp. |
-0.01 0.58% |
1.71 | - | - | - | 7.88 |
Newterra Resources Inc. engages in the acquisition, exploration, and developing of mineral properties in Canada. It primarily explores for gold, silver, copper, zinc, molybdenum, cobalt, and bismuth prospects. It holds an option to acquire a 100% interest in the Ironhorse property that consists of nine mineral claims in the Okanagan Valley in the Similkameen and Osoyoos mining divisions, British Columbia. It has an option to acquire a 100% interest in the Ferdinand Gold property located within the Red Lake Mining District in the Province of Ontario, Canada; and options to acquire 100% interest in the Wilans Gold Property, which includes mineral claims totaling over 5,700 hectares located in the Red Lake Mining District, Ontario, Canada. Newterra Resources Inc. was incorporated in 2021 and is headquartered in Langley, Canada.
| Name | Title | Year Born |
|---|---|---|
| Mr. Darren R. Blaney | CEO, President & Director | 1967 |
| Mr. Robert Nathan Edwards CPA, CGA | CFO, Corporate Secretary & Director | 1975 |
| Mr. Robert Nathan Edwards CPA, CGA | CFO, Corporate Secretary & Director | 1976 |
Disclaimer - (*)This information, including any data, is sourced from Unicorn Data Services SAS, trading as EOD Historical Data (“EODHD”) on an ‘as is’ basis, using their API. We cannot guarantee the completeness or validity of the information and data provided on this page, as well as via the API. In some cases, the data may include analyst ratings or recommendations sourced through the EODHD API, which are intended solely for general information purposes.
This information does not consider your personal objectives, financial situation, or needs. Kalkine is not liable for any errors or omissions in the information provided or for any actions taken in reliance on it. You should seek advice from a financial adviser, stockbroker or other professional adviser (including taxation and legal advice) as necessary before acting on this information.

Download a free report with stock ideas and industry insights for general information.
Download Free Report Now →


Basic Materials
 -1.40%
Communication Services
-0.45%

Consumer Cyclical
-0.55%

Consumer Defensive
-0.01%

Energy
-0.01%

Financial Services
-0.40%
Financials
-0.15%

Healthcare
-1.15%

Industrials
-0.46%

Real Estate
-0.29%

Technology
-1.22%

Utilities
-0.10%
Note: Daily price change (%) by sector excluding stocks with +/-90% daily price change. Companies above $500 million market capitalization are considered.
 Portfolio
 Watchlist


 +0.55%
 Please wait processing your request...