 CA
 NZ
 UK
 AU
 IND

 US


…
Ceryvyn Therapeutics Limited, a clinical-stage biopharmaceutical company, researches and develops therapeutic products based on targeting vascular endothelial growth factors (VEGF) C, D and R3 in Australia and the United States. The company's pipeline includes Sozinibercept, which is in phase 3 to treat wet age-related macular degeneration (Wet AMD), as well as in phase 2 to treat diabetic macular edema (DME). It serves the biotechnology and healthcare industries. The company was formerly known as Opthea Limited and changed its name to Ceryvyn Therapeutics Limited in July 2026. Ceryvyn Therapeutics Limited was incorporated in 1984 and is headquartered in Melbourne, Australia.
Source: TradingView
The charts and visual representations are sourced from TradingView through embedded widgets. For any issues with chart display, please visit the TradingView website
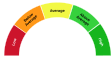
A unique technical analysis driven score developed by Kalkine showing momentum in stock prices based on select technical indicators identified.
Opthea Ltd is an Australian clinical-stage biopharmaceutical company developing therapies for retinal vascular diseases; its lead candidate OPT-302 is a VEGF-C/D inhibitor intended to be used with existing anti-VEGF-A agents. Long-term growth drivers include unmet need for improved and longer-lasting treatments for wet age-related macular degeneration and diabetic eye disease, potential regulatory approvals, and commercial adoption if clinical trials confirm additive benefit.
Investors should monitor clinical and regulatory outcomes, competitive pressure from established and emerging anti-VEGF and longer-acting therapies, and financing and dilution risk given the company's pre-revenue clinical-stage status.

Note: The summary and risk score provided above is created by AI and should not be construed as a recommendation of Kalkine.


| Breakdown | 2026-06-30 | 2025-06-30 | 2024-06-30 | 2023-06-30 | 2022-06-30 |
|---|---|---|---|---|---|
| Type | yearly | yearly | yearly | yearly | yearly |
| Date | 2026-06-30 | 2025-06-30 | 2024-06-30 | 2023-06-30 | 2022-06-30 |
| Income before tax | 330.24M | -169.74M | -229.65M | -148.45M | -99.12M |
| Net income | 330.44M | -162.79M | -220.24M | -142.52M | -92.82M |
| Selling general administrative | 8.04M | 20.54M | 15.49M | 27.84M | 17.83M |
| Gross profit | - | 0.03M | 0.12M | 0.11M | 0.09M |
| Reconciled depreciation | 0.00M | 0.09M | 0.10M | 0.10M | 0.08M |
| Ebit | - | -123.28M | -199.39M | -146.80M | -93.72M |
| Ebitda | - | -123.19M | -199.29M | -146.70M | -93.65M |
| Depreciation and amortization | - | 0.09M | 0.10M | 0.10M | 0.08M |
| Operating income | -11.95M | -155.76M | -191.84M | -146.80M | -93.72M |
| Other operating expenses | - | 155.79M | 191.97M | 150.13M | 96.63M |
| Interest expense | 11.06M | 46.46M | 30.26M | 13.46M | 0.24M |
| Tax provision | -0.21M | -6.95M | -9.41M | -5.93M | -6.30M |
| Interest income | 1.04M | 5.53M | 3.39M | 1.58M | 0.24M |
| Net interest income | -10.02M | -40.92M | -26.87M | -10.23M | 0.24M |
| Income tax expense | - | -6.95M | -9.41M | -5.93M | -6.30M |
| Total revenue | 0.00M | 0.03M | 0.12M | 0.11M | 0.09M |
| Total operating expenses | 11.95M | 155.79M | 191.97M | 150.13M | 96.63M |
| Cost of revenue | - | - | - | 0.17M | 0.16M |
| Total other income expense net | 352.20M | -13.98M | -37.81M | 11.81M | -5.39M |
| Net income from continuing ops | 330.44M | -162.79M | -220.24M | -142.52M | -92.82M |
| Net income applicable to common shares | - | -162.79M | -220.24M | -142.52M | -92.82M |
| Breakdown | 2026-06-30 | 2025-06-30 | 2024-06-30 | 2023-06-30 | 2022-06-30 |
|---|---|---|---|---|---|
| Type | yearly | yearly | yearly | yearly | yearly |
| Date | 2026-06-30 | 2025-06-30 | 2024-06-30 | 2023-06-30 | 2022-06-30 |
| Total assets | 31.93M | 56.80M | 188.79M | 98.64M | 60.05M |
| Other current assets | - | - | - | - | 8.72M |
| Total liab | 2.32M | 257.87M | 264.60M | 104.40M | 12.07M |
| Total stockholder equity | 29.61M | -201.07M | -75.81M | -5.76M | 47.98M |
| Other current liab | - | 246.99M | 24.84M | 0.75M | 0.64M |
| Common stock | - | - | 466.08M | 320.88M | 235.28M |
| Capital stock | 732.47M | 497.49M | 466.08M | 320.88M | 235.28M |
| Retained earnings | -759.61M | -742.50M | -579.70M | -359.37M | -216.94M |
| Other liab | - | - | - | 0.01M | 0.03M |
| Other assets | - | - | - | 0.05M | 0.11M |
| Cash | 30.02M | 48.44M | 172.47M | 89.19M | 44.63M |
| Cash and equivalents | - | - | - | 77.12M | 32.78M |
| Total current liabilities | 2.32M | 257.87M | 64.06M | 18.65M | 12.04M |
| Current deferred revenue | - | - | 1.06M | - | - |
| Net debt | - | - | -30.82M | -89.01M | -44.63M |
| Short term debt | - | - | 0.09M | 0.10M | 0.00M |
| Short long term debt total | - | - | 141.65M | 0.18M | - |
| Other stockholder equity | - | - | - | 20.09M | 29.64M |
| Property plant equipment | - | - | - | 0.20M | 0.03M |
| Total current assets | 31.93M | 56.80M | 188.19M | 98.39M | 59.91M |
| Net tangible assets | - | - | - | -5.85M | 47.98M |
| Net receivables | - | - | 11.82M | 6.56M | 6.56M |
| Long term debt | - | - | 141.55M | 85.66M | - |
| Accounts payable | 2.32M | 9.74M | 38.06M | 17.80M | 11.40M |
| Accumulated other comprehensive income | - | - | 37.81M | 32.73M | 29.64M |
| Non currrent assets other | - | - | 0.47M | 0.05M | 0.11M |
| Non current assets total | 0.00M | 0.00M | 0.60M | 0.26M | 0.14M |
| Capital lease obligations | - | 0.00M | 0.09M | 0.18M | 0.00M |
| Long term debt total | - | - | - | 85.74M | 0.00M |
| Breakdown | 2026-06-30 | 2025-06-30 | 2024-06-30 | 2023-06-30 | 2022-06-30 |
|---|---|---|---|---|---|
| Type | yearly | yearly | yearly | yearly | yearly |
| Date | 2026-06-30 | 2025-06-30 | 2024-06-30 | 2023-06-30 | 2022-06-30 |
| Investments | - | -0.01M | -0.03M | -0.02M | -0.02M |
| Change to liabilities | - | - | - | 7.30M | 8.51M |
| Total cashflows from investing activities | - | -0.01M | -0.03M | -0.02M | -0.02M |
| Net borrowings | 0.00M | -0.09M | -0.09M | 84.43M | -0.09M |
| Total cash from financing activities | -30.89M | 34.77M | 243.73M | 248.70M | 0.24M |
| Change to operating activities | - | - | - | 6.28M | 5.85M |
| Net income | 330.44M | -162.79M | -220.24M | -211.88M | -127.99M |
| Change in cash | -43.38M | -124.03M | 83.28M | 69.08M | -92.53M |
| Begin period cash flow | 73.94M | 172.47M | 89.19M | 64.90M | 157.43M |
| End period cash flow | 30.02M | 48.44M | 172.47M | 133.99M | 64.90M |
| Total cash from operating activities | - | -158.64M | -161.02M | -179.30M | -98.37M |
| Issuance of capital stock | 0.00M | 34.81M | 158.82M | 81.82M | 0.00M |
| Depreciation | - | - | 0.10M | 0.15M | 0.11M |
| Other cashflows from investing activities | - | - | - | - | 0.00M |
| Change to account receivables | - | - | -0.79M | 0.56M | 0.42M |
| Sale purchase of stock | - | 34.86M | 243.82M | 167.36M | 0.26M |
| Other cashflows from financing activities | - | 0.05M | 85.00M | -0.03M | -0.03M |
| Change to netincome | - | - | - | 7.86M | 6.74M |
| Capital expenditures | 0.00M | 0.01M | 0.03M | 0.03M | 0.02M |
| Change in working capital | - | 5.92M | 17.30M | 20.75M | 20.22M |
| Stock based compensation | - | - | 5.08M | 5.83M | 5.25M |
| Other non cash items | - | -158.64M | 46.15M | 11.77M | 10.34M |
| Free cash flow | -12.50M | -158.66M | -161.05M | -179.34M | -98.39M |
Sector: Healthcare Industry: Biotechnology
|
Stock Name
|
Change
(AUD) |
Price
(AUD) |
Trailing
PE (x) |
Forward
PE (x) |
Price Sales
TTM (x) |
Price to Book Value (x)
|
Enterprise Value
to Revenue (x) |
Enterprise Value
to EBITDA (x) |
|---|---|---|---|---|---|---|---|---|
| CSL CSL Ltd |
0.95 0.47% |
201.68 | - | 22.57 | 6.15 | 4.48 | 4.82 | 10.06 |
| TLX TELIX Pharmaceuticals Ltd |
0.22 1.59% |
14.02 | 93.87 | 166.67 | 5.37 | 6.37 | 3.85 | 47.29 |
| NEU Neuren Pharmaceuticals Ltd |
-0.24 0.99% |
23.96 | 154.93 | 36.36 | 42.38 | 7.52 | 31.95 | 160.40 |
| MSB Mesoblast Ltd |
-0.05 2.40% |
2.03 | - | 454.55 | 23.43 | 3.36 | 18.28 | -9.86 |
Ceryvyn Therapeutics Limited, a clinical-stage biopharmaceutical company, researches and develops therapeutic products based on targeting vascular endothelial growth factors (VEGF) C, D and R3 in Australia and the United States. The company's pipeline includes Sozinibercept, which is in phase 3 to treat wet age-related macular degeneration (Wet AMD), as well as in phase 2 to treat diabetic macular edema (DME). It serves the biotechnology and healthcare industries. The company was formerly known as Opthea Limited and changed its name to Ceryvyn Therapeutics Limited in July 2026. Ceryvyn Therapeutics Limited was incorporated in 1984 and is headquartered in Melbourne, Australia.
| Name | Title | Year Born |
|---|---|---|
| Dr. Megan Baldwin M.A.I.C.D., MAICD, Ph.D. | MD, CEO & Exec. Director | 1974 |
| Ms. Judith J. Robertson B.A., M.B.A. | Chief Commercial Officer | 1960 |
| Dr. Joel Naor M.D., MBA, MSc | Chief Medical Officer | NA |
| Ms. Karen Adams CPA | VP of Fin. & Company Sec. | 1971 |
| Mr. Timothy E. Morris CPA, CPA | Chief Financial Officer | 1961 |
| Ms. Annie Lee | Fin. & Operations Mang. | NA |
| Dr. Michael Gerometta Ph.D. | Head of Chemistry, Manufacturing & Controls Devel. | 1964 |
| Mr. Bruno Gagnon BPHARM, M.Sc. | Sr. VP of Global Clinical Operations | NA |
| Dr. Ian Leitch | Director of Clinical Research | 1963 |
| Dr. James Goding | Independent Consultant | NA |
Disclaimer - (*)This information, including any data, is sourced from Unicorn Data Services SAS, trading as EOD Historical Data (“EODHD”) on an ‘as is’ basis, using their API. We cannot guarantee the completeness or validity of the information and data provided on this page, as well as via the API. In some cases, the data may include analyst ratings or recommendations sourced through the EODHD API, which are intended solely for general information purposes.
This information does not consider your personal objectives, financial situation, or needs. Kalkine is not liable for any errors or omissions in the information provided or for any actions taken in reliance on it. You should seek advice from a financial adviser, stockbroker or other professional adviser (including taxation and legal advice) as necessary before acting on this information.

Download a free report with stock ideas and industry insights for general information.
Download Free Report Now →


Basic Materials
 -1.26%
Communication Services
-0.18%

Consumer Cyclical
-0.36%

Consumer Defensive
 +0.07%

Energy
-0.01%

Financial Services
-0.26%
Financials
-2.20%

Healthcare
-0.55%

Industrials
-0.08%

Real Estate
-0.33%

Technology
-0.70%

Utilities
-0.41%
Note: Daily price change (%) by sector excluding stocks with +/-90% daily price change. Companies above $500 million market capitalization are considered.
 Portfolio
 Watchlist


 Please wait processing your request...