 CA
 NZ
 UK
 AU
 IND

 US


…
Austin Engineering Limited, together with its subsidiaries, manufactures, repairs, overhauls, and supplies mining attachment products, and other related products and services for the industrial and resources-related business sectors. The company offers buckets, such as backhoe, wheel loader, hydraulic loading shovels, rope shovel dipper, and underground LHD; and dump bodies, underground dump bodies, tyre handlers, ancillary products, and water tanks, which are used in the mining industry. It also provides on and off-site repair and maintenance services, including specialized site machining, specialized fabrication and welding, specialized machining, on-site machining of ball and crusher mill tyre, metal spraying, NDT testing, service and exchange parts, and heavy equipment reclamation services, as well as manufacturing and supply of pins and bushes. It operates in Australia, Chile, the United States, Canada, Indonesia, and internationally. The company was founded in 1982 and is headquartered in Kewdale, Australia.
Source: TradingView
The charts and visual representations are sourced from TradingView through embedded widgets. For any issues with chart display, please visit the TradingView website
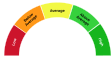
A unique technical analysis driven score developed by Kalkine showing momentum in stock prices based on select technical indicators identified.
Austin Engineering Ltd designs, fabricates and services heavy steel components for surface mining equipment, including dump truck bodies, buckets and wear parts, with aftermarket repair capabilities. Long-term growth may come from mining investment cycles, replacement demand for wear-intensive assets and expansion into major mining regions. Its engineering focus and recurring aftermarket revenue could appeal to investors seeking exposure to mining services rather than commodity producers.
Major risks are sensitivity to mining capital expenditure and commodity cycles, competitive and pricing pressure from OEMs and local fabricators, execution risk on large contracts and foreign‑exchange exposure.

Note: The summary and risk score provided above is created by AI and should not be construed as a recommendation of Kalkine.


| Breakdown | 2026-06-30 | 2025-06-30 | 2024-06-30 | 2023-06-30 | 2022-06-30 |
|---|---|---|---|---|---|
| Type | yearly | yearly | yearly | yearly | yearly |
| Date | 2026-06-30 | 2025-06-30 | 2024-06-30 | 2023-06-30 | 2022-06-30 |
| Income before tax | 8.12M | 29.56M | 36.41M | 9.36M | 26.34M |
| Net income | 6.09M | 25.99M | 26.08M | 2.85M | 16.81M |
| Selling general administrative | - | 87.84M | 82.36M | 72.73M | 57.23M |
| Selling and marketing expenses | - | - | 62.16M | - | - |
| Gross profit | 29.20M | 250.46M | 190.50M | 166.60M | 140.56M |
| Reconciled depreciation | - | 9.87M | 9.13M | 7.91M | 5.05M |
| Ebit | 10.84M | 31.80M | 38.61M | 15.74M | 25.88M |
| Ebitda | 20.50M | 41.66M | 47.74M | 23.65M | 30.92M |
| Depreciation and amortization | 9.65M | 9.87M | 9.13M | 7.91M | 5.05M |
| Operating income | 10.84M | 33.15M | 38.85M | 11.87M | 20.49M |
| Other operating expenses | 318.12M | 345.80M | 252.50M | 39.64M | 35.25M |
| Interest expense | 1.54M | 2.24M | 2.20M | 3.04M | 1.06M |
| Tax provision | - | 3.23M | 6.71M | 2.24M | 5.74M |
| Interest income | - | 3.72M | 1.07M | 5.79M | 0.42M |
| Net interest income | - | -2.24M | -2.20M | -3.04M | -0.64M |
| Extraordinary items | - | -0.34M | -3.61M | -4.27M | -3.80M |
| Income tax expense | 1.67M | 3.23M | 6.71M | 2.24M | 5.74M |
| Total revenue | 328.96M | 378.94M | 313.24M | 258.30M | 202.93M |
| Total operating expenses | 18.36M | 217.32M | 156.02M | 154.74M | 115.10M |
| Cost of revenue | 299.76M | 128.48M | 122.74M | 91.69M | 62.37M |
| Total other income expense net | -2.72M | -3.58M | -2.44M | 0.53M | 1.53M |
| Discontinued operations | - | - | - | -4.27M | -3.80M |
| Net income from continuing ops | - | 26.33M | 29.69M | 7.12M | 20.61M |
| Net income applicable to common shares | - | 25.99M | 26.08M | 2.85M | 16.81M |
| Breakdown | 2026-06-30 | 2025-06-30 | 2024-06-30 | 2023-06-30 | 2022-06-30 |
|---|---|---|---|---|---|
| Type | yearly | yearly | yearly | yearly | yearly |
| Date | 2026-06-30 | 2025-06-30 | 2024-06-30 | 2023-06-30 | 2022-06-30 |
| Total assets | 251.34M | 303.33M | 293.00M | 260.87M | 214.14M |
| Intangible assets | 6.94M | 7.69M | 8.03M | 8.18M | 5.09M |
| Other current assets | 5.77M | 11.82M | 9.07M | 10.21M | 9.85M |
| Total liab | 117.70M | 159.31M | 162.66M | 146.67M | 106.82M |
| Total stockholder equity | 133.64M | 144.02M | 130.34M | 114.20M | 107.32M |
| Other current liab | 25.56M | 23.58M | 38.44M | 6.05M | 63.84M |
| Common stock | 161.31M | - | 155.95M | 155.05M | 154.47M |
| Capital stock | - | 156.52M | 155.95M | 155.05M | 154.47M |
| Retained earnings | 21.69M | 22.50M | -9.22M | -32.96M | -34.06M |
| Other liab | - | - | - | 1.38M | 0.77M |
| Good will | 17.81M | 17.98M | 17.92M | 17.93M | 6.50M |
| Other assets | - | - | - | 20.36M | 22.08M |
| Cash | 17.07M | 20.06M | 40.19M | 20.17M | 20.78M |
| Cash and equivalents | - | - | - | 20.17M | 20.78M |
| Total current liabilities | 104.96M | 123.84M | 150.66M | 128.08M | 94.80M |
| Current deferred revenue | 20.57M | - | 22.36M | 42.63M | -25.00M |
| Net debt | 20.93M | 12.79M | 5.83M | 35.28M | 15.48M |
| Short term debt | 27.58M | - | 37.86M | 38.24M | 25.00M |
| Short long term debt | - | 16.52M | 33.14M | 33.14M | 22.00M |
| Short long term debt total | 38.01M | - | 46.02M | 55.44M | 36.26M |
| Other stockholder equity | - | - | - | -122.10M | -120.41M |
| Property plant equipment | - | - | - | 58.65M | 49.25M |
| Total current assets | 146.70M | 192.35M | 185.36M | 155.74M | 131.22M |
| Net tangible assets | - | - | - | 88.08M | 95.73M |
| Net receivables | 68.17M | 63.10M | 65.71M | 47.33M | 54.53M |
| Long term debt | - | 16.33M | 0.92M | 7.95M | 0.00M |
| Inventory | 55.69M | 87.92M | 70.38M | 68.75M | 40.36M |
| Accounts payable | 31.25M | 46.34M | 51.99M | 41.16M | 30.96M |
| Accumulated other comprehensive income | -49.36M | - | -16.39M | -7.90M | -13.09M |
| Non currrent assets other | - | 8.56M | 0.20M | 14.46M | 10.89M |
| Non current assets total | 104.64M | 110.98M | 107.64M | 105.13M | 82.92M |
| Capital lease obligations | - | 19.41M | 11.96M | 14.35M | 14.26M |
| Long term debt total | - | - | - | 17.21M | 11.26M |
| Breakdown | 2026-06-30 | 2025-06-30 | 2024-06-30 | 2023-06-30 | 2022-06-30 |
|---|---|---|---|---|---|
| Type | yearly | yearly | yearly | yearly | yearly |
| Date | 2026-06-30 | 2025-06-30 | 2024-06-30 | 2023-06-30 | 2022-06-30 |
| Investments | - | -12.62M | -8.37M | -20.93M | 8.72M |
| Change to liabilities | - | - | - | -0.50M | 13.94M |
| Total cashflows from investing activities | -6.40M | -12.62M | -8.37M | -20.93M | 8.72M |
| Net borrowings | - | 2.23M | -3.66M | 7.07M | 0.07M |
| Total cash from financing activities | -22.61M | -10.96M | -7.24M | 5.36M | -2.66M |
| Change to operating activities | - | - | - | -3.08M | -7.12M |
| Net income | 6.45M | 25.99M | 26.08M | 2.85M | 16.81M |
| Change in cash | -2.99M | -20.13M | 20.03M | -0.61M | 10.96M |
| Begin period cash flow | 20.06M | 40.19M | 20.17M | 20.78M | 9.82M |
| End period cash flow | 17.07M | 20.06M | 40.19M | 20.17M | 20.78M |
| Total cash from operating activities | 26.68M | 2.59M | 35.50M | 15.78M | 4.74M |
| Depreciation | 9.65M | - | 9.13M | 7.64M | 4.75M |
| Other cashflows from investing activities | 0.37M | -0.43M | -0.91M | -9.91M | 12.91M |
| Dividends paid | 7.06M | -8.18M | -2.27M | 1.71M | 2.73M |
| Change to inventory | 24.32M | -14.44M | -6.86M | -22.31M | -11.50M |
| Change to account receivables | 3.16M | -11.45M | -21.79M | 14.53M | -14.82M |
| Sale purchase of stock | -1.24M | - | - | - | - |
| Other cashflows from financing activities | -4.21M | -5.01M | -1.30M | 11.72M | 33.13M |
| Change to netincome | - | - | - | 11.22M | 0.31M |
| Capital expenditures | 6.77M | 9.53M | 5.49M | 11.02M | 4.19M |
| Change in working capital | 10.51M | -37.48M | -1.82M | -7.78M | -26.32M |
| Stock based compensation | - | - | 1.24M | 1.54M | 1.64M |
| Other non cash items | 0.06M | 40.06M | 0.87M | 5.29M | -16.82M |
| Free cash flow | 19.91M | -6.94M | 30.01M | 4.76M | 0.55M |
Sector: Industrials Industry: Farm & Heavy Construction Machinery
|
Stock Name
|
Change
(AUD) |
Price
(AUD) |
Trailing
PE (x) |
Forward
PE (x) |
Price Sales
TTM (x) |
Price to Book Value (x)
|
Enterprise Value
to Revenue (x) |
Enterprise Value
to EBITDA (x) |
|---|---|---|---|---|---|---|---|---|
| ANG Austin Engineering Ltd |
- -% |
0.19 | 18.50 | 3.06 | 0.35 | 0.84 | 0.40 | 6.89 |
| IMD IMDEX Ltd |
0.08 2.50% |
3.28 | 22.93 | 20.88 | 3.44 | 2.43 | 3.67 | 9.77 |
Austin Engineering Limited, together with its subsidiaries, manufactures, repairs, overhauls, and supplies mining attachment products, and other related products and services for the industrial and resources-related business sectors. The company offers buckets, such as backhoe, wheel loader, hydraulic loading shovels, rope shovel dipper, and underground LHD; and dump bodies, underground dump bodies, tyre handlers, ancillary products, and water tanks, which are used in the mining industry. It also provides on and off-site repair and maintenance services, including specialized site machining, specialized fabrication and welding, specialized machining, on-site machining of ball and crusher mill tyre, metal spraying, NDT testing, service and exchange parts, and heavy equipment reclamation services, as well as manufacturing and supply of pins and bushes. It operates in Australia, Chile, the United States, Canada, Indonesia, and internationally. The company was founded in 1982 and is headquartered in Kewdale, Australia.
| Name | Title | Year Born |
|---|---|---|
| Mr. David Patrick Alexander Singleton B.Sc. (Hons) | CEO, MD & Director | 1960 |
| Mr. David Bonomini B.Com., CPA | Chief Financial Officer | NA |
| Mr. Graham Backhouse | Chief Operating Officer | NA |
| Ms. Rochelle Oberholzer B.Com., B.Sc., M.B.A. | Head of Governance, Legal, Risk & IT | NA |
| Jesus Laureano | Chief of Engineering at Peruvian Operation | NA |
| Mr. Charles Louis Rottier | Chief Strategic Officer | NA |
| Mr. Steve Shellenberger | CEO & Pres of Western Technology Svcs International Inc | NA |
| Mr. Warren Arthur | Chief Exec. Officer of COR Cooling Pty Ltd | NA |
| Ms. Katina A. Nadebaum B.Com, B.Com., C.A., CA, MAICD | Company Sec. | NA |
| Mr. Steve Warner | Operations Exec. | NA |
Disclaimer - (*)This information, including any data, is sourced from Unicorn Data Services SAS, trading as EOD Historical Data (“EODHD”) on an ‘as is’ basis, using their API. We cannot guarantee the completeness or validity of the information and data provided on this page, as well as via the API. In some cases, the data may include analyst ratings or recommendations sourced through the EODHD API, which are intended solely for general information purposes.
This information does not consider your personal objectives, financial situation, or needs. Kalkine is not liable for any errors or omissions in the information provided or for any actions taken in reliance on it. You should seek advice from a financial adviser, stockbroker or other professional adviser (including taxation and legal advice) as necessary before acting on this information.

Download a free report with stock ideas and industry insights for general information.
Download Free Report Now →


Basic Materials
 +0.61%
Communication Services
 -0.21%

Consumer Cyclical
-0.26%

Consumer Defensive
-0.37%

Energy
+0.23%

Financial Services
-0.43%
Financials
+0.39%

Healthcare
+0.88%

Industrials
+0.36%

Real Estate
-0.51%

Technology
+1.35%

Utilities
+0.19%
Note: Daily price change (%) by sector excluding stocks with +/-90% daily price change. Companies above $500 million market capitalization are considered.
 Portfolio
 Watchlist


 Please wait processing your request...