MSFT 425.025 -0.9035% AAPL 220.43 0.8648% NVDA 115.85 1.4004% GOOGL 172.44 -0.1101% GOOG 174.27 -0.0573% AMZN 182.99 1.1945% META 460.09 -0.2558% AVGO 152.64 0.859% TSLA 224.8499 4.102% TSM 161.61 1.1327% LLY 823.56 -4.2238% V 257.56 1.3338% JPM 209.535 0.453% UNH 562.83 0.5502% NVO 129.31 -1.7401% WMT 70.206 -0.5581% LVMUY 143.15 0.9022% XOM 116.85 1.5999% LVMHF 714.04 0.4982% MA 436.96 1.0429%

Solo Brands Inc
Solo Brands, Inc. (NYSE: DTC) is a direct-to-consumer (DTC) platform that operates through four outdoor lifestyle brands, which include Solo Stove, Oru Kayak (Oru), ISLE Paddle Boards (ISLE), and Chubbies apparel. The Company's brands develop products and market them directly to customers primarily through e-commerce channels. Its Solo Stoves include the Lite, Titan, and Campfire.
Recent Financial and Business Updates:
Technical Observation (on the daily chart)
The Relative Strength Index (RSI) observed over a 14-day period registers at 36.14, indicating some more consolidation or a short-term downward movement. Furthermore, the stock's current position is situated below both the 21-day Simple Moving Average (SMA) and the 50-day SMA, potentially acting as dynamic short-term resistance level. The price is currently between USD 4.00-USD 5.00, with a possibility of breakout in any direction. The direction it takes will play a pivotal role in shaping the stock's short to medium-term prospects.

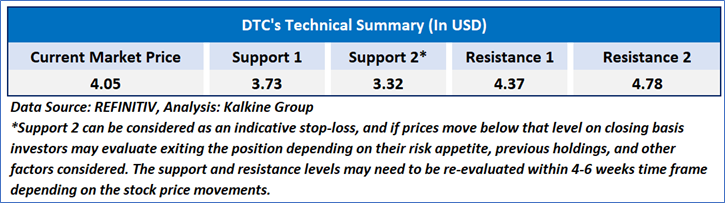
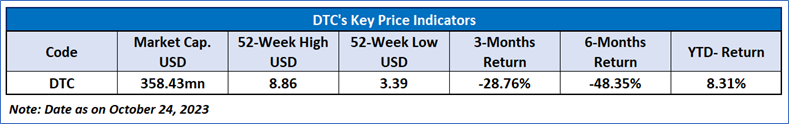
As per the above-mentioned price action, recent key business and financial updates, momentum in the stock over the last month, and technical indicators analysis, a ‘WATCH’ rating has been given to Solo Brands, Inc. (NYSE: DTC) at the current market price of USD 4.05 as of October 24, 2023, at 08:15 am PDT.
Markets are trading in a highly volatile zone currently due to certain macro-economic issues and prevailing geopolitical tensions. Therefore, it is prudent to follow a cautious approach while investing.
Related Risk: This report may be looked at from a high-risk perspective and a recommendation is provided for a short duration. This report is solely based on technical parameters, and the fundamental performance of the stocks has not been considered in the decision-making process. Other factors which could impact the stock prices include market risks, regulatory risks, interest rates risks, currency risks, social and political instability risks etc.
How to Read the Charts?
The yellow colour line reflects the 21-period simple moving average (SMA) while the blue line indicates the 50- period simple moving average (SMA). SMA helps to identify existing price trends. If the prices are trading above the 21-period and 50-period moving average, then it shows prices are currently trading in a bullish trend.
The orange colour line in the chart’s lower segment reflects the Relative Strength Index (14-Period) which indicates price momentum and signals momentum in trend. A reading of 70 or above suggests overbought status while a reading of 30 or below suggests an oversold status.
The red and green colour bars in the chart’s lower segment show the volume of the stock. The volume is the number of shares that changed hands during a given day. Stocks with high volumes are more liquid than stocks with lesser volume as liquidity in stocks helps with easier and faster execution of the order.
The Orange colour lines are the trend lines drawn by connecting two or more price points and used for trend identification purposes. The trend line also acts as a line of support and resistance.
Technical Indicators Defined: -
Support: A level at which the stock prices tend to find support if they are falling, and a downtrend may take a pause backed by demand or buying interest. Support 1 refers to the nearby support level for the stock and if the price breaches the level, then Support 2 may act as the crucial support level for the stock.
Resistance: A level at which the stock prices tend to find resistance when they are rising, and an uptrend may take a pause due to profit booking or selling interest. Resistance 1 refers to the nearby resistance level for the stock and if the price surpasses the level, then Resistance 2 may act as the crucial resistance level for the stock.
Stop-loss: It is a level to protect further losses in case of unfavourable movement in the stock prices.
The reference date for all price data, currency, technical indicators, support, and resistance levels is October 24, 2023. The reference data in this report has been partly sourced from REFINITIV.
Abbreviations
CMP: Current Market Price
SMA: Simple Moving Average
RSI: Relative Strength Index
USD: United States dollar
Note: Trading decisions require a thorough analysis by individual. Technical reports in general chart out metrics that may be assessed by individuals before any stock evaluation. The above are illustrative analytical factors used for evaluating the stocks; other parameters can be looked at along with additional risks per se. Past performance is neither an indicator nor a guarantee of future performance.
 US
US  AU
AU UK
UK CA
CA NZ
NZ Please wait processing your request...