Eli Lilly and Company
Eli Lilly and Company (NYSE: LLY) is engaged in drug manufacturing businesses. The Company discovers, develops, manufactures and markets products in the human pharmaceutical products segment. Its diabetes, obesity and other cardiometabolic products include Basaglar, Humalog, Humulin, Jardiance, Mounjaro, Trulicity and Zepbound. Its oncology products include Alimta, Cyramza, Erbitux, Jaypirca, Retevmo, Tyvyt and Verzenio. Its immunology products include Ebglyss, Olumiant, Omvoh and Taltz. Its neuroscience products include Cymbalta and Emgality. Its other products and therapies include Cialis and Forteo.
Recent Business and Financial Updates
- Eli Lilly and Company (NYSE: LLY) is scheduled to release its financial results for the second quarter of 2024 on August 8, 2024. On the same day, the company will hold a conference call with the investment community and media to provide a comprehensive overview of its financial performance.
- First-Quarter Reported Results: In the first quarter of 2024, worldwide revenue reached USD 8.77 billion, marking a 26% increase compared to Q1 2023. This growth was driven by a 16% rise in volume and a 10% increase in higher realized prices. The volume growth was largely attributed to the performance of Mounjaro, Zepbound®, Verzenio, and Jardiance, despite a decline in Trulicity® sales. The demand for the company's incretin medicines exceeded supply increases. Consequently, the company is expanding its manufacturing capacity, with significant production increases anticipated in the second half of 2024. The higher realized prices were primarily due to Mounjaro in the U.S., which benefitted from favorable savings card dynamics compared to Q1 2023. However, these savings card dynamics are expected to have a diminished impact on realized price comparisons in the latter half of 2024, following the expiration of the USD 25 non-covered benefit on June 30, 2023.
- S. Revenue Performance: U.S. revenue grew by 28% to USD 5.69 billion, propelled by a 16% increase in realized prices and a 12% rise in volume. The higher realized prices in the U.S. were driven by Mounjaro. Volume growth in the U.S. was led by Zepbound, Mounjaro, and Verzenio, partially counterbalanced by a decline in Trulicity. The strong demand for incretin medicines resulted in wholesaler backorders at the quarter's end. The company anticipates continued tight supply as production volumes struggle to keep pace with demand. In the short to mid-term, sales growth for incretin medicines is expected to depend on the company's production and shipping capacities.
- International Revenue Performance: Revenue outside the U.S. increased by 22% to USD 3.07 billion, driven by a 23% increase in volume, slightly offset by a 1% decrease due to lower realized prices. The volume increase outside the U.S. was mainly due to Mounjaro, Verzenio, Jardiance, and Tyvyt®.
- Financial Metrics and Operational Expenses: The gross margin in Q1 2024 increased by 33% to USD 7.09 billion, representing 80.9% of revenue, a 4.3 percentage point increase. This rise was primarily due to higher realized prices, a favorable product mix, and, to a lesser extent, production cost improvements. Research and development expenses grew by 27% to USD 2.52 billion, accounting for 29% of revenue, driven by higher development costs for late-stage assets, increased investments in early-stage research, and a USD 75 million charge related to the termination of the Verzenio prostate cancer program. Marketing, selling, and administrative expenses rose by 12% to USD 1.95 billion, mainly due to promotional efforts for ongoing and future launches, as well as higher compensation and benefit costs.
- Acquired IPR&D Charges and Tax Rate: In Q1 2024, the company recorded acquired in-process research and development (IPR&D) charges of USD 110.5 million, compared to USD 105.0 million in Q1 2023. The effective tax rate was 11.6%, down from 12.1% in Q1 2023, influenced by a larger net discrete tax benefit in Q1 2024.
- Net Income and Earnings Per Share (EPS): Net income for Q1 2024 was USD 2.24 billion, with an EPS of USD 2.48, compared to net income of USD 1.34 billion and an EPS of USD 1.49 in Q1 2023. Both periods included USD 0.10 of acquired IPR&D charges.
- First-Quarter Non-GAAP Measures: On a non-GAAP basis, Q1 2024 gross margin rose by 33% to USD 7.23 billion, representing 82.5% of revenue, a 4.1 percentage point increase. This improvement was driven by higher realized prices, a favorable product mix, and, to a lesser extent, production cost efficiencies. The effective tax rate on a non-GAAP basis was 11.9% in Q1 2024, compared to 12.8% in Q1 2023, due to a larger net discrete tax benefit in Q1 2024. Non-GAAP net income and EPS for Q1 2024 were USD 2.34 billion and USD 2.58, respectively, compared to USD 1.46 billion and USD 1.62 in Q1 2023. Both periods included USD 0.10 of acquired IPR&D charges.
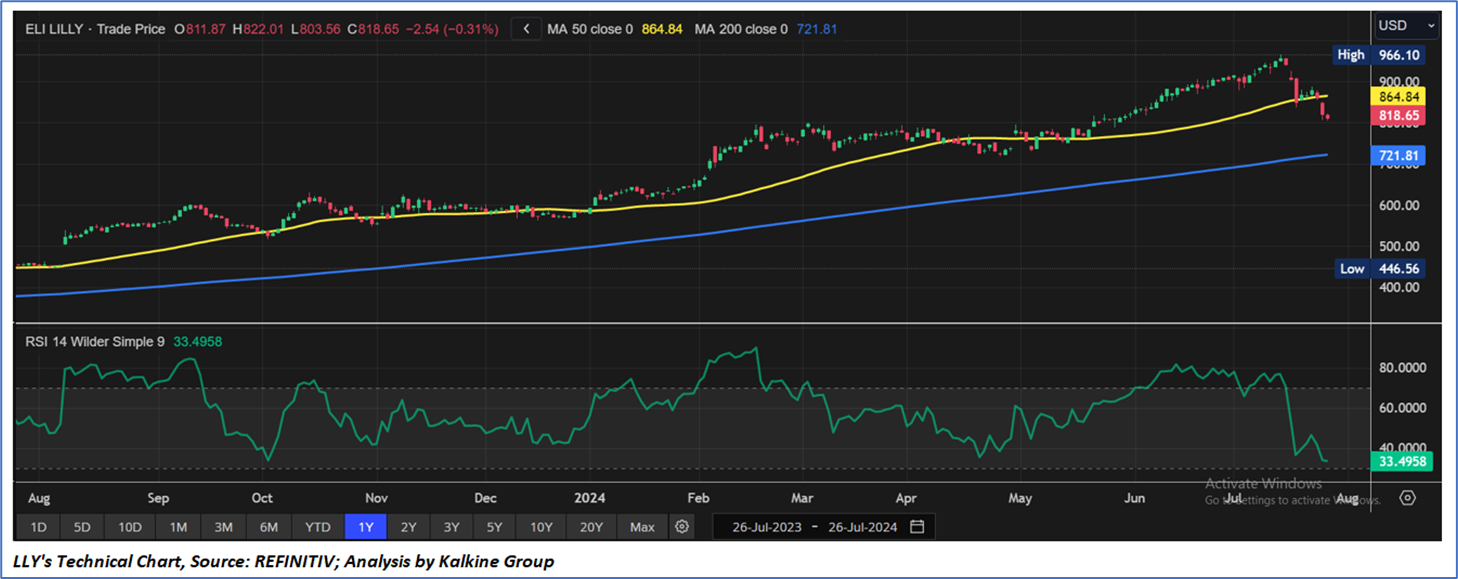
Technical Observation (on the daily chart):
The Relative Strength Index (RSI) over a 14-day period stands at a value of 33.49, downward trending and moving towards oversold zone, with expectations of a consolidation or a short-term further correction. Additionally, the stock's current positioning is between both 50-Day SMA and 200-Day SMA, which can act as a short to medium term resistance and support levels respectively.
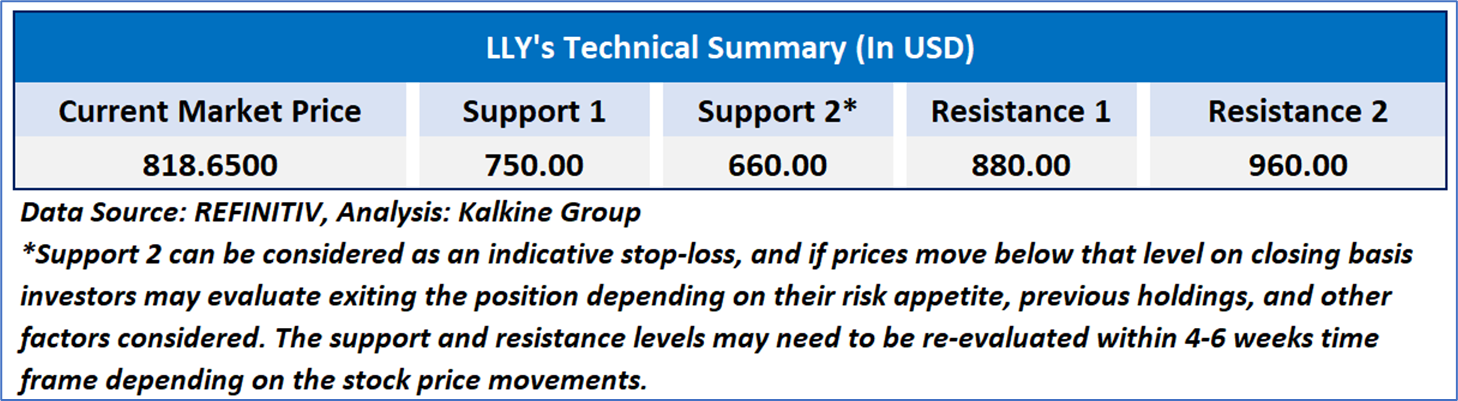
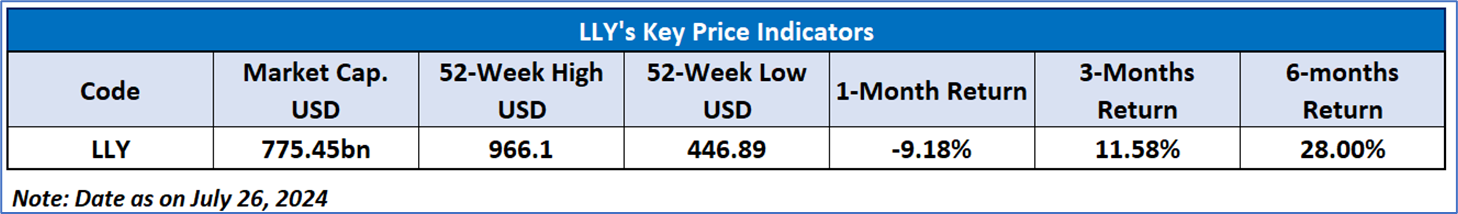
As per the above-mentioned price action, recent key business and financial updates, momentum in the stock over the last month, and technical indicators analysis, a ‘Watch’ rating has been given to Eli Lilly and Company (NYSE: LLY) at the current market price of USD 818.65 as of July 26, 2024, at 10:50 am PDT.
Individuals can evaluate the stock based on the support and resistance levels provided in the report in case of keen interest taking into consideration the risk-reward scenario.
Markets are trading in a highly volatile zone currently due to certain macro-economic issues and prevailing geopolitical tensions. Therefore, it is prudent to follow a cautious approach while investing.
Related Risk: This report may be looked at from a high-risk perspective and a recommendation is provided for a short duration. This report is solely based on technical parameters, and the fundamental performance of the stocks has not been considered in the decision-making process. Other factors which could impact the stock prices include market risks, regulatory risks, interest rates risks, currency risks, social and political instability risks etc.
Note 1: Past performance is not a reliable indicator of future performance.
Note 2: The reference date for all price data, currency, technical indicators, support, and resistance level is July 26, 2024. The reference data in this report has been partly sourced from REFINITIV.
Note 3: Investment decisions should be made depending on an individual's appetite for upside potential, risks, holding duration, and any previous holdings. An 'Exit' from the stock can be considered if the Target Price mentioned as per the Valuation and or the technical levels provided has been achieved and is subject to the factors discussed above.
Note 4: Target Price refers to a price level that the stock is expected to reach as per the relative valuation method and or technical analysis taking into consideration both short-term and long-term scenarios.
Note 5: ‘Kalkine reports are prepared based on the stock prices captured either from the New York Stock Exchange (NYSE), NASDAQ Capital Markets (NASDAQ), and or REFINITIV. Typically, all sources (NYSE, NASDAQ, or REFINITIV) may reflect stock prices with a delay which could be a lag of 15-20 minutes. There can be no assurance that future results or events will be consistent with the information provided in the report. The information is subject to change without any prior notice.

 Please wait processing your request...