ArcelorMittal SA
ArcelorMittal SA (NYSE: MT) is a Luxembourg-based holding company. The Company, via its subsidiaries, owns and operates steel, iron ore manufacturing and coal mining facilities in Europe, North and South America, Asia, and Africa. The Company is organized in five operating segments: NAFTA; Brazil; Europe; Africa and Commonwealth of Independent States (ACIS), and Mining.
Recent Financial and Business Updates:
Key Highlights:
- Commitment to Health and Safety: The company continues to prioritize employee health and safety with a focus on reducing lost time injury frequency (LTIF2) rates. In the second quarter of 2023, the LTIF2 rate was 0.73x, and it improved to 0.70x in the first half of 2023.
- Improved Operating Results: Positive price-cost dynamics led to improved operating results in the second quarter of 2023. Despite a marginal decrease in steel shipments to 14.2 million metric tons (Mt), operating income increased to USD 1.9 billion, compared to USD 1.2 billion in the first quarter of 2023. In the first half of 2023, operating income reached USD 3.1 billion, contrasting with USD 1.3 billion in the second half of 2022.
- Strong Per-tonne Profitability: Earnings before interest, taxes, depreciation, and amortization (EBITDA) in the second quarter of 2023 reached USD 2.6 billion, up from USD 1.8 billion in the first quarter of 2023. Notably, EBITDA per metric ton (t) rose to USD 183/t in the second quarter of 2023, compared to USD 126/t in the first quarter of 2023. In the first half of 2023, EBITDA amounted to USD 4.4 billion, exceeding the USD 3.9 billion reported in the second half of 2022.
- Higher Net Income: The company's net income for the second quarter of 2023 was USD 1.9 billion, a significant increase from USD 1.1 billion in the first quarter of 2023. This includes the share of joint venture (JV) and associates net income of USD 0.4 billion, compared to USD 0.3 billion in the first quarter of 2023. For the first half of 2023, the net income reached USD 3.0 billion, surpassing the USD 1.3 billion reported in the second half of 2022.
- Enhanced Share Value: Basic earnings per share (EPS) for the second quarter of 2023 amounted to USD 2.21 per share. The company's rolling return on equity (ROE) over the last 12 months reached 10.3%. Furthermore, the book value per share now stands at USD 66 per share, reflecting the repurchase of 5.7 million shares during the quarter.
- Financial Strength: Despite ongoing share buybacks (USD 0.2 billion) and dividend payments (USD 0.2 billion), the company ended June 30, 2023, with net debt of USD 4.5 billion. This is a decrease of USD 0.7 billion compared to the end of March 31, 2023. The company's gross debt is USD 10.5 billion, while cash and cash equivalents amount to USD 5.9 billion as of June 30, 2023, compared to USD 11.5 billion and USD 6.3 billion, respectively, as of March 31, 2023.
- Continued Strong Free Cash Flow (FCF) Generation: In the second quarter of 2023, the company generated USD 1.0 billion in free cash flow (FCF), calculated as USD 2.1 billion net cash provided by operating activities minus capital expenditures of USD 1.1 billion and dividends paid to minorities.
Strategic Update and Outlook:
- Progress in Climate Action: The company's climate action initiatives are making headway. It received European Commission approvals for government funding support for decarbonization projects in Spain, Belgium, and France and awaits approvals for German government funding support. More than 200 dedicated employees are progressing toward the Pre-FEED stage for Direct Reduction Iron-Electric Arc Furnace (DRI-EAF) projects, with commitments from core process equipment suppliers. Plans with John Cockerill were announced to build an industrial-scale low-temperature, direct electrolysis plant called Volteron™, targeting the production of iron plates starting in 2027.
- XCarb® Progress: The company's XCarb® recycled and renewably produced steel offering is gaining momentum and will be produced by ArcelorMittal North America to supply General Motors.
- Capital Allocation and Return Policy: The company has consistently executed its capital allocation and return policy. Besides paying the first installment of the USD 0.44 per share base dividend in June 2023, it has repurchased 24.8 million shares in 2023. Recent acquisitions, including ArcelorMittal Pecém (Brazil) and ArcelorMittal Texas HBI, along with completed strategic capital expenditure projects such as the Mexico hot strip mill, are performing above assumed normalized profitability levels. Additionally, the expansion of the AMNS India Hazira plant to approximately 15 million metric tons (Mt) capacity by 2026 is progressing well, and the CGL4 project is on track for completion in the third quarter of 2023, providing a platform for launching the Magnelis product in the Indian market.
Analysis of Results for 2Q 2023:
- Steel Shipments: Total steel shipments in the second quarter of 2023 decreased by 1.7% to 14.2Mt, compared to 14.5Mt in the first quarter of 2023. Steel shipments in NAFTA declined by 8.4%, primarily due to lower slab shipments, while Europe saw a 6.2% decrease due to outages in France and Spain. These declines were partly offset by a 22.0% increase in Brazil, mainly attributable to the ArcelorMittal Pecém acquisition. Excluding the impact of ArcelorMittal Pecém, steel shipments in the second quarter of 2023 were 5.4% lower than in the first quarter of 2023. As compared to the second quarter of 2022, total steel shipments in the second quarter of 2023 were 1.2% lower.
- Sales: Sales in the second quarter of 2023 remained stable at USD 18.6 billion, compared to USD 18.5 billion in the first quarter of 2023, but lower than the USD 22.1 billion reported for the second quarter of 2022. This stability was influenced by lower steel shipment volumes, offset in part by higher average steel selling prices (+4.2%). Sales in the second quarter of 2023 were 16.0% lower than the second quarter of 2022, primarily due to lower average steel selling prices (-16.1%) and lower steel shipments (-1.2%).
- Depreciation: Depreciation for the second quarter of 2023 was higher at USD 680 million, compared to USD 630 million in the first quarter of 2023, mainly due to the full quarter contribution of ArcelorMittal Pecém, and USD 669 million in the second quarter of 2022.
- Operating Income: Operating income for the second quarter of 2023 was USD 1.9 billion, compared to USD 1.2 billion in the first quarter of 2023 and USD 4.5 billion in the second quarter of 2022. The improvement in operating income compared to the first quarter of 2023 was due to improving steel spreads and lower costs, offset in part by lower steel shipments.
- Income from Associates and Joint Ventures: Income from associates, joint ventures, and other investments for the second quarter of 2023 was USD 393 million, compared to USD 318 million in the first quarter of 2023 and USD 578 million in the second quarter of 2022. Second quarter of 2023 results improved compared to the first quarter of 2023, with a higher contribution from AMNS India, including USD 0.1 billion income arising from recognition of a deferred tax asset. The second quarter of 2022 included a higher contribution from European investees.
- Net Interest Expense: Net interest expense in the second quarter of 2023 was USD 47 million, compared to USD 64 million in the first quarter of 2023 and USD 53 million in the second quarter of 2022. The benefit of higher interest income more than offset the impact of higher interest rates.
- Foreign Exchange and Other Net Financing Loss: Foreign exchange and other net financing loss in the second quarter of 2023 was USD 133 million, compared to a loss of USD 117 million in the first quarter of 2023 and a loss of USD 183 million in the second quarter of 2022. The second quarter of 2023 included a foreign exchange loss of USD 60 million, compared to a foreign exchange gain of USD 31 million in the first quarter of 2023 and a loss of USD 152 million in the second quarter of 2022.
- Income Tax Expense: ArcelorMittal recorded an income tax expense of USD 231 million (including a deferred tax benefit of USD 85 million) in the second quarter of 2023, compared to an income tax expense of USD 189 million (including a deferred tax benefit of USD 93 million) in the first quarter of 2023 and an income tax expense of USD 826 million (including a deferred tax benefit of USD 74 million) in the second quarter of 2022.
- Net Income: ArcelorMittal recorded a net income of USD 1,860 million in the second quarter of 2023, compared to USD 1,096 million in the first quarter of 2023 and USD 3,923 million in the second quarter of 2022.
- Earnings per Share: ArcelorMittal's basic earnings per common share for the second quarter of 2023 was USD 2.21, compared to USD 1.28 in the first quarter of 2023 and USD 4.25 in the second quarter of 2022.
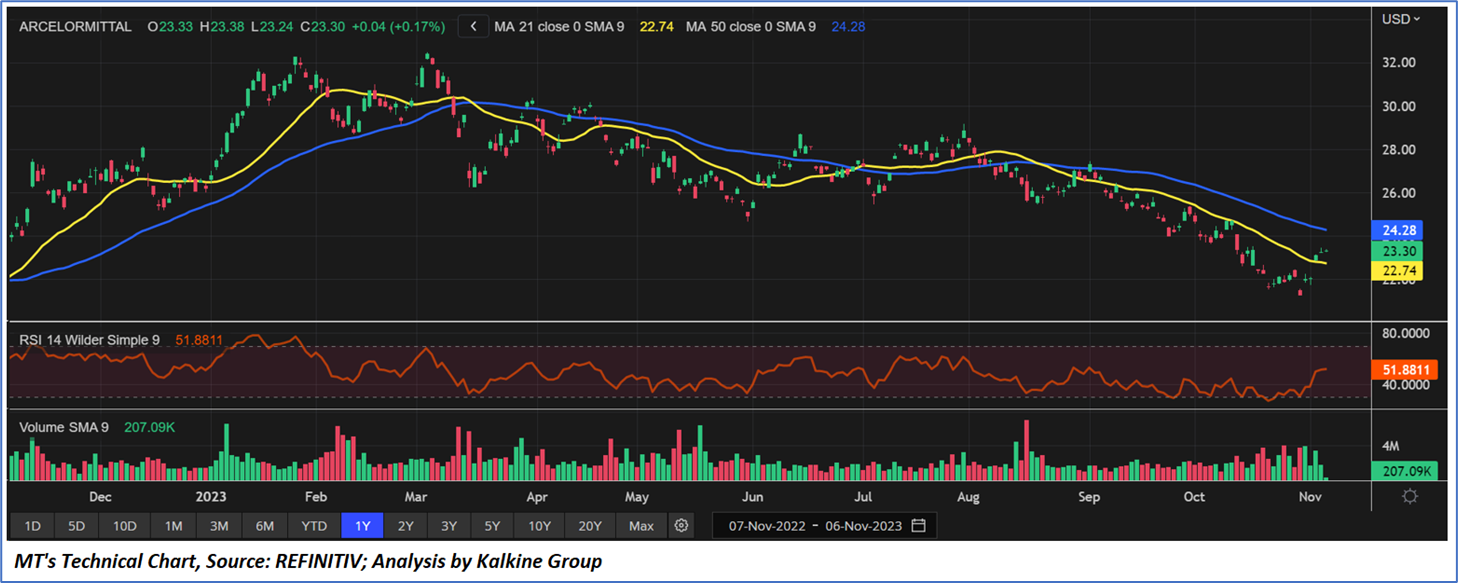
Technical Observation (on the daily chart)
The Relative Strength Index (RSI) observed over a 14-day period registers at 51.88, indicating a recovery from oversold conditions. The current RSI is rising with the potential for a short-term uptick in momentum or a period of consolidation. Furthermore, the stock's current position is situated between both the 21-day Simple Moving Average (SMA) and the 50-day SMA, potentially acting as dynamic short-term support and resistance levels respectively. Presently, the stock price seems to have undergone a reasonable adjustment following a robust upward trend. The price has broken above an important resistance of USD 22.50-USD 23.00, with an expectation on an upside potential from hereon.
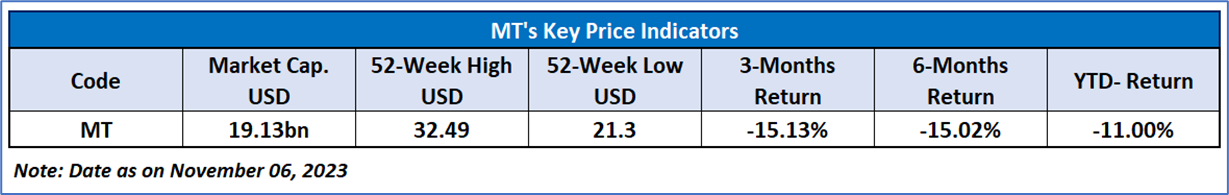
As per the above-mentioned price action, recent key business and financial updates, momentum in the stock over the last month, and technical indicators analysis, a ‘Buy’ rating has been given to ArcelorMittal SA (NYSE: MT) at the current market price of USD 23.30 as of November 06, 2023, at 07:15 am PDT.
Markets are trading in a highly volatile zone currently due to certain macro-economic issues and prevailing geopolitical tensions. Therefore, it is prudent to follow a cautious approach while investing.
Related Risk: This report may be looked at from a high-risk perspective and a recommendation is provided for a short duration. This report is solely based on technical parameters, and the fundamental performance of the stocks has not been considered in the decision-making process. Other factors which could impact the stock prices include market risks, regulatory risks, interest rates risks, currency risks, social and political instability risks etc.
How to Read the Charts?
The yellow colour line reflects the 21-period simple moving average (SMA) while the blue line indicates the 50- period simple moving average (SMA). SMA helps to identify existing price trends. If the prices are trading above the 21-period and 50-period moving average, then it shows prices are currently trading in a bullish trend.
The orange colour line in the chart’s lower segment reflects the Relative Strength Index (14-Period) which indicates price momentum and signals momentum in trend. A reading of 70 or above suggests overbought status while a reading of 30 or below suggests an oversold status.
The red and green colour bars in the chart’s lower segment show the volume of the stock. The volume is the number of shares that changed hands during a given day. Stocks with high volumes are more liquid than stocks with lesser volume as liquidity in stocks helps with easier and faster execution of the order.
The Orange colour lines are the trend lines drawn by connecting two or more price points and used for trend identification purposes. The trend line also acts as a line of support and resistance.
Technical Indicators Defined: -
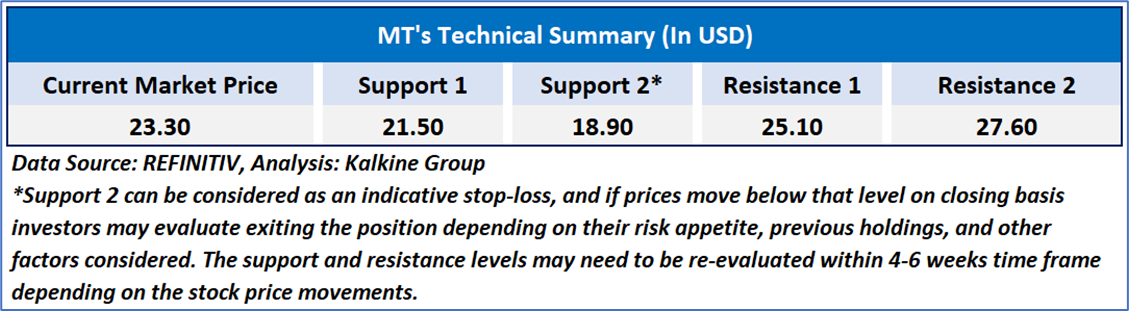
Support: A level at which the stock prices tend to find support if they are falling, and a downtrend may take a pause backed by demand or buying interest. Support 1 refers to the nearby support level for the stock and if the price breaches the level, then Support 2 may act as the crucial support level for the stock.
Resistance: A level at which the stock prices tend to find resistance when they are rising, and an uptrend may take a pause due to profit booking or selling interest. Resistance 1 refers to the nearby resistance level for the stock and if the price surpasses the level, then Resistance 2 may act as the crucial resistance level for the stock.
Stop-loss: It is a level to protect further losses in case of unfavourable movement in the stock prices.
The reference date for all price data, currency, technical indicators, support, and resistance levels is November 06, 2023. The reference data in this report has been partly sourced from REFINITIV.
Abbreviations
CMP: Current Market Price
SMA: Simple Moving Average
RSI: Relative Strength Index
USD: United States dollar
Note: Trading decisions require a thorough analysis by individual. Technical reports in general chart out metrics that may be assessed by individuals before any stock evaluation. The above are illustrative analytical factors used for evaluating the stocks; other parameters can be looked at along with additional risks per se. Past performance is neither an indicator nor a guarantee of future performance.
 Please wait processing your request...