
 CA
 NZ
 UK
 AU
 IND

 US

Digital Realty Trust Inc
Digital Realty Trust, Inc. (NYSE: DLR) is a real estate investment trust. The Company owns, acquires, develops, and operates data centers through its operating partnership subsidiary, Digital Realty Trust, L.P. The Company is focused on providing data center, collocation, and interconnection solutions for domestic and international customers across a variety of industry verticals ranging from cloud and information technology services, communications and social networking to financial services, manufacturing, energy, healthcare, and consumer products.
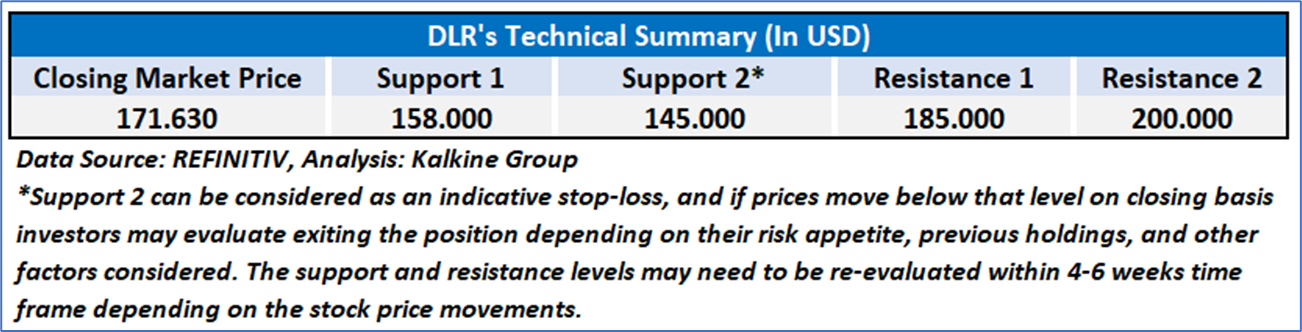
As per our previous US Dividend Income Report published on ‘DLR’ on October 22, 2025, we provided a ‘Buy’ stance on the stock at USD 171.63 based on “Digital Realty Trust, Inc.’s (NYSE: DLR) robust FY2025 trajectory—highlighted by a 58% YoY revenue increase, a record USD 826 million backlog, 13% EBITDA growth, and improved 7.3% renewal spreads—the company’s raised core FFO guidance of USD 7.15–7.25 per share reinforces its strong growth outlook, expanding recurring revenues, disciplined capital deployment, and resilient occupancy trends” and the stock price has now moved up by ~8.16% since then and has attained resistance 1 and moving towards resistance 2.
Noted below are the details of support and resistance levels provided in our previous report:
Rationales For “Sell” at Current Levels:
Daily Chart
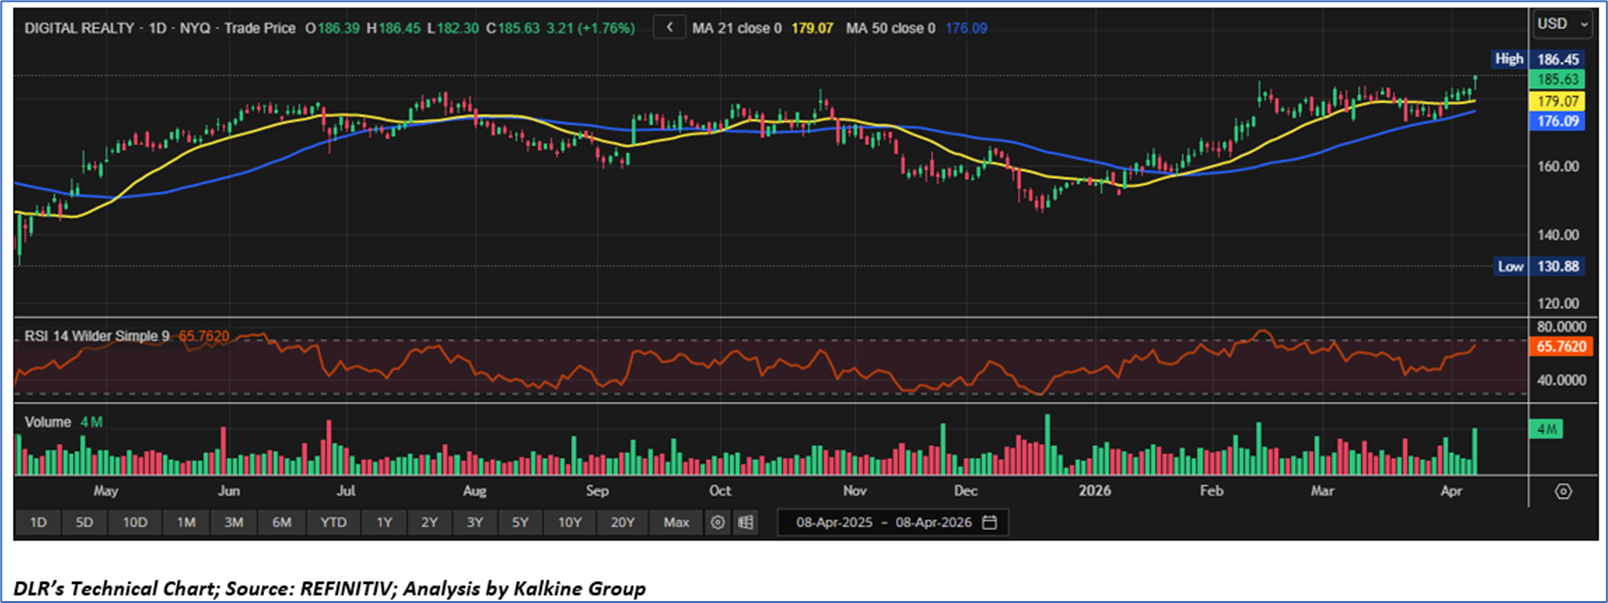
Considering the moderation in near-term earnings momentum (with quarterly net income per share declining year-over-year), the capital-intensive nature of growth requiring elevated and ongoing development CapEx, a relatively high leverage profile with sensitivity to interest rates and refinancing conditions, execution risks associated with leasing backlog conversion and delayed revenue realization, and moderate organic growth outlook despite strong demand tailwinds, a ‘Sell’ rating is assigned to the ‘DLR’ at the closing market price of USD 185.63, as of April 08, 2026.
Note: This report may be updated with details around fundamental and technical analysis, price chart in due course, as appropriate.
Note 1: Past performance is not a reliable indicator of future performance.
Note 2: The reference date for all price data, currency, technical indicators, support, and resistance level is April 08, 2026. The reference data in this report has been partly sourced from REFINITIV.
Note 3: Investment decisions should be made depending on an individual's appetite for upside potential, risks, holding duration, and any previous holdings. An 'Exit' from the stock can be considered if the Target Price mentioned as per the Valuation and or the technical levels provided has been achieved and is subject to the factors discussed above.
Note 4: Target Price refers to a price level that the stock is expected to reach as per the relative valuation method and or technical analysis taking into consideration both short-term and long-term scenarios.
Note 5: ‘Kalkine reports are prepared based on the stock prices captured either from the New York Stock Exchange (NYSE), NASDAQ Capital Markets (NASDAQ), and or REFINITIV. Typically, all sources (NYSE, NASDAQ, or REFINITIV) may reflect stock prices with a delay which could be a lag of 15-20 minutes. There can be no assurance that future results or events will be consistent with the information provided in the report. The information is subject to change without any prior notice.
Kalkine Equities LLC, with Delaware File Number 4697384, Foreign Qualification Registration in California File Number 202109211078, and Texas File Number 805521396, is authorized to provide general advice only. The information on https://kalkine.com/ does not take into account any of your investment objectives, financial situation or needs. You should consider the appropriateness of advice taking into account your own objectives, financial situation and needs and seek independent financial advice before making any financial decisions. The link to our Terms and Conditions and Privacy Policy has been provided for your reference. On the date of publishing the reports (mentioned on the website), employees and/or associates of Kalkine do not hold positions in any of the stocks covered on the website. These stocks can change any time and readers of the reports should not consider these stocks as advice or recommendations later.
Past performance is not a reliable indicator of future performance.
 Please wait processing your request...