
TMC The Metal Company Inc
Company Overview: TMC the metals company Inc. (NASDAQ: TMC) is a deep-sea minerals exploration company focused on the collection, processing and refining of polymetallic nodules found on the seafloor of the Clarion Clipperton Zone of the Pacific Ocean (CCZ). The CCZ is a zone of abyssal plains and other formations in the Eastern Pacific Ocean, with a length of approximately 4,500 miles.
As per our previous US Daily report published on ‘TMC’ on 03rd November 2023, Kalkine provided a ‘Speculative Buy’ stance on the stock at USD 0.87 based on “price action, recent key business and financial updates, momentum in the stock over the last month and technical analysis” and the stock price has now moved by ~60.92% since then and the price has crossed resistance 1 and resistance 2.
Noted below are the details of support and resistance levels provided in our previous report:

TMC’s Daily Chart
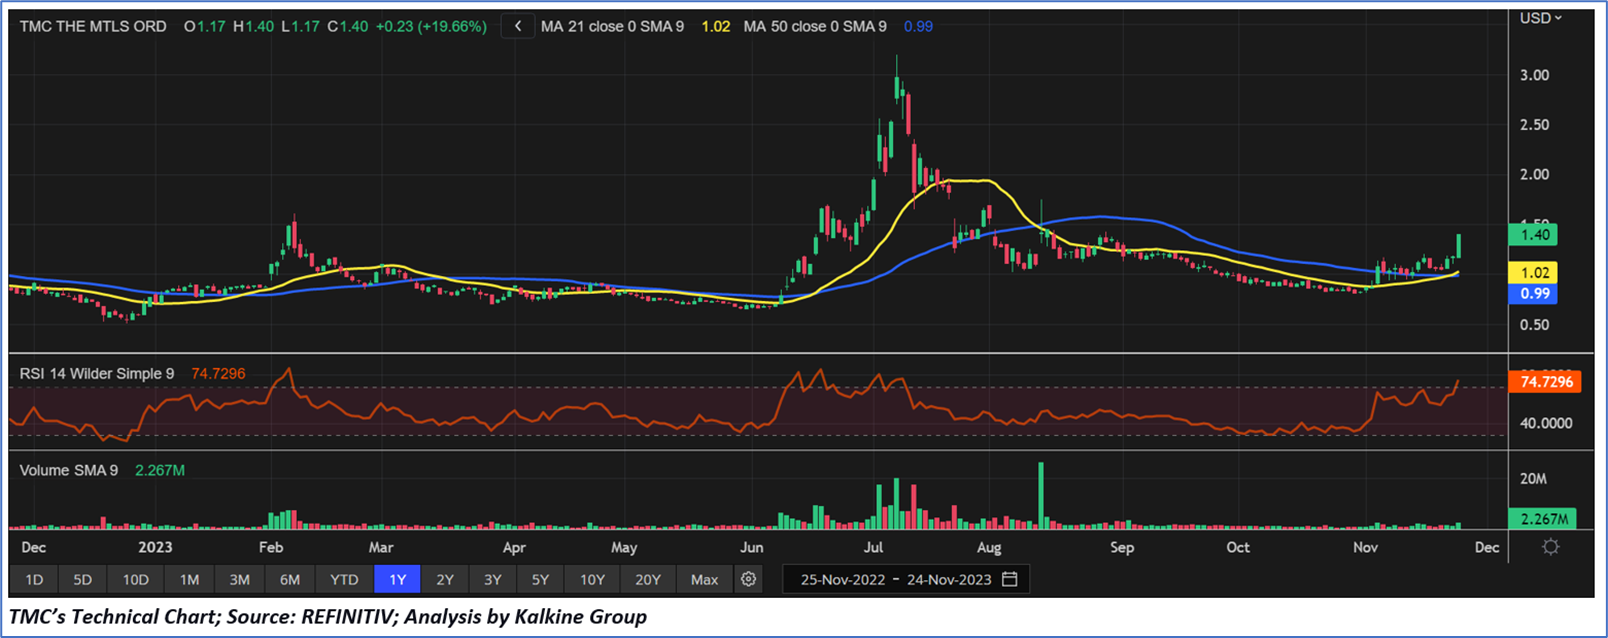
Considering the resistance around the range of USD 1.40 – USD 1.50, attainment of resistance 1 and resistance 2 levels, current trading levels, risks associated, and volatile market conditions on the back of rising interest rates, a ‘Sell’ rating is assigned to the “TMC” at the closing market price of USD1.40 (as of 24 November 2023).
Note: This report may be updated with details around fundamental and technical analysis, price/ chart in due course, as appropriate
Note 1: Past performance is not a reliable indicator of future performance.
Note 2: The reference date for all price data, currency, technical indicators, support, and resistance level is November 24, 2023. The reference data in this report has been partly sourced from REFINITIV.
Note 3: Investment decisions should be made depending on an individual's appetite for upside potential, risks, holding duration, and any previous holdings. An 'Exit' from the stock can be considered if the Target Price mentioned as per the Valuation and or the technical levels provided has been achieved and is subject to the factors discussed above.
Note 4: Target Price refers to a price level that the stock is expected to reach as per the relative valuation method and or technical analysis taking into consideration both short-term and long-term scenarios.
Note 5: ‘Kalkine reports are prepared based on the stock prices captured either from the New York Stock Exchange (NYSE), NASDAQ Capital Markets (NASDAQ), and or REFINITIV. Typically, all sources (NYSE, NASDAQ, or REFINITIV) may reflect stock prices with a delay which could be a lag of 15-20 minutes. There can be no assurance that future results or events will be consistent with the information provided in the report. The information is subject to change without any prior notice.’
Kalkine Equities LLC provides general information about companies and their securities. The information contained in the reports, including any recommendations regarding the value of or transactions in any securities, does not take into account any of your investment objectives, financial situation or needs. Kalkine Equities LLC is not registered as an investment adviser in the U.S. with either the federal or state government. Before you make a decision about whether to invest in any securities, you should take into account your own objectives, financial situation and needs and seek independent financial advice. All information in our reports represents our views as at the date of publication and may change without notice.
Kalkine Media LLC, an affiliate of Kalkine Equities LLC, may have received, or be entitled to receive, financial consideration in connection with providing information about certain entity(s) covered on its website.
Past performance is not a reliable indicator of future performance.
 Please wait processing your request...