
Pfizer Inc
Pfizer Inc. (NYSE: PFE) is a research-based biopharmaceutical company. The Company is engaged in the discovery, development, manufacture, marketing, sale, and distribution of biopharmaceutical products around the world. The Company operates through two segments: Biopharma and PC1.
Recent Financial and Business Updates:
Q3 2023 Financial Performance: Navigating Operational Challenges
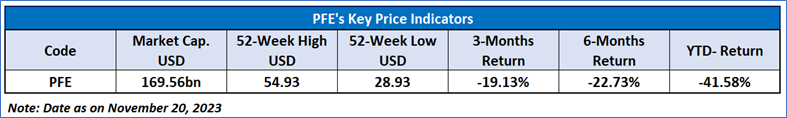
In the third quarter of 2023, Pfizer encountered a substantial 41% operational decrease in revenues, amounting to USD 13.2 billion. This decline was primarily attributed to expected reductions in Paxlovid and Comirnaty (1) revenues. Contrasting this trend, Pfizer's non-COVID product segment displayed a commendable 10% operational growth. The reported diluted loss per share (LPS) of USD (0.42) was significantly influenced by USD 5.6 billion in non-cash inventory write-offs and charges, resulting in an adjusted diluted LPS of USD (0.17). Pfizer maintained its full-year 2023 guidance, projecting revenues between USD 58.0 and USD 61.0 billion and adjusted diluted EPS in the range of USD 1.45 to USD 1.65.
Strategic Capital Allocation in 2023: Reinventing Growth
In the initial nine months of 2023, Pfizer executed a strategic capital allocation plan, reinvesting USD 7.9 billion in internal research and development initiatives. Simultaneously, the company returned USD 6.9 billion to shareholders through cash dividends. With a remaining share repurchase authorization of USD 3.3 billion as of October 31, 2023, Pfizer signaled a deliberate pause in share repurchases for the year.
2023 Financial Guidance: Navigating the Post-COVID Landscape
Pfizer's financial guidance for 2023 foresees a 40% operational decrease in revenues compared to 2022, largely stemming from anticipated declines in COVID-19 product revenues. Excluding these products, the company anticipates a robust 6% to 8% operational revenue growth. Notably, guidance for Comirnaty (1) and Paxlovid reflects expected declines of 70% and 95%, respectively, compared to 2022, highlighting Pfizer's strategic shift in response to evolving market dynamics.
Recent Developments: Innovations and Transformations
Pfizer showcased a series of recent developments, emphasizing its commitment to innovation and transformation. New product launches, including Abrilada and Abrysvo, alongside the FDA approval of Braftovi in combination with Mektovi for metastatic non-small cell lung cancer, underscore Pfizer's dedication to advancing healthcare solutions. Additionally, the initiation of a comprehensive cost realignment program, targeting at least USD 3.5 billion in annual net cost savings by 2024, reflects the company's proactive stance in optimizing operational efficiency.
Managing the Impact: Adapting to Shifting COVID-19 Dynamics
In response to the impactful decline in Paxlovid and Comirnaty (1) revenues during Q3 2023, Pfizer provided insights into its active management of the transition of these products to traditional commercial markets. Despite facing challenges, Pfizer remains steadfast in its growth strategy. The company continues to invest in research and development, introduce new products to the market, and implement cost-saving initiatives, highlighting its resilience and commitment to long-term success.
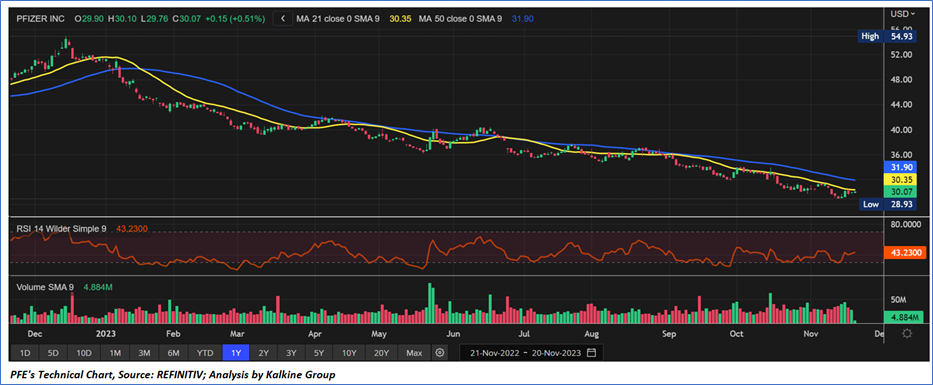
Technical Observation (on the daily chart)
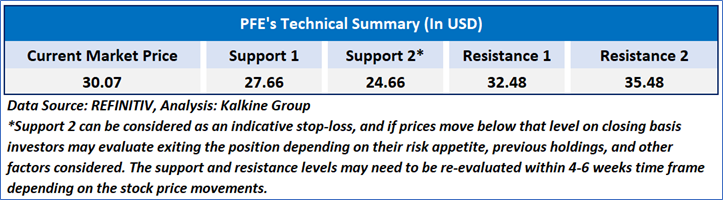
The Relative Strength Index (RSI), calculated over a 14-day span, stands at 43.23, currently recovering from oversold zone, signifying the likelihood of either more consolidation or a brief surge soon. Adding to this, the stock presently finds itself positioned beneath both the 21-day and 50-day Simple Moving Averages (SMA), which could function as a dynamic short-term resistance barrier. Now, the stock's price hovers around a crucial resistance range of USD 30.00 to USD 32.00, with an anticipation of an impending upward shift originating in case of a break on the upside of these levels.
As per the above-mentioned price action, recent key business and financial updates, momentum in the stock over the last month, and technical indicators analysis, a ‘Watch’ rating has been given to Pfizer Inc. (NYSE: PFE) at the current market price of USD 30.07 as of November 20, 2023, 07:50 am PST.
Markets are trading in a highly volatile zone currently due to certain macro-economic issues and prevailing geopolitical tensions. Therefore, it is prudent to follow a cautious approach while investing.
Related Risk: This report may be looked at from a high-risk perspective and a recommendation is provided for a short duration. This report is solely based on technical parameters, and the fundamental performance of the stocks has not been considered in the decision-making process. Other factors which could impact the stock prices include market risks, regulatory risks, interest rates risks, currency risks, social and political instability risks etc.
How to Read the Charts?
The yellow colour line reflects the 21-period simple moving average (SMA) while the blue line indicates the 50- period simple moving average (SMA). SMA helps to identify existing price trends. If the prices are trading above the 21-period and 50-period moving average, then it shows prices are currently trading in a bullish trend.
The orange colour line in the chart’s lower segment reflects the Relative Strength Index (14-Period) which indicates price momentum and signals momentum in trend. A reading of 70 or above suggests overbought status while a reading of 30 or below suggests an oversold status.
The red and green colour bars in the chart’s lower segment show the volume of the stock. The volume is the number of shares that changed hands during a given day. Stocks with high volumes are more liquid than stocks with lesser volume as liquidity in stocks helps with easier and faster execution of the order.
The Orange colour lines are the trend lines drawn by connecting two or more price points and used for trend identification purposes. The trend line also acts as a line of support and resistance.
Technical Indicators Defined: -
Support: A level at which the stock prices tend to find support if they are falling, and a downtrend may take a pause backed by demand or buying interest. Support 1 refers to the nearby support level for the stock and if the price breaches the level, then Support 2 may act as the crucial support level for the stock.
Resistance: A level at which the stock prices tend to find resistance when they are rising, and an uptrend may take a pause due to profit booking or selling interest. Resistance 1 refers to the nearby resistance level for the stock and if the price surpasses the level, then Resistance 2 may act as the crucial resistance level for the stock.
Stop-loss: It is a level to protect further losses in case of unfavourable movement in the stock prices.
The reference date for all price data, currency, technical indicators, support, and resistance levels is November 20, 2023. The reference data in this report has been partly sourced from REFINITIV.
Abbreviations
CMP: Current Market Price
SMA: Simple Moving Average
RSI: Relative Strength Index
USD: United States dollar
Note: Trading decisions require a thorough analysis by individual. Technical reports in general chart out metrics that may be assessed by individuals before any stock evaluation. The above are illustrative analytical factors used for evaluating the stocks; other parameters can be looked at along with additional risks per se. Past performance is neither an indicator nor a guarantee of future performance.
Kalkine Equities LLC provides general information about companies and their securities. The information contained in the reports, including any recommendations regarding the value of or transactions in any securities, does not take into account any of your investment objectives, financial situation or needs. Kalkine Equities LLC is not registered as an investment adviser in the U.S. with either the federal or state government. Before you make a decision about whether to invest in any securities, you should take into account your own objectives, financial situation and needs and seek independent financial advice. All information in our reports represents our views as at the date of publication and may change without notice.
Kalkine Media LLC, an affiliate of Kalkine Equities LLC, may have received, or be entitled to receive, financial consideration in connection with providing information about certain entity(s) covered on its website.
Past performance is not a reliable indicator of future performance.
 Please wait processing your request...