
Sandstorm Gold Ltd.
Sandstorm Gold Ltd. (NYSE: SAND) offers financial support to gold mining companies via gold streaming and royalty agreements. From a geographical perspective, the company has a presence in North America, South & Central America, Africa, as well as Asia & Australia. Some of the notable royalties held by the company encompass Hod Maden, Santa Elena, Chapada, and Cerro Moro.

Recent Financial and Business Updates:
Underlying Commodities Analysis
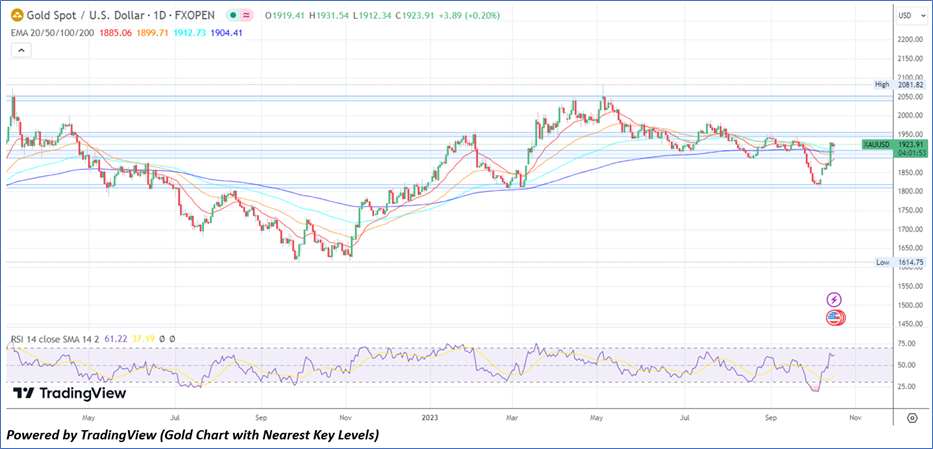
Gold prices, hovering near USD1,920 per ounce, are experiencing downward pressure due to a stronger US dollar and increased Treasury yields following robust economic data from the US. The latest retail sales report, surpassing expectations, has raised concerns that interest rates may remain elevated for a longer duration, diminishing gold's attractiveness, given its tendency to underperform in a high-interest-rate environment. Investors are now anxiously awaiting insights from Federal Reserve officials, with Fed Chair Jerome Powell's upcoming speech taking the spotlight, to gain insight into the future of US monetary policy. During escalating concerns about a broader Middle East conflict due to the Israel-Hamas war, gold continues to enjoy demand as a safe-haven asset.
Technical Observation (on the daily chart)
Presently, the stock has given a return of approximately 13.11% since reaching its lowest point in the past 52 weeks, which occurred on October 5, 2023 (correlating with Gold’s momentum). The Relative Strength Index (RSI) over a 14-day period stands at 50.32. The current price is between both 21-period and 50-period SMA, with both can act as short to medium term support and resistance levels respectively.
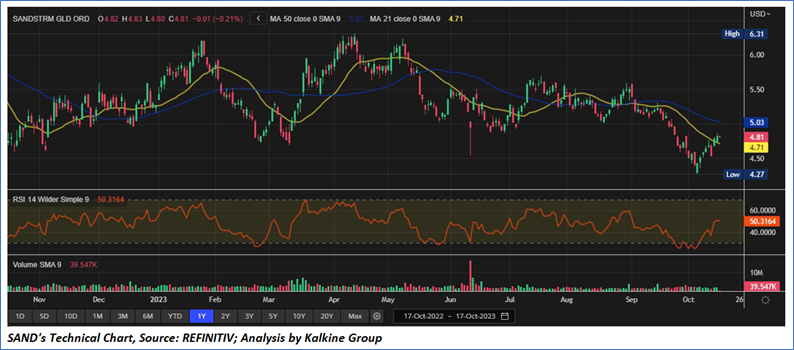
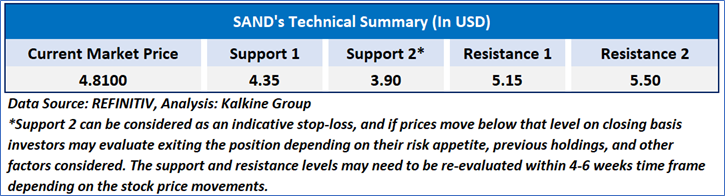
As per the above-mentioned price action, recent key business and financial updates, momentum in the stock over the last month, and technical indicators analysis, a “HOLD” rating is recommended for Sandstorm Gold Ltd. (NYSE: SAND) at its current price of USD4.81 as on October 17, 2023, at 6:50 am PDT.
Individuals can evaluate the stock based on the support and resistance levels provided in the report in case of keen interest taking into consideration the risk-reward scenario.
Markets are trading in a highly volatile zone currently due to certain macro-economic issues and prevailing geopolitical tensions. Therefore, it is prudent to follow a cautious approach while investing.
Related Risk: This report may be looked at from a high-risk perspective and a recommendation is provided for a short duration. This report is solely based on technical parameters, and the fundamental performance of the stocks has not been considered in the decision-making process. Other factors which could impact the stock prices include market risks, regulatory risks, interest rates risks, currency risks, social and political instability risks etc.
How to Read the Charts?
The yellow colour line reflects the 21-period simple moving average (SMA) while the blue line indicates the 50- period simple moving average (SMA). SMA helps to identify existing price trends. If the prices are trading above the 21-period and 50-period moving average, then it shows prices are currently trading in a bullish trend.
The orange colour line in the chart’s lower segment reflects the Relative Strength Index (14-Period) which indicates price momentum and signals momentum in trend. A reading of 70 or above suggests overbought status while a reading of 30 or below suggests an oversold status.
The red and green colour bars in the chart’s lower segment show the volume of the stock. The volume is the number of shares that changed hands during a given day. Stocks with high volumes are more liquid than stocks with lesser volume as liquidity in stocks helps with easier and faster execution of the order.
The Orange colour lines are the trend lines drawn by connecting two or more price points and used for trend identification purposes. The trend line also acts as a line of support and resistance.
Technical Indicators Defined: -
Support: A level at which the stock prices tend to find support if they are falling, and a downtrend may take a pause backed by demand or buying interest. Support 1 refers to the nearby support level for the stock and if the price breaches the level, then Support 2 may act as the crucial support level for the stock.
Resistance: A level at which the stock prices tend to find resistance when they are rising, and an uptrend may take a pause due to profit booking or selling interest. Resistance 1 refers to the nearby resistance level for the stock and if the price surpasses the level, then Resistance 2 may act as the crucial resistance level for the stock.
Stop-loss: It is a level to protect further losses in case of unfavourable movement in the stock prices.
The reference date for all price data, currency, technical indicators, support, and resistance levels is October 17, 2023. The reference data in this report has been partly sourced from REFINITIV.
Abbreviations
CMP: Current Market Price
SMA: Simple Moving Average
RSI: Relative Strength Index
USD: United States dollar
Note: Trading decisions require a thorough analysis by individual. Technical reports in general chart out metrics that may be assessed by individuals before any stock evaluation. The above are illustrative analytical factors used for evaluating the stocks; other parameters can be looked at along with additional risks per se. Past performance is neither an indicator nor a guarantee of future performance.
Kalkine Equities LLC provides general information about companies and their securities. The information contained in the reports, including any recommendations regarding the value of or transactions in any securities, does not take into account any of your investment objectives, financial situation or needs. Kalkine Equities LLC is not registered as an investment adviser in the U.S. with either the federal or state government. Before you make a decision about whether to invest in any securities, you should take into account your own objectives, financial situation and needs and seek independent financial advice. All information in our reports represents our views as at the date of publication and may change without notice.
Kalkine Media LLC, an affiliate of Kalkine Equities LLC, may have received, or be entitled to receive, financial consideration in connection with providing information about certain entity(s) covered on its website.
Past performance is not a reliable indicator of future performance.
 Please wait processing your request...