Explore 3 Stock Ideas & Industry Insights Download Free Report

small-cap

A Watch on Bed Bath & Beyond: Early Turnaround Progress Supported by Cost Discipline and Strategic Expansion Initiatives

Apr 28, 2026 | Team Kalkine
A Watch on Bed Bath & Beyond: Early Turnaround Progress Supported by Cost Discipline and Strategic Expansion Initiatives
Image source: shutterstock

  • BBBY:NYSE
  • Investment Type
    Small-Cap
  • Risk Level
  • Action
  • Rec. Price (US$)

Bed Bath & Beyond Inc

Bed Bath & Beyond, Inc. (NYSE: BBBY) is an e-commerce-focused retailer with an affinity model that owns or has ownership interests in various retail brands. The Company is building an Everything Home company through an integrated platform across omnichannel retail, home services, and products and services. The Company's brands include Bed Bath & Beyond, buybuy BABY, Overstock, and Kirkland’s.

Key Business and Financial Updates:

  • Revenue Recovery and Demand Improvement: Bed Bath & Beyond reported Q1 2026 net revenue of USD 248 million, reflecting 9% year-over-year growth, or 9.4% excluding Canada, marking the company’s first significant revenue increase in 19 quarters. Management also highlighted improving customer engagement, stronger conversion rates, rising average order value, and more efficient customer acquisition trends, indicating early demand stabilization and better commercial execution.
  • Margin Improvement and Lower Operating Costs: Gross profit totaled USD 59 million, representing a 9% gross margin in Q1 2026. Sales and marketing expense declined to 13.0% of revenue, improving by 50 basis points year-over-year, while technology and general & administrative expenses fell to USD 36 million from USD 41 million in the prior year. These metrics indicate that revenue growth was achieved alongside continued cost discipline and structural efficiency gains.
  • Loss Reduction and EBITDA Progress: Net loss narrowed to USD 16 million, representing a USD 24 million year-over-year improvement, while adjusted EBITDA improved by approximately USD 5 million compared with the prior-year quarter. Management noted this was the sixth consecutive quarter of year-over-year adjusted EBITDA improvement, suggesting ongoing progress toward a more sustainable earnings profile.
  • Liquidity and Financial Flexibility: The company ended Q1 2026 with USD 163 million in cash, cash equivalents, and restricted cash. Management also stated the business is operating on its lowest cost base in more than 12 years, indicating a leaner balance between operating scale and expense structure. This liquidity may support ongoing restructuring, acquisitions, and integration initiatives.
  • Expansion Strategy and Synergy Targets: During the quarter, Bed Bath & Beyond completed the acquisition of Kirkland’s and announced the acquisitions of The Container Store and F9 Brands. Looking forward, management expects to remove more than USD 60 million of costs from the consolidated company over the next nine months, while leveraging a broader service and retail ecosystem to improve revenue growth and customer lifetime value.

Key Company specific risks for BBBY:

  • Execution and Integration Risk: Successfully integrating multiple acquisitions, achieving the targeted USD 60 million cost savings, and scaling the ecosystem strategy remain critical to recovery execution.
  • Profitability and Cash Burn Risk: Despite improvement, BBBY still reported a USD 16 million net loss in Q1 2026, and sustained losses could pressure liquidity over time.
  • Consumer Demand and Competitive Risk: Exposure to discretionary home goods spending, macroeconomic softness, and intense competition from large e-commerce and retail peers could constrain revenue momentum.

Technical Observation (on the daily chart):
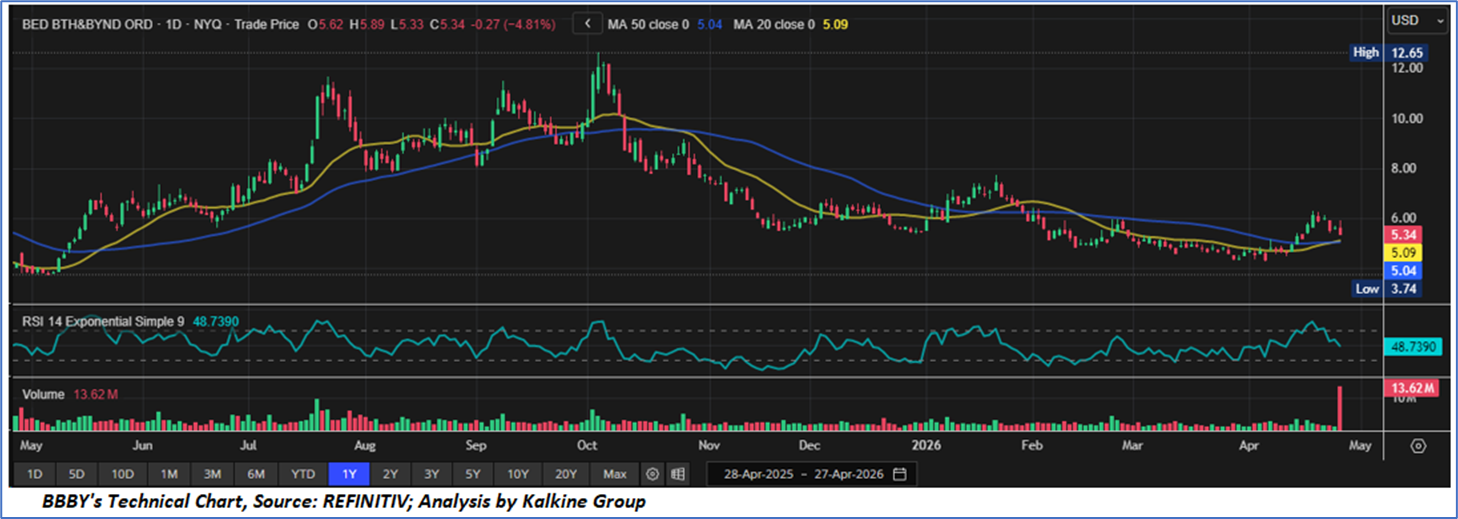
  • Trend Structure and Medium-Term Reversal Attempt: BBBY has recently shown signs of a developing recovery after a prolonged downtrend, with price advancing from the major support zone near USD 3.74 toward the current level of USD 5.34. The stock remains above both the 20-day moving average at USD 5.09 and the 50-day moving average at USD 5.04, indicating an improving short-term trend structure. Importantly, the recent bullish crossover of short-term moving averages suggests momentum has shifted from distribution toward accumulation. However, the latest 81% pullback indicates that the rally is encountering near-term profit-taking pressure after a sharp rebound.
  • Momentum, Participation and Internal Strength: The 14-day RSI at 48.74 reflects neutral momentum, suggesting the stock is neither overbought nor oversold and may be consolidating recent gains before its next directional move. RSI has improved materially from prior lower readings, which supports the case for recovering internal strength. Volume spiked to 62 million shares during the latest session, indicating elevated participation and heightened market interest. If higher volume begins to accompany up-days rather than down-days, it would strengthen the argument that institutional accumulation is emerging. Until then, momentum remains constructive but not yet decisive.
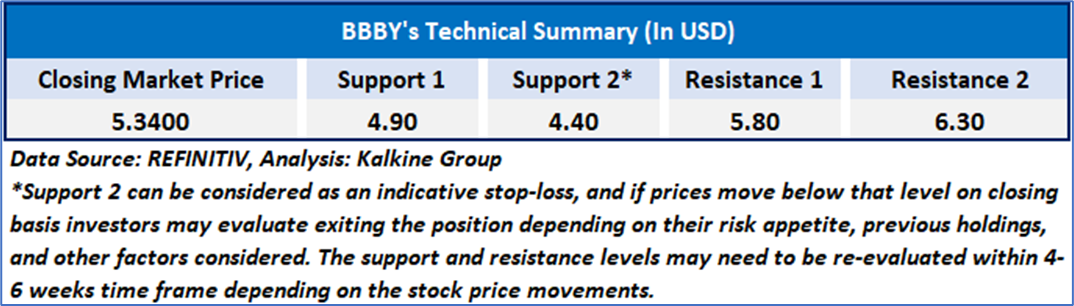
  • Key Levels, Tactical Setup and Forward Bias: Immediate support is located near the moving-average cluster at USD 5.00–5.10, followed by stronger structural support near USD 4.50 and the major base at USD 3.74. Holding above the USD 5.00 zone would preserve the current rebound structure. On the upside, initial resistance is seen near USD 6.00, where prior rallies have stalled, followed by a broader breakout zone around USD 7.00–7.50. A sustained close above these levels could open room toward the historical high near USD 12.65 over time. Overall, the technical bias has improved to moderately constructive, though confirmation through higher highs and sustained closes above resistance remains necessary for a stronger bullish trend signal.

Bed Bath & Beyond is showing early signs of operational recovery, supported by Q1 2026 revenue growth of 6.9% to USD 248 million, its first meaningful top-line increase in 19 quarters, alongside improving customer engagement, conversion trends, and average order values. Profitability metrics also improved, with gross profit of USD 59 million, a USD 24 million year-over-year reduction in net loss to USD 16 million, and a sixth consecutive quarter of adjusted EBITDA improvement. The company ended the quarter with USD 163 million in cash and continues operating on its lowest cost base in more than 12 years, providing financial flexibility for restructuring and growth initiatives. Strategically, management is pursuing an “Everything Home” platform through recent and pending acquisitions including Kirkland’s, The Container Store, and F9 Brands, while targeting more than USD 60 million of cost synergies over the next nine months. However, future performance remains dependent on successful integration execution, sustained consumer demand, and continued progress toward durable profitability.

As per the above-mentioned price action, important resistance near USD 5.00-USD 5.30, momentum in the stock over the last month, and technical indicators analysis, a ‘WATCH’ rating has been given for Bed Bath & Beyond, Inc. (NYSE: BBBY), at the closing price of USD5.34, as of April 27, 2026.

Individuals can evaluate the stock based on the support and resistance levels provided in the report in case of keen interest taking into consideration the risk-reward scenario.

Markets are trading in a highly volatile zone currently due to certain macro-economic issues and prevailing geopolitical tensions. Therefore, it is prudent to follow a cautious approach while investing.

Related Risk: This report may be looked at from a high-risk perspective, and a recommendation is provided for a short duration. This report is solely based on technical parameters, and the fundamental performance of the stocks has not been considered in the decision-making process. Other factors which could impact the stock prices include market risks, regulatory risks, interest rates risks, currency risks, social and political instability risks etc.

Note 1: Past performance is not a reliable indicator of future performance.

Note 2: The reference date for all price data, currency, technical indicators, support, and resistance level is April 27, 2026. The reference data in this report has been partly sourced from REFINITIV.

Note 3: Investment decisions should be made depending on an individual's appetite for upside potential, risks, holding duration, and any previous holdings. An 'Exit' from the stock can be considered if the Target Price mentioned as per the Valuation and or the technical levels provided has been achieved and is subject to the factors discussed above.

Note 4: Target Price refers to a price level that the stock is expected to reach as per the relative valuation method and or technical analysis taking into consideration both short-term and long-term scenarios.

Note 5: ‘Kalkine reports are prepared based on the stock prices captured either from the New York Stock Exchange (NYSE), NASDAQ Capital Markets (NASDAQ), and or REFINITIV. Typically, all sources (NYSE, NASDAQ, or REFINITIV) may reflect stock prices with a delay which could be a lag of 15-20 minutes. There can be no assurance that future results or events will be consistent with the information provided in the report. The information is subject to change without any prior notice.


Disclaimer-

Kalkine Equities LLC, with Delaware File Number 4697384, Foreign Qualification Registration in California File Number 202109211078, and Texas File Number 805521396, is authorized to provide general advice only. The information on https://kalkine.com/ does not take into account any of your investment objectives, financial situation or needs. You should consider the appropriateness of advice taking into account your own objectives, financial situation and needs and seek independent financial advice before making any financial decisions. The link to our Terms and Conditions  and Privacy Policy has been provided for your reference. On the date of publishing the reports (mentioned on the website), employees and/or associates of Kalkine do not hold positions in any of the stocks covered on the website. These stocks can change any time and readers of the reports should not consider these stocks as advice or recommendations later.

Past performance is not a reliable indicator of future performance.

Support

Hi! How can we help you today?

Loading…