
 CA
 NZ
 UK
 AU
 IND

 US

Overview
This week’s report covers Leverage Shares 2x Long FIG Daily ETF (NASDAQ: FIGG), GraniteShares 2x Long NOW Daily ETF (NASDAQ: NOWL) which are ‘Directional Leveraged ETFs’ that use financial derivatives and debt to amplify the returns of an underlying index, typically by 2x or 3x. These leveraged ETFs aim to provide magnified exposure to the price movements of a specific asset class, either in the direction of rising (bullish) or falling (bearish) prices.
Section 1: Leverage Shares 2x Long FIG Daily ETF
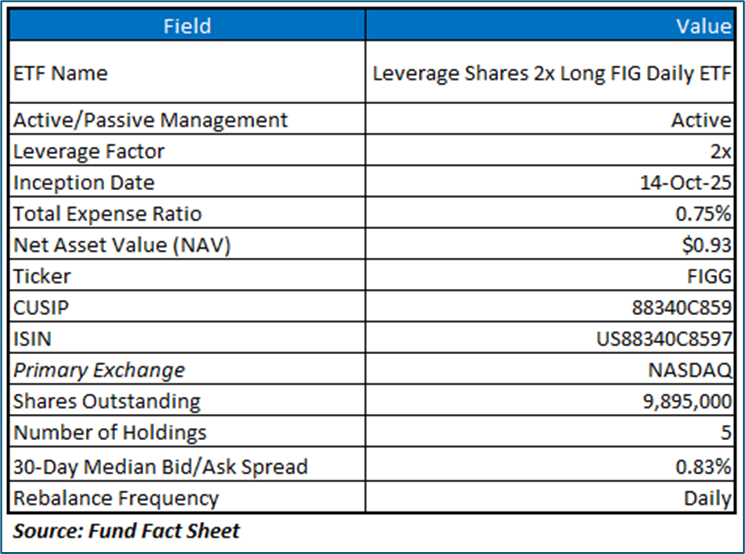
The Fund seeks daily leveraged investment results of two times (200%) the daily percentage change in the share price of Figma Inc (NYSE: FIG). The Fund may enter into one or more swap agreements with financial institutions for a specified period, which may range from one day to longer than a year.
Its performance over extended periods diverges from the expected 200% due to the compounding effect of daily returns, which is influenced by factors like holding duration and stock volatility. High volatility amplifies the impact of compounding, potentially leading to significant deviations from the underlying stock’s performance. Consequently, this ETF is designed for short-term trading rather than buy-and-hold strategies.
Underlying Stock: Figma Inc (NYSE: FIG)
Figma, Inc. (NYSE: FIG) is an AI-powered design platform that enables seamless collaboration across the entire product development lifecycle. Its products include FigJam, Figma Slides, Figma Design, Figma Draw, Dev Mode, Figma Sites, Figma Buzz and Figma Make. The company was founded by Dylan Joseph Field and Evan Darrow Wallace in 2012 and is headquartered in San Francisco, CA.

Section 2: Technical Analysis on ETF and Underlying Asset
NASDAQ: FIGG
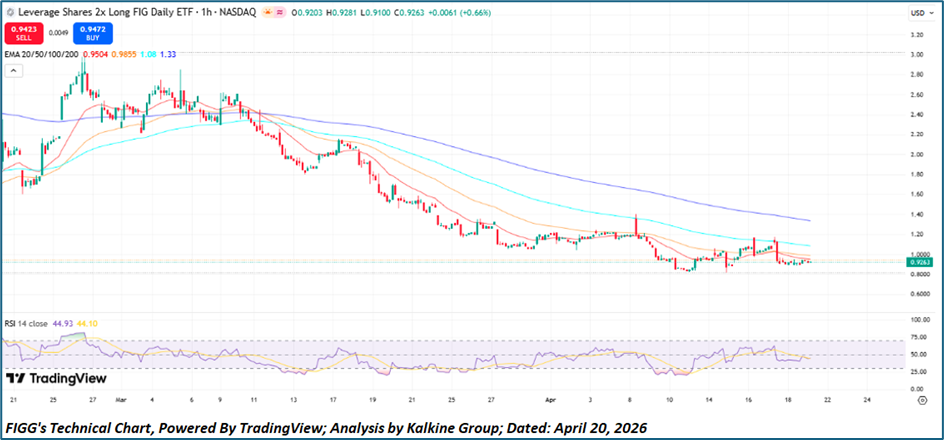
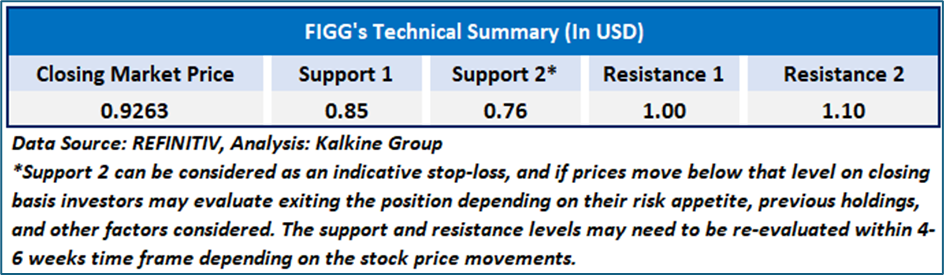
FIGG (Leverage Shares 2x Long FIG Daily ETF): FIGG is exhibiting an early-stage constructive basing structure after an extended deleveraging downtrend, with price stabilizing near the USD 0.90 region while beginning to compress beneath the short-term moving average cluster. The instrument has started to defend recent swing lows, suggesting emergent demand absorption and potential exhaustion of prior downside momentum. Although the broader trend remains technically subordinate to the declining medium- and long-duration averages, the flattening slope of the 20-EMA and improving candle symmetry imply that bearish velocity is moderating materially. Momentum internals are modestly constructive, with RSI recovering toward neutral territory and avoiding oversold re-entry, often a precursor to rotational upside attempts in high-beta leveraged structures. A sustained reclaim of the USD 0.96–1.00 resistance band would likely trigger short-covering and open scope toward the 50-EMA near USD 1.13, while maintenance above USD 0.87 preserves the developing bullish reversal thesis. Overall, FIGG remains tactically speculative but is showing nascent bullish inflection characteristics.
Underlying Asset Analysis: NASDAQ: FIG
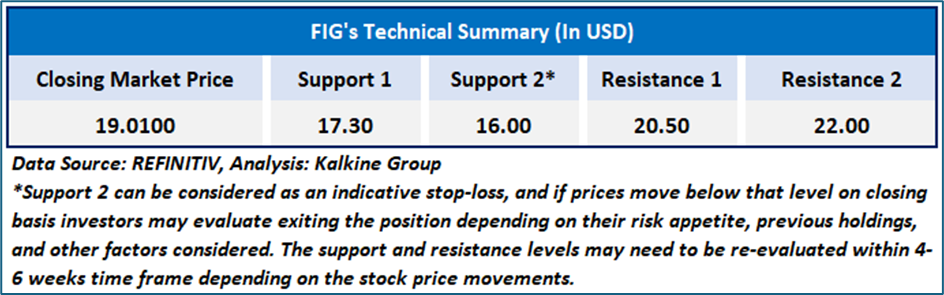
FIG (Figma Inc.): FIG is demonstrating a measured bullish recovery phase within a larger corrective cycle, having established a higher-low sequence near the USD 18.20–18.50 demand zone and subsequently reclaimed the short-term exponential averages. Price action is now consolidating just below the psychologically important USD 19.25–19.50 supply pocket, indicating healthy digestion rather than distribution. The narrowing spread between the 20-EMA and 50-EMA, combined with stabilizing momentum readings near midline RSI, suggests improving internal strength and increasing probability of a positive trend transition if resistance is breached. While the descending 100-EMA and 200-EMA continue to cap the broader macro structure, recent inability of sellers to extend downside pressure implies accumulation interest at lower levels. A decisive close above USD 19.50 would strengthen upside continuation odds toward USD 20.20 and potentially USD 21.80, whereas sustained trade above USD 18.60 keeps the near-term bullish bias intact. In aggregate, FIG appears modestly bullish with improving technical posture and favorable risk-reward asymmetry.
Section 1: GraniteShares 2x Long NOW Daily ETF (NASDAQ: NOWL):
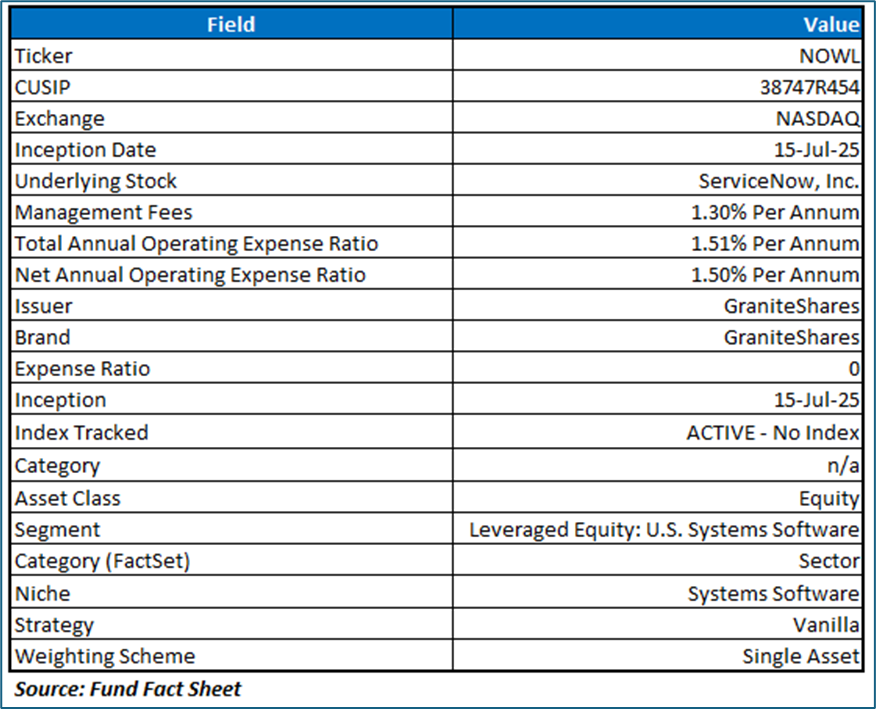
The Fund seeks daily investment results, before fees and expenses, of two times (200%) the daily percentage change in the share price of ServiceNow, Inc. (NYSE: NOW). The Fund is an actively managed ETF that attempts to achieve two times the daily percentage change in the share price of the Underlying Security.
Its performance over extended periods diverges from the expected 200% due to the compounding effect of daily returns, which is influenced by factors like holding duration and stock volatility. High volatility amplifies the impact of compounding, potentially leading to significant deviations from the underlying stock’s performance. Consequently, this ETF is designed for short-term trading rather than buy-and-hold strategies.
Underlying Stock: ServiceNow, Inc. (NYSE: NOW)
ServiceNow, Inc. engages in the provision of an end-to-end workflow automation platform for digital businesses. Its Now Platform is a cloud-based solution embedded with artificial intelligence (AI) and machine learning (ML). The company was founded by Frederic B. Luddy in June 2004 and is headquartered in Santa Clara, CA.

Section 2: Technical Analysis on ETF and Underlying Asset
NASDAQ: NOWL
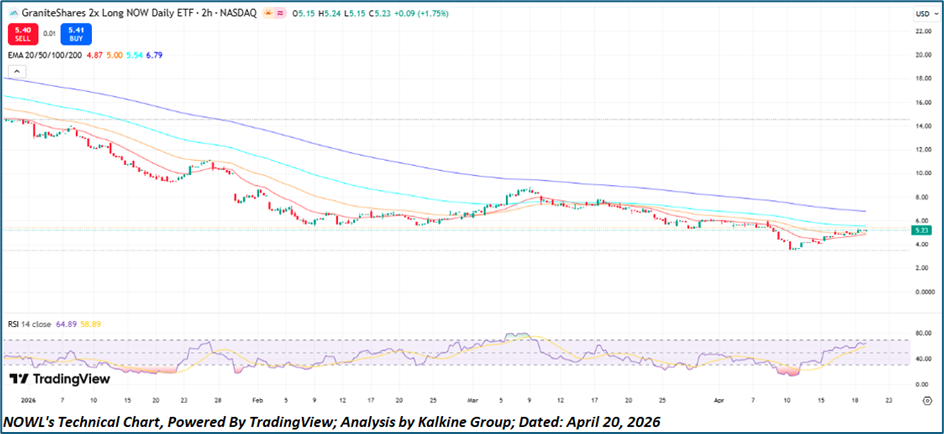
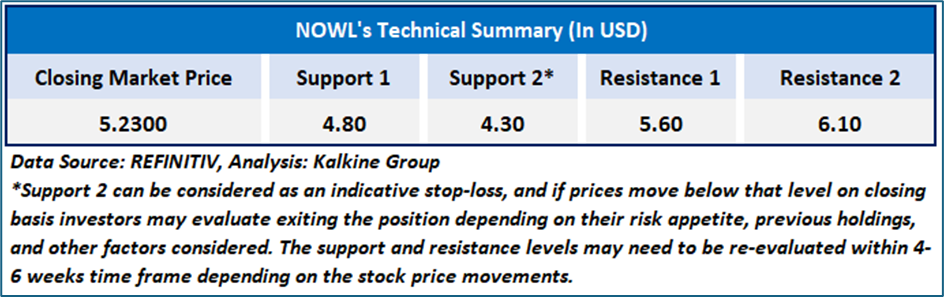
NOWL (GraniteShares 2x Long NOW Daily ETF): NOWL is demonstrating a notable early-stage bullish reversal profile after completing a prolonged multi-month capitulation sequence and establishing a credible higher-low base in the USD 3.60–4.00 accumulation zone. Price has since reclaimed the full short-term moving-average cluster, with the 20-EMA crossing decisively above the 50-EMA and both averages turning upward, signaling a material improvement in trend impulse. The recent advance toward the USD 5.20 region appears orderly rather than euphoric, suggesting sustainable rotation rather than exhaustion. Momentum internals remain constructive, with RSI pressing into upper-neutral territory while avoiding extreme overbought conditions, which often supports continuation in recovering leveraged vehicles. Although the declining 100-EMA and 200-EMA still define the broader macro headwind, sustained trade above USD 4.85 preserves the bullish transition thesis, while a breakout through USD 5.35 could accelerate upside extension toward USD 5.80 and potentially USD 6.70. Overall, NOWL retains a cautiously bullish tactical posture with improving trend quality and favorable asymmetry if momentum persists.
Underlying Asset Analysis: NYSE: NOW
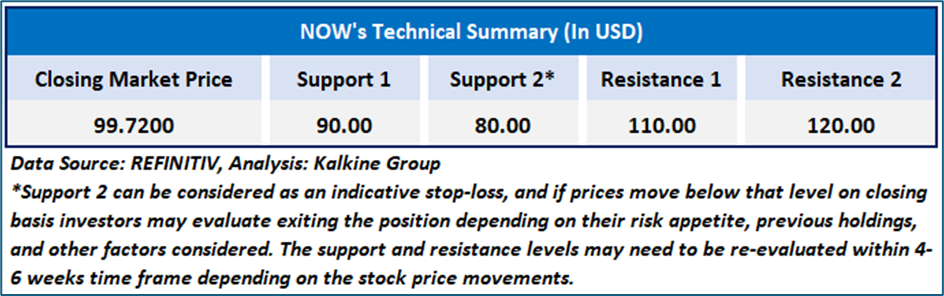
NOW (ServiceNow Inc.): NOW is exhibiting a measured recovery structure within a broader corrective regime, having successfully defended the recent capitulation low near the mid-USD 80s and subsequently rebuilding price acceptance toward the USD 100 psychological threshold. The stock has reclaimed its 20-EMA and 50-EMA, both of which are now curling higher, indicating that short-term demand is reasserting control after an extended decline. Recent consolidation beneath the USD 100–101 resistance pocket appears constructive, reflecting gain digestion rather than active distribution. RSI has advanced into supportive upper-mid territory, confirming improving momentum breadth without yet signaling excessive extension. While the descending 100-EMA and 200-EMA continue to represent medium-term overhead supply, the inability of sellers to force a retest of prior lows materially strengthens the probability of trend normalization. A decisive close above USD 101 would likely open continuation toward USD 104 and then USD 108, whereas sustained holding above USD 96 preserves the current bullish bias. In aggregate, NOW carries a modestly bullish near-term technical outlook with improving internal structure and increasing breakout potential.
Related Risk: Investing in the Fund carries inherent risks, including potential losses. The Fund's NAV and performance are influenced by various factors. Key risks include the effects of compounding, market volatility, and underlying stock risks, which can significantly impact returns and increase the likelihood of financial losses.

Kalkine Equities LLC, with Delaware File Number 4697384, Foreign Qualification Registration in California File Number 202109211078, and Texas File Number 805521396, is authorized to provide general advice only. The information on https://kalkine.com/ does not take into account any of your investment objectives, financial situation or needs. You should consider the appropriateness of advice taking into account your own objectives, financial situation and needs and seek independent financial advice before making any financial decisions. The link to our Terms and Conditions and Privacy Policy has been provided for your reference. On the date of publishing the reports (mentioned on the website), employees and/or associates of Kalkine do not hold positions in any of the stocks covered on the website. These stocks can change any time and readers of the reports should not consider these stocks as advice or recommendations later.
Past performance is not a reliable indicator of future performance.
 Please wait processing your request...