
 CA
 NZ
 UK
 AU
 IND

 US

Section 1: Company Overview and Fundamentals
1.1 Company Overview:
Tesla, Inc (NASDAQ: TSLA) is a vertically integrated clean energy and electric vehicle company engaged in the design, development, manufacturing, and sale of fully electric vehicles and energy solutions. Its operations are divided into two core segments: automotive, which includes vehicle sales, leasing, regulatory credits, and related services such as maintenance, insurance, and charging; and energy generation and storage, which focuses on solar products and battery storage systems like Powerwall and Megapack.
Kalkine’s Low Carbon Research Report covers the Investment Highlights, Low Carbon Emission Initiatives, Key Financial Metrics, Risks, and Technical Analysis along with the Valuation, Target Price, and Recommendation on the stock.
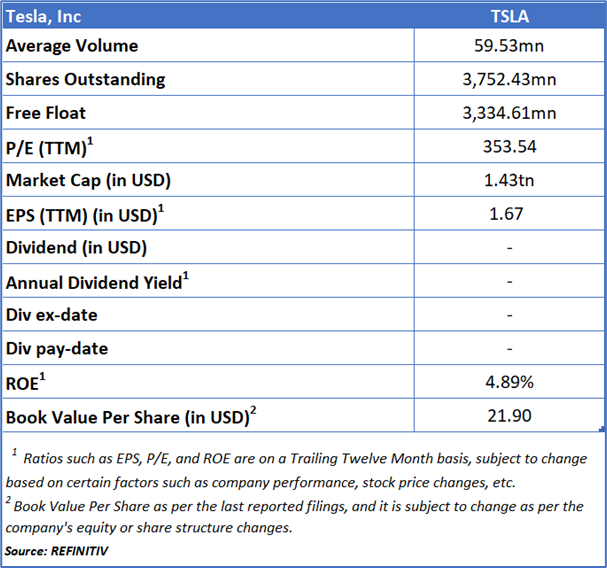
Stock Performance:
1.2 Why do Low Carbon Emissions matter?
The shift toward a low-carbon economy is one of the most significant challenges of current time, spurred by the urgent need to combat climate change and reduce the environmental impact of corporate activities. This report covers the US-listed low-carbon emission company; Tesla, Inc (NASDAQ: TSLA), that is committed to sustainability and responsible environmental practices.

Waste Efficiency Moderation Amid Sustained Recycling Strength Signals Scaling Pressures
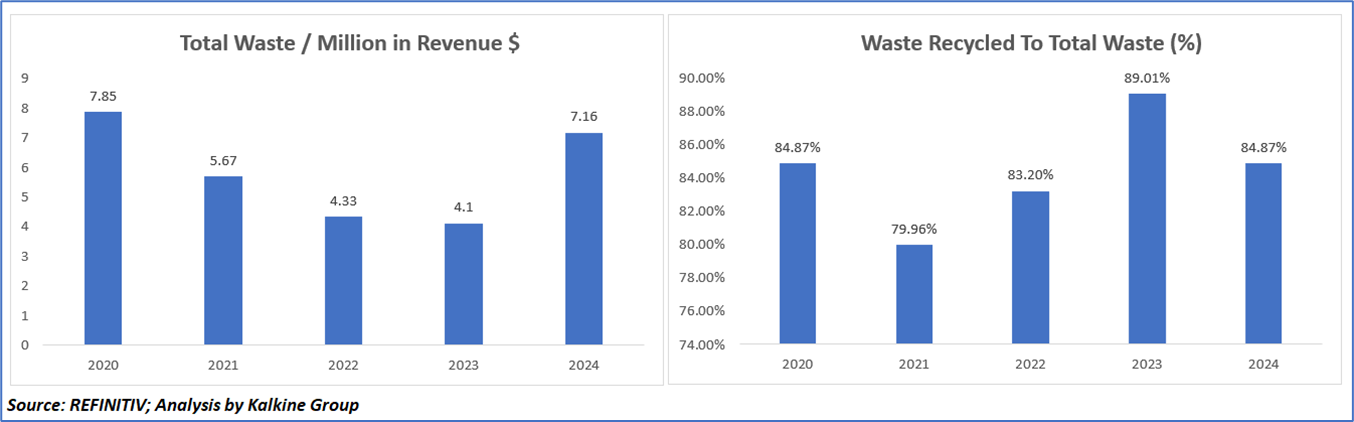
The company’s waste management performance reflects a strong improvement phase followed by a partial reversal, indicating emerging scale-related challenges. Total waste per million in revenue declined significantly from 7.85 in 2020 to 4.10 in 2023, highlighting enhanced operational efficiency and process optimization; however, it increased to 7.16 in 2024, suggesting rising waste generation relative to revenue, potentially driven by expansion or changes in operational mix. In contrast, recycling efficiency remained comparatively resilient, improving from 79.96% in 2021 to a peak of 89.01% in 2023 before moderating to 84.87% in 2024, indicating that waste processing capabilities remain robust despite higher volumes. The divergence between rising waste intensity and stable recycling rates in 2024 points to an operational imbalance, where upstream waste generation has increased even as downstream recycling remains effective, underscoring the need for renewed focus on source reduction and efficiency as the company scales.
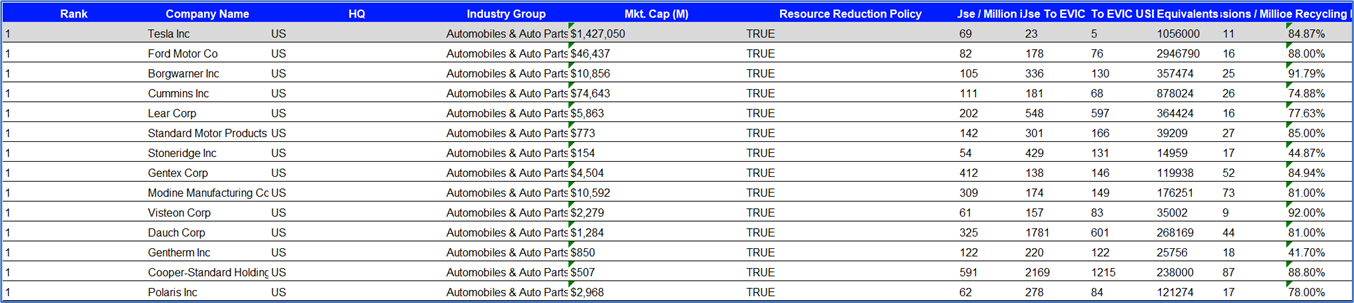
Peer Comparison:
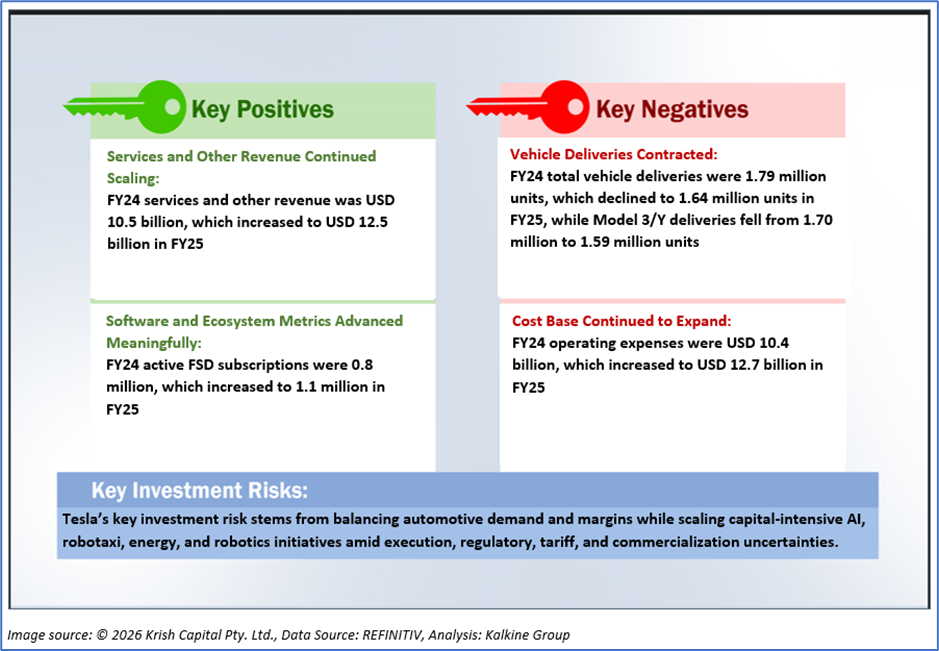
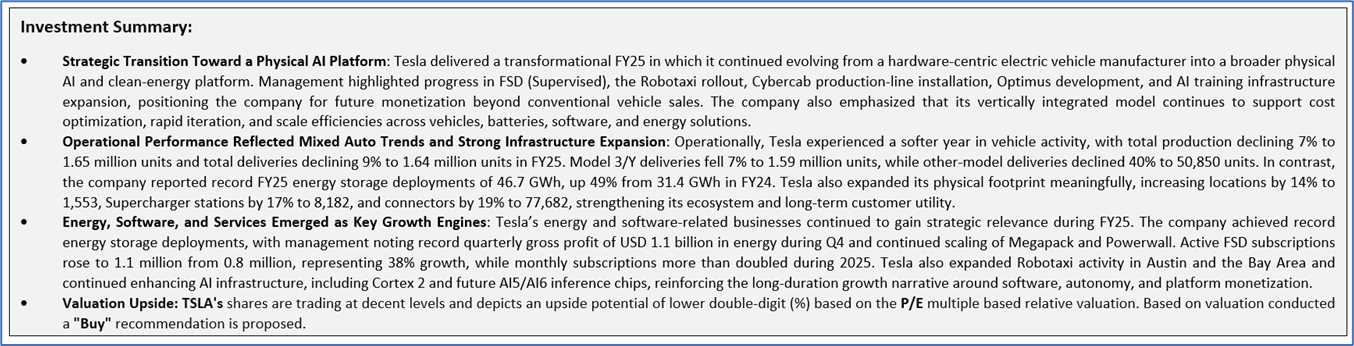
1.2 The Key Positives, Negatives, and Investment summary
1.3 Top 10 shareholders:
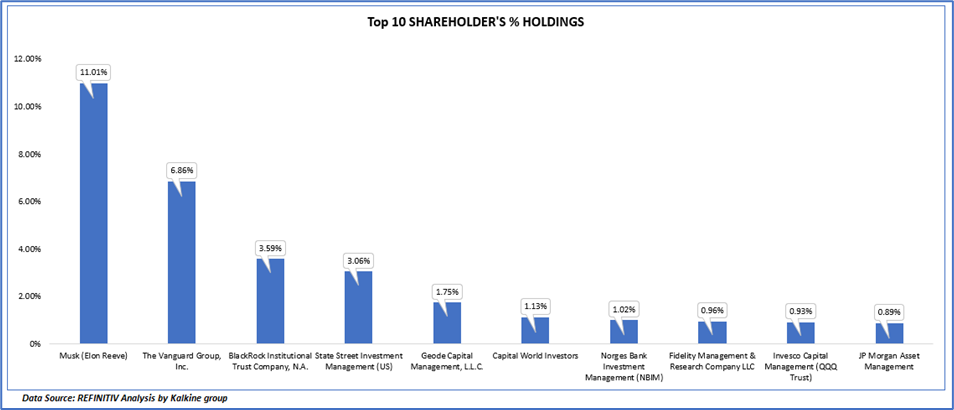
The top 10 shareholders together form ~31.21% of the total shareholding, signifying concentrated shareholding. Musk (Elon Reeve) and The Vanguard Group, Inc. are the biggest shareholders, holding the maximum stake in the company at 11.01% and 6.86%, respectively.
1.4 Key Metrics
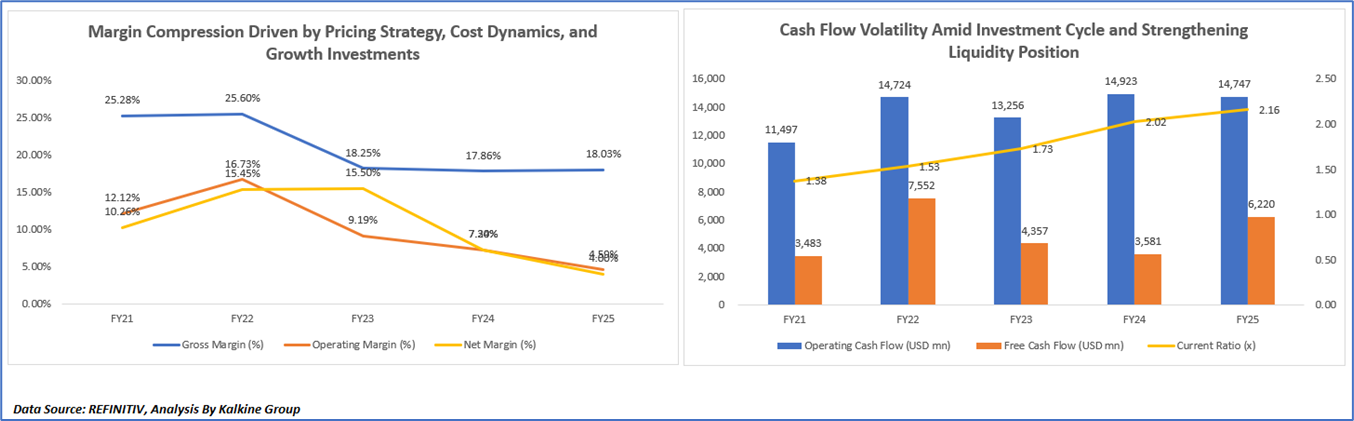
Margin Compression Driven by Pricing Strategy, Cost Dynamics, and Growth Investments
Tesla’s margin trajectory from FY21 to FY25 reflects a transition from a phase of strong profitability expansion to a period of strategic compression driven by deliberate business decisions. Margins expanded sharply in FY21–FY22 on the back of higher vehicle deliveries, favorable pricing, operating leverage, and cost efficiencies from localized production and scale benefits. However, from FY22 onward, margins declined as the company adopted an aggressive pricing strategy to enhance affordability and sustain demand, resulting in lower average selling prices and weaker automotive profitability. This pressure was further compounded by reduced contribution from high-margin software revenues and an unfavorable product mix. Simultaneously, rising operating expenses—primarily linked to investments in artificial intelligence, autonomy, robotics, and next-generation platforms—diluted operating and net margins. Additional headwinds included input cost volatility, higher logistics and warranty expenses, and lower fixed-cost absorption due to fluctuating production levels. Although cost optimization initiatives and declining raw material prices supported some stabilization in gross margins by FY24–FY25, continued investment intensity and infrastructure expansion kept overall profitability under pressure. Overall, the trend underscores Tesla’s strategic shift from maximizing near-term automotive margins toward building a long-duration, higher-value ecosystem centered on AI, software, and energy solutions.
Cash Flow Volatility Amid Investment Cycle and Strengthening Liquidity Position
Tesla’s cash flow trend from FY21 to FY25 highlights a combination of resilient operating performance and investment-driven volatility, with operating cash flow remaining consistently strong due to higher vehicle deliveries, revenue growth, and operational efficiencies, while free cash flow fluctuated significantly as a result of elevated capital expenditures toward factory expansion, AI infrastructure, battery production, and next-generation platforms; despite these fluctuations, the company continued to strengthen its liquidity position, as reflected in the steady improvement in its current ratio, supported by sustained positive cash generation, disciplined balance sheet management, and increasing cash reserves, underscoring Tesla’s ability to internally fund its long-term growth initiatives while navigating an intensive investment cycle.
Section 2: Business Updates and Corporate Business Highlights
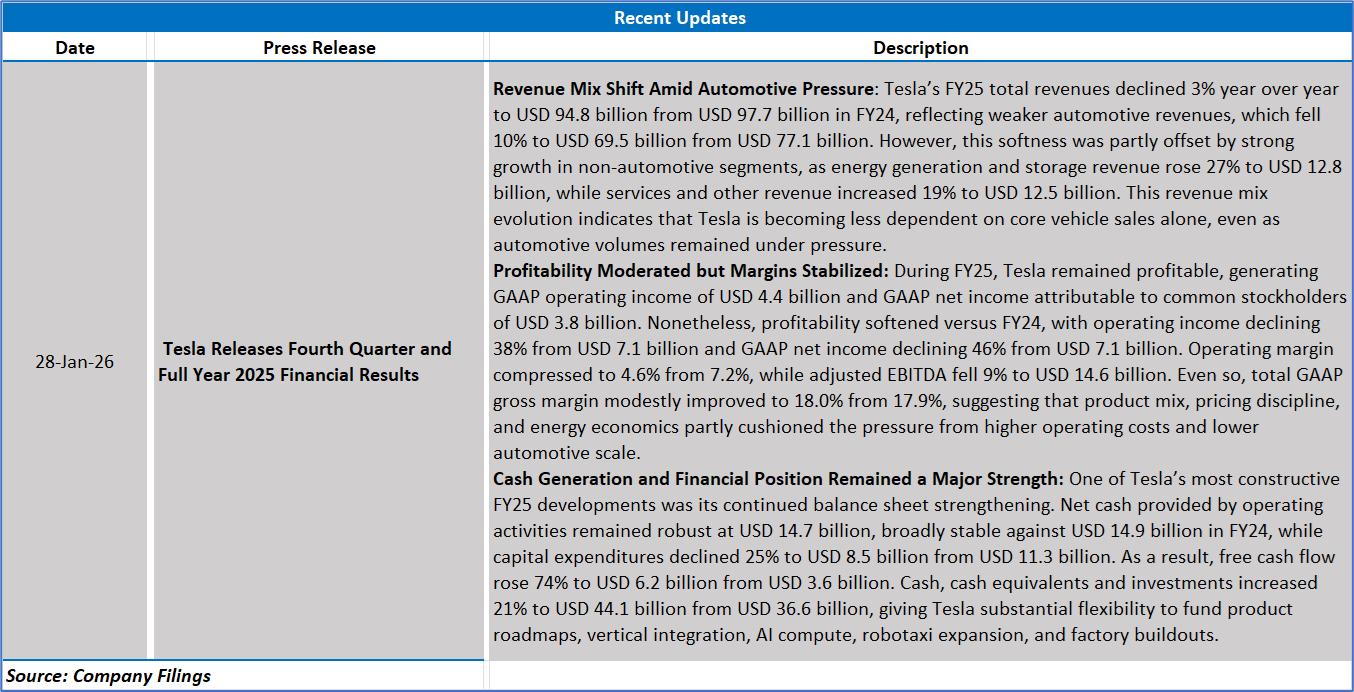
2.1 Key Business Updates:
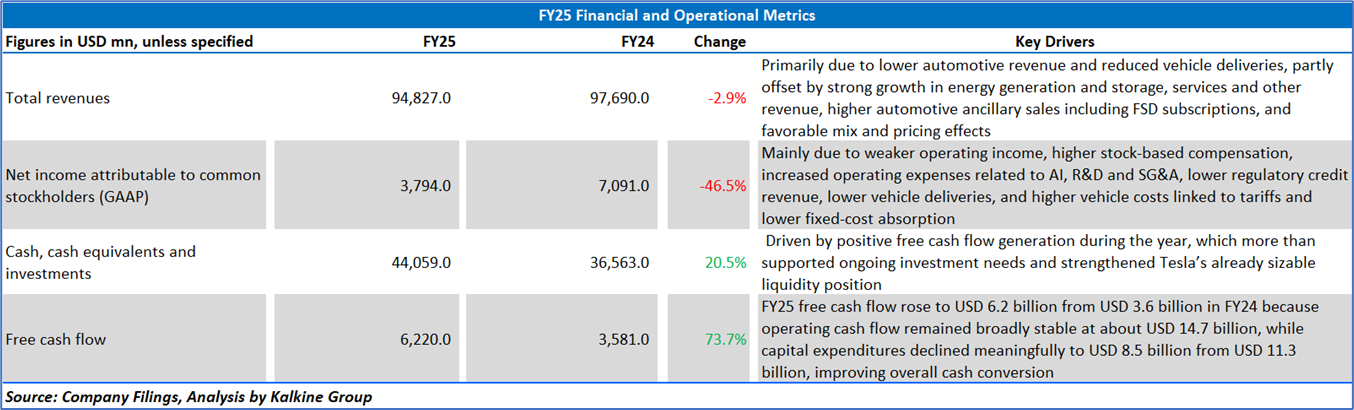
2.2 Insights of FY25:
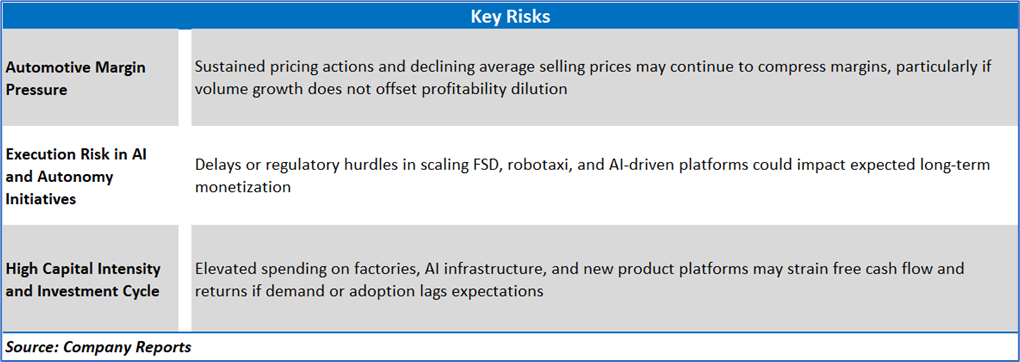
Section 3: Key Risks & Outlook
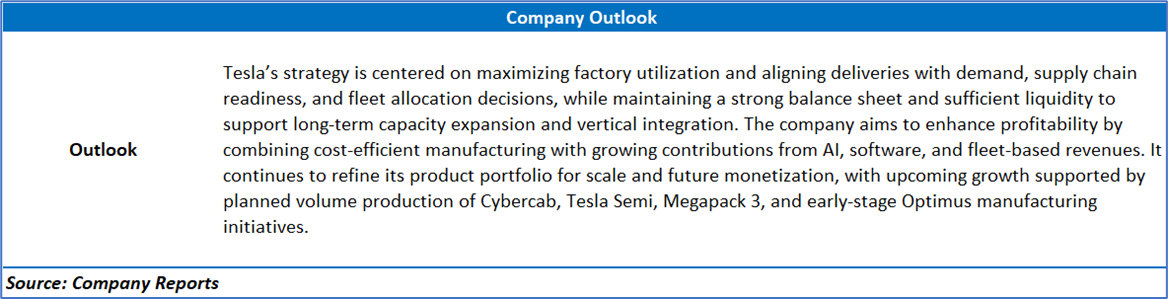
Section 4: Stock Recommendation Summary:
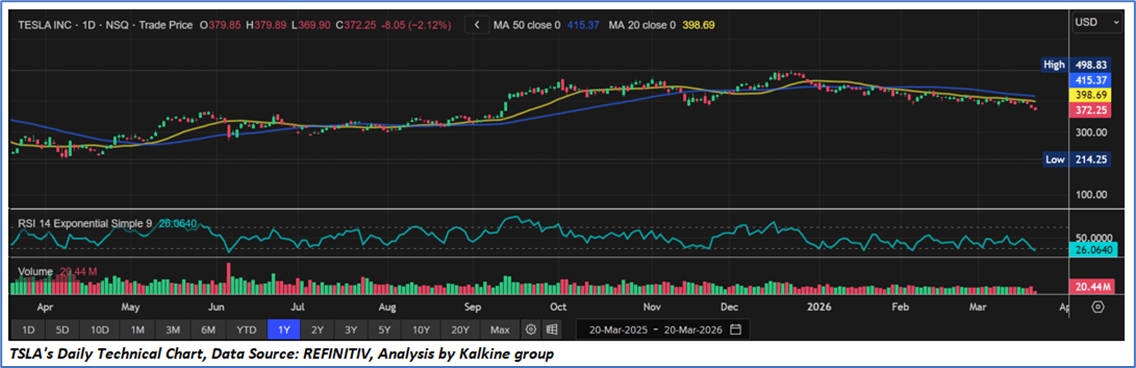
4.1 Price Performance and Technical Summary:
Stock Performance:
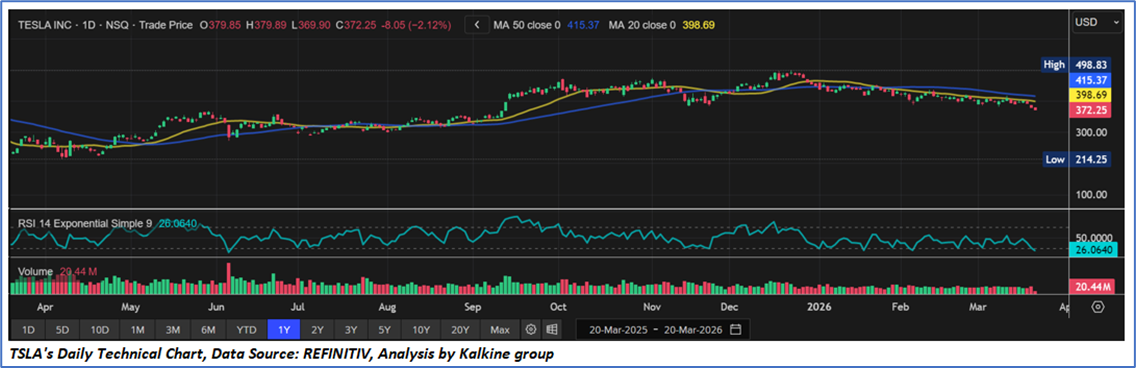
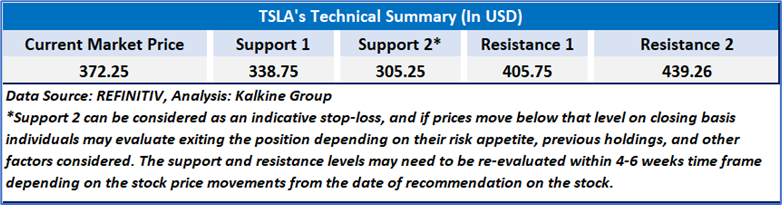
4.2 Fundamental Valuation
Valuation Methodology: Price/Earnings Per Share (P/E) Multiple Based Relative Valuation
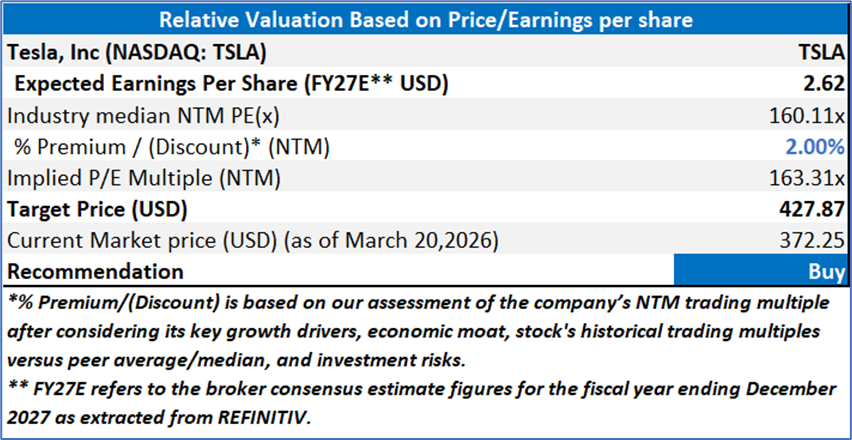
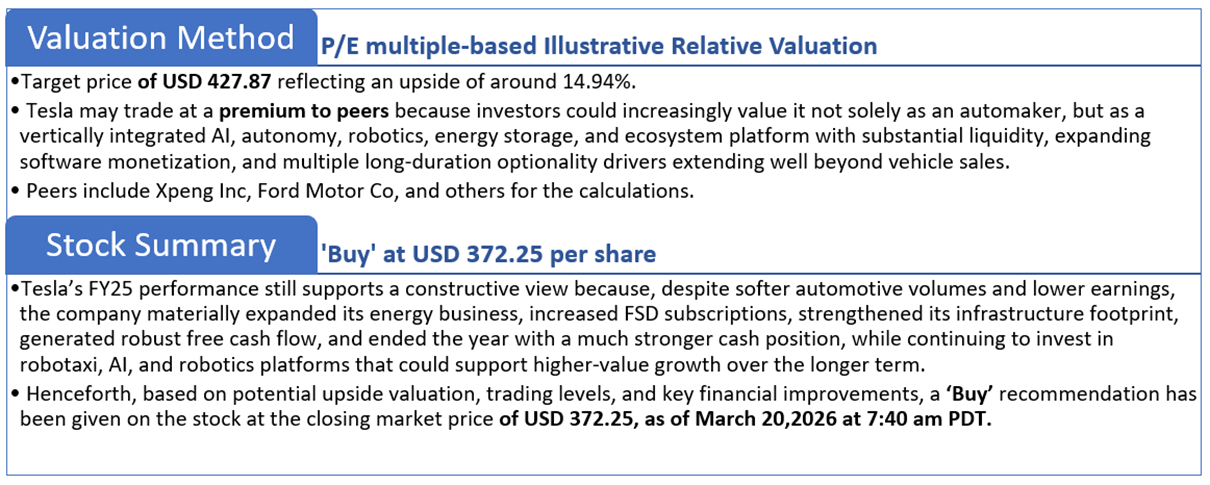
Markets are trading in a highly volatile zone currently due to certain macroeconomic issues and geopolitical tensions prevailing. Therefore, it is prudent to follow a cautious approach while investing.
Note 1: Past performance is not a reliable indicator of future performance.
Note 2: The reference date for all price data, currency, technical indicators, support, and resistance levels is Mar 20,2026. The reference data in this report has been partly sourced from REFINITIV.
Note 3: Investment decisions should be made depending on an individual's appetite for upside potential, risks, holding duration, and any previous holdings. An 'Exit' from the stock can be considered if the Target Price mentioned as per the Valuation and or the technical levels provided has been achieved and is subject to the factors discussed above.
Note 4: The report publishing date is as per the Pacific Time Zone.
Technical Indicators Defined: -
Support: A level at which the stock prices tend to find support if they are falling, and a downtrend may take a pause backed by demand or buying interest. Support 1 refers to the nearby support level for the stock and if the price breaches the level, then Support 2 may act as the crucial support level for the stock.
Resistance: A level at which the stock prices tend to find resistance when they are rising, and an uptrend may take a pause due to profit booking or selling interest. Resistance 1 refers to the nearby resistance level for the stock and if the price surpasses the level, then Resistance 2 may act as the crucial resistance level for the stock.
Stop-loss: It is a level to protect against further losses in case of unfavorable movement in the stock prices.
Kalkine Equities LLC, with Delaware File Number 4697384, Foreign Qualification Registration in California File Number 202109211078, and Texas File Number 805521396, is authorized to provide general advice only. The information on https://kalkine.com/ does not take into account any of your investment objectives, financial situation or needs. You should consider the appropriateness of advice taking into account your own objectives, financial situation and needs and seek independent financial advice before making any financial decisions. The link to our Terms and Conditions and Privacy Policy has been provided for your reference. On the date of publishing the reports (mentioned on the website), employees and/or associates of Kalkine do not hold positions in any of the stocks covered on the website. These stocks can change any time and readers of the reports should not consider these stocks as advice or recommendations later.
Past performance is not a reliable indicator of future performance.
 Please wait processing your request...