
 CA
 NZ
 UK
 AU
 IND

 US

Section 1: Company Overview and Fundamentals
1.1 Company Overview:
ServiceNow, Inc. (NYSE: NOW) is a global leader in AI-powered enterprise workflow automation, headquartered in Santa Clara, California. Founded in 2004, the company has evolved from an IT service management (ITSM) pioneer into a comprehensive AI Control Tower platform that orchestrates business processes across IT, HR, customer service, security, and operations for over 8,100 enterprise customers worldwide. At its core, ServiceNow's Now Platform serves as the operating system of the enterprise connecting fragmented systems, automating complex workflows, and applying agentic AI to drive end-to-end business outcomes.
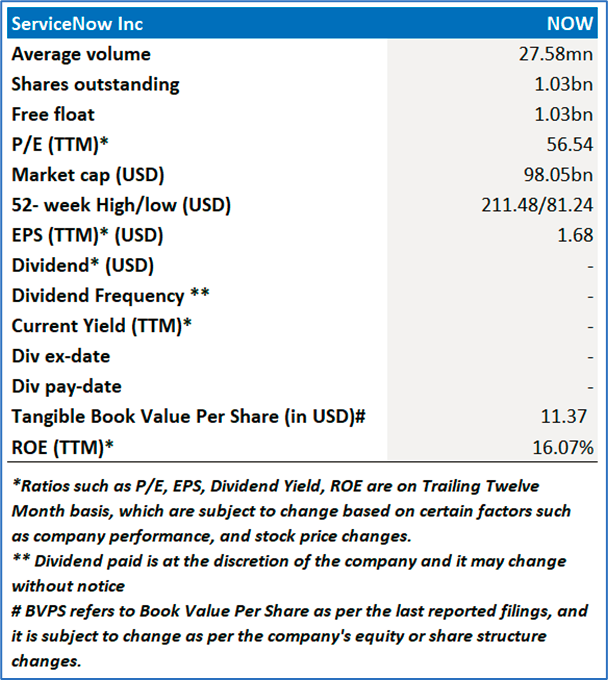
Kalkine’s American Tech Report covers the Company Overview, Key positives & negatives, Investment summary, Key investment metrics, Top 10 shareholding, Business updates and insights into company recent financial results, Key Risks & Outlook, Price performance and technical summary, Target Price, and Recommendation on the stock.
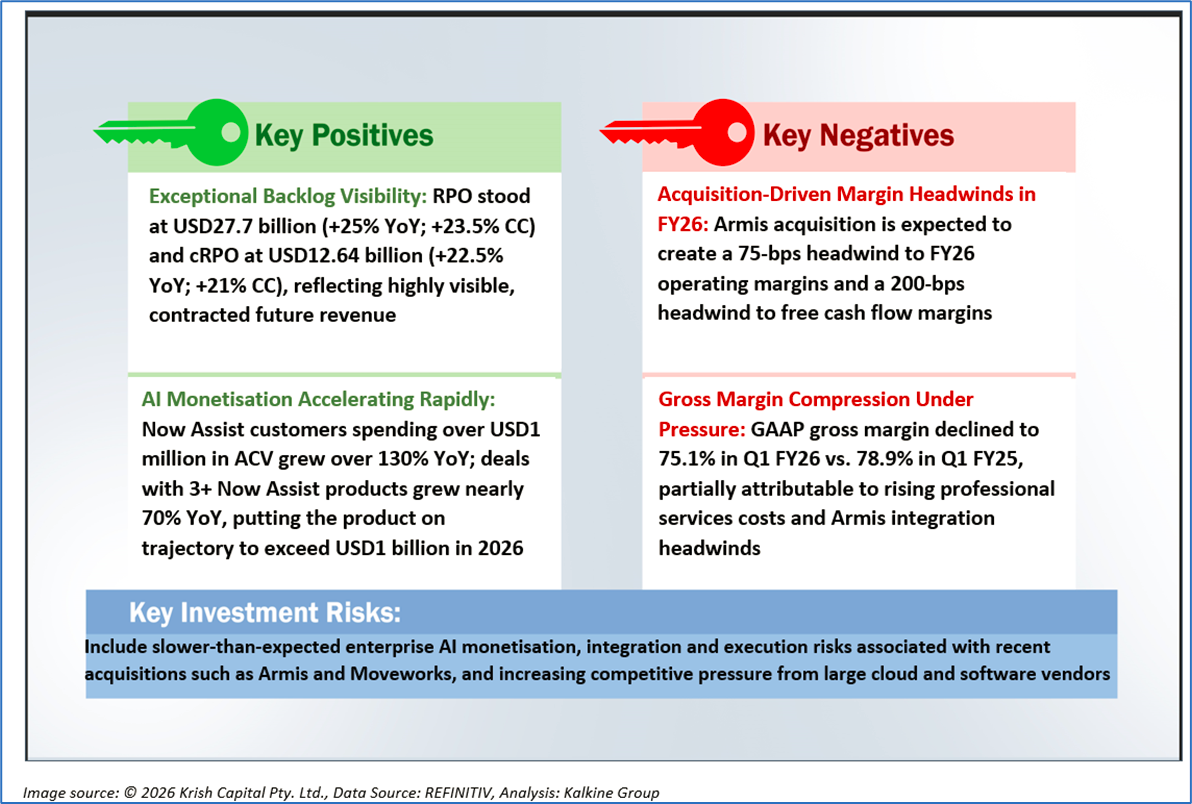
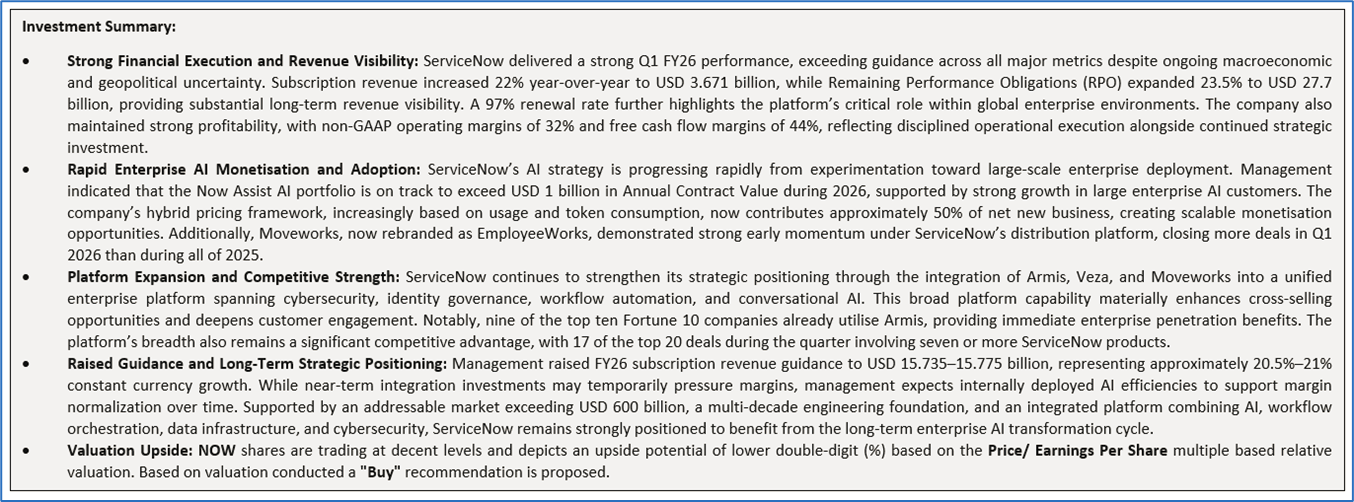
1.2 The Key Positives, Negatives, and Investment summary
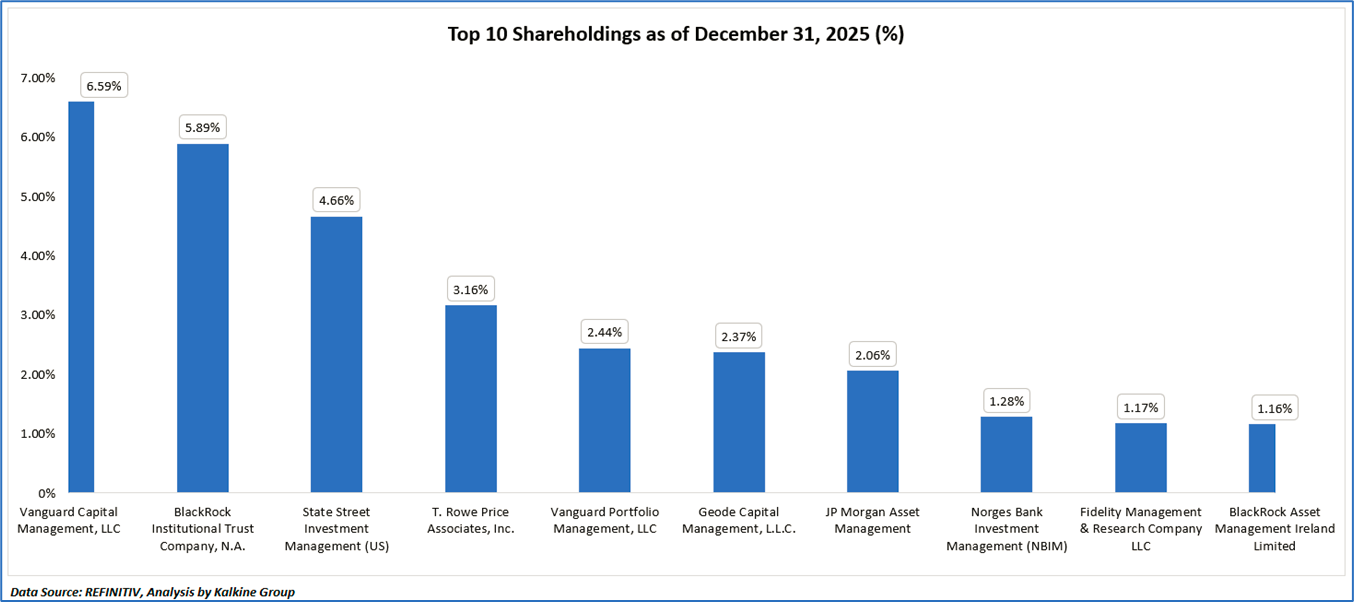
1.3 Top 10 shareholders:
The top 10 shareholders together form ~30.78% of the total shareholding, signifying dispersed shareholding. Vanguard Capital Management, LLC and BlackRock Institutional Trust Company, N.A. are the biggest shareholders, holding the maximum stake in the company at ~6.59% and ~5.89%, respectively.
1.4 Key Metrics:
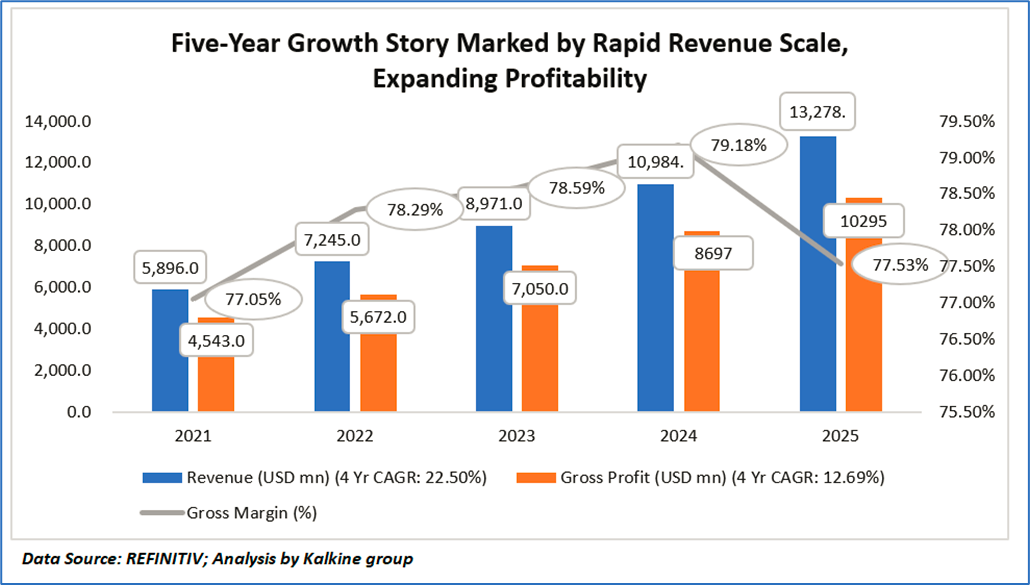
Revenue Growth and Business Expansion: ServiceNow has demonstrated exceptionally strong and consistent top-line expansion over the last five years, with revenue increasing from USD 5.90 billion in 2021 to USD 13.28 billion in 2025, representing a robust four-year CAGR of 22.5%. The company sustained double-digit annual growth throughout the period, reflecting continued enterprise adoption of its workflow automation, cloud, and AI-driven platform offerings. Revenue acceleration in 2024 and 2025 further indicates strengthening enterprise demand, expanding product penetration, and increasing wallet share across large global customers. This growth trajectory highlights ServiceNow’s ability to scale efficiently within the rapidly expanding enterprise digital transformation and AI software markets.
Gross Profit Expansion and Operating Scalability: Gross profit increased from USD 4.54 billion in 2021 to approximately USD 10.30 billion in 2025, reflecting strong underlying operating scalability and consistent monetisation strength. Although gross profit CAGR of 12.69% trailed revenue growth due to elevated infrastructure and platform investment requirements, the company maintained exceptionally high absolute profitability levels throughout the period. The steady expansion in gross profit demonstrates ServiceNow’s ability to convert incremental revenue into substantial earnings contribution while continuing to invest aggressively in product innovation, AI capabilities, and strategic acquisitions.
Gross Margin Stability and Profitability Quality: ServiceNow maintained industry-leading gross margins across the entire period, consistently remaining above 77%, which reflects the highly scalable nature of its enterprise software and subscription-based business model. Gross margins improved steadily from 77.05% in 2021 to a peak of 79.18% in 2024, supported by operational efficiencies, scale benefits, and a higher mix of recurring subscription revenues. The modest decline to 77.53% in 2025 likely reflects temporary margin pressures associated with AI infrastructure investments, cloud compute costs, and integration expenses related to recent acquisitions. Nevertheless, profitability levels remain exceptionally strong relative to broader enterprise software peers.
Section 2: Business Updates and Financial Highlights
2.1 Recent Updates:
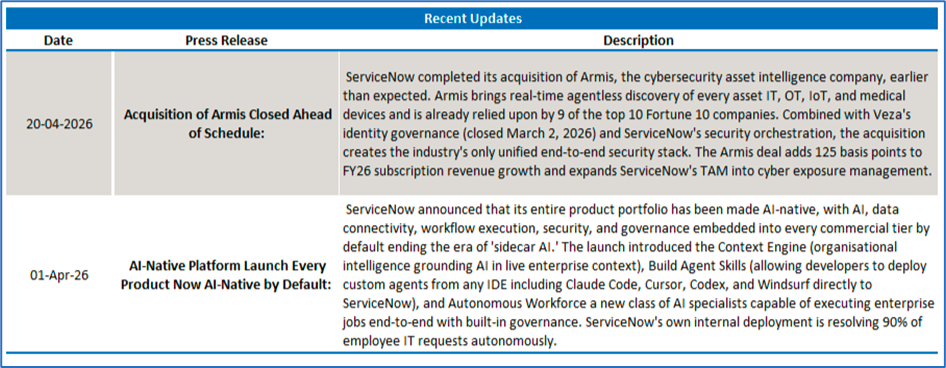
The below picture gives an overview of the recent updates:
2.2 Insights of Q1FY26:
Section 3: Key Risks and Outlook:
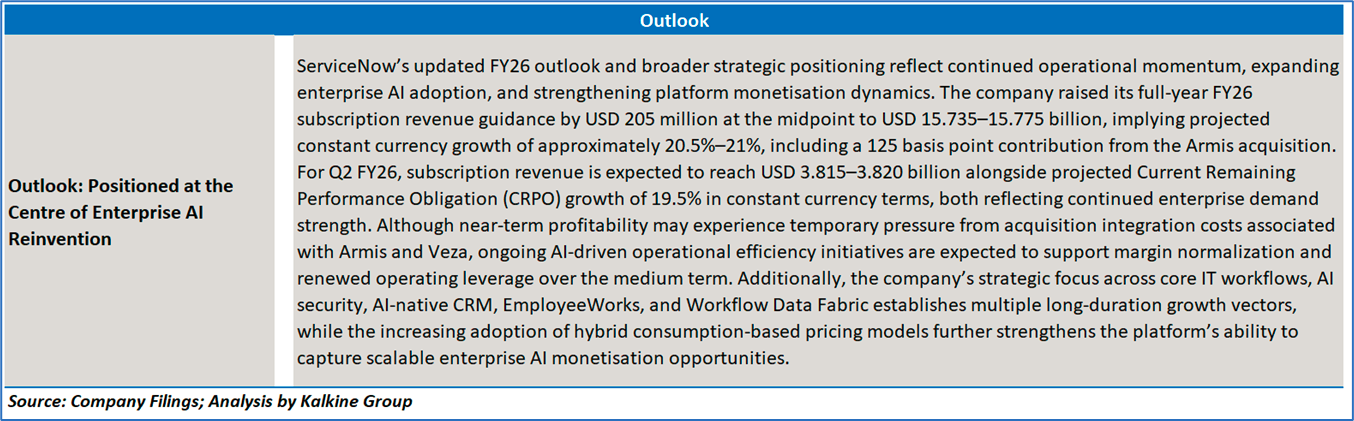
Section 4: Stock Recommendation Summary:
4.1 Technical Summary:
Price Performance:
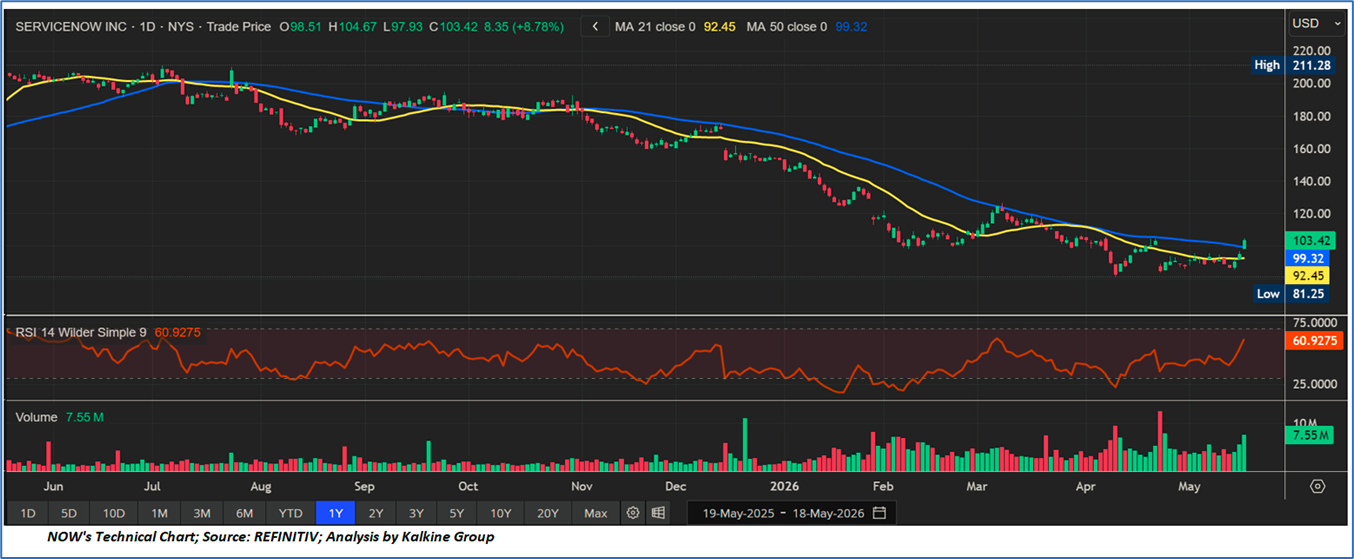
Trend Structure and Moving Average Alignment: NOW has remained within a pronounced medium-term corrective trend over the past twelve months, declining from a 52-week high of USD 211.28 to a low of USD 81.25, representing an approximate peak-to-trough correction of 62%. Nevertheless, recent price action suggests the emergence of an early-stage recovery structure, with the stock closing at USD 103.42 following a strong single-session gain of 8.78%. Importantly, the stock has decisively reclaimed both the 21-day moving average, currently positioned near USD 92.45, and the 50-day moving average at approximately USD 99.32. This dual moving average breakout is technically significant, as it frequently precedes broader stabilization or recovery phases following extended downtrends. Although both moving averages continue to exhibit downward slopes — confirming that the broader primary trend remains structurally bearish — the successful price crossover above these levels indicates improving short-term momentum and strengthening buyer participation. A sustained consolidation above the 50-day moving average over multiple sessions would represent an important technical confirmation that the stock may be transitioning from a downtrend into a broader recovery or consolidation phase.
Momentum Indicators and RSI Behaviour: Momentum indicators have also strengthened materially in recent sessions. The Relative Strength Index (RSI), measured using the 14-period Wilder methodology, is currently positioned near 60.93, a level that is both technically constructive and increasingly supportive of improving momentum conditions. Following an extended period during which RSI remained largely confined within the 25–50 range — typically associated with weak momentum and corrective market behaviour — the recent recovery above the 50 midpoint suggests a meaningful shift in sentiment and buying strength. Importantly, the RSI remains below traditional overbought territory above 70, indicating that additional momentum expansion remains technically possible before exhaustion signals emerge. The sharp V-shaped recovery in RSI from deeply oversold conditions observed during April 2026 closely resembles prior recovery structures historically seen in the stock and suggests that the recent advance is being supported by genuine accumulation rather than temporary short-covering or low-conviction relief buying. Continued RSI stability above the 55–60 range would further reinforce the probability of ongoing price stabilization and additional near-term upside potential.
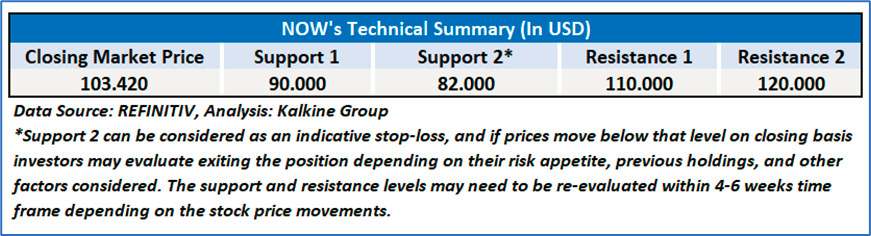
Volume Dynamics and Key Technical Levels: Volume characteristics further strengthen the constructive near-term technical outlook. Trading activity increased materially during the recent breakout session, with approximately 7.55 million shares traded alongside the 8.78% price advance, indicating elevated institutional participation and stronger conviction behind the move. Such high-volume upside breakouts are generally viewed as more technically reliable than low-volume rebounds, as they often reflect broader participation from larger market participants. From a technical perspective, immediate support is now positioned near USD 99.32, corresponding to the 50-day moving average, while secondary support is located near the 21-day moving average at approximately USD 92.45. Longer-term structural support remains established near the April 2026 low of USD 81.25. On the upside, the first significant resistance zone is positioned between USD 110 and USD 115, representing a prior consolidation region observed during March and April 2026. Beyond this range, more substantial resistance emerges near USD 130–140, while the broader descending trendline originating from the USD 211.28 high currently intersects near the USD 120–125 region, making this a critical technical barrier for any sustained medium-term recovery. Overall, the technical setup has improved meaningfully in the short term following the dual moving average breakout, RSI recovery, and elevated volume participation, although sustained confirmation above key resistance zones remains necessary to fully validate a broader bullish trend reversal.
4.2 Fundamental Valuation
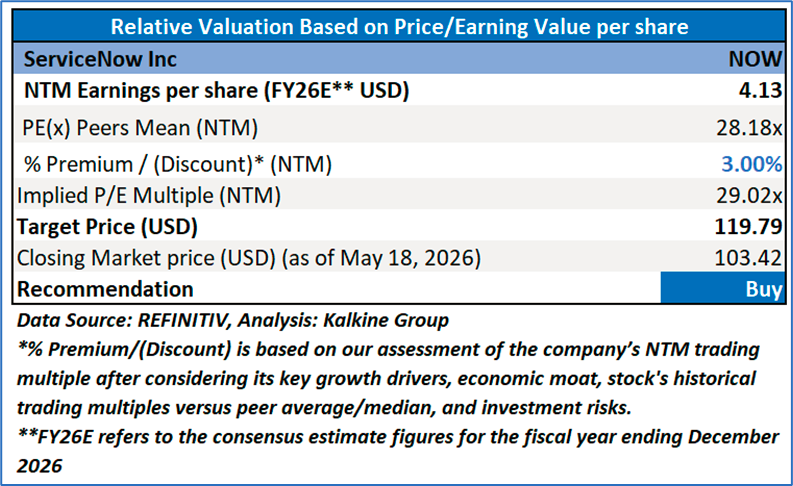
Valuation Methodology: Price/Earnings Per Share Multiple Based Relative Valuation
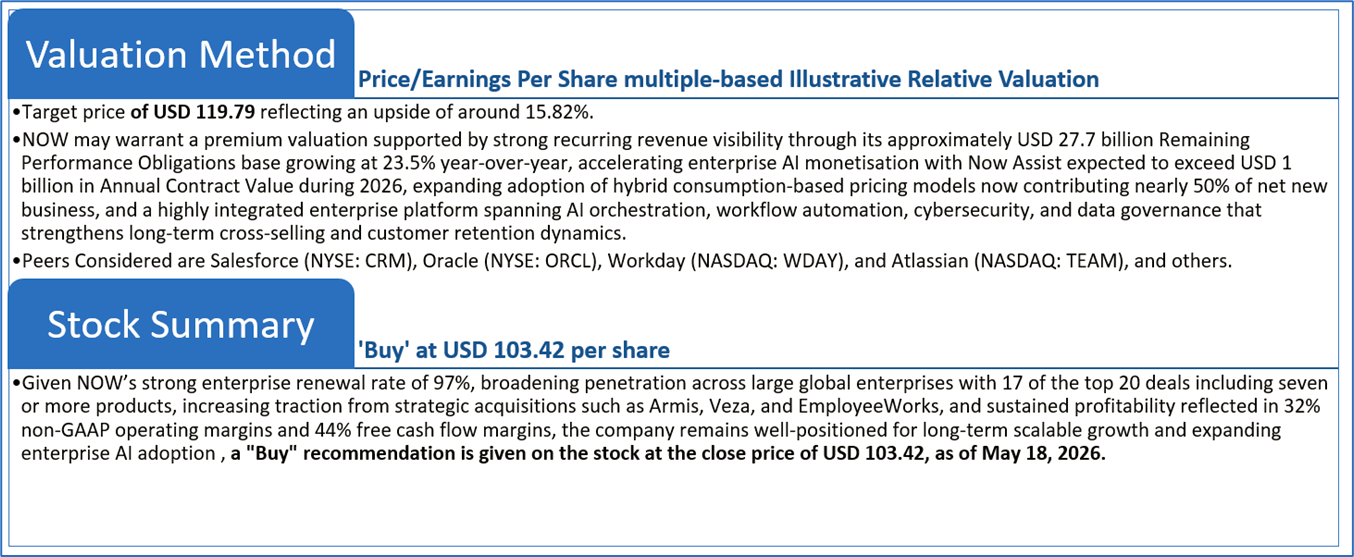
Markets are trading in a highly volatile zone currently due to certain macroeconomic issues and geopolitical tensions prevailing. Therefore, it is prudent to follow a cautious approach while investing.
Note 1: Past performance is not a reliable indicator of future performance.
Note 2: The reference date for all price data, currency, technical indicators, support, and resistance levels is May 18, 2026. The reference data in this report has been partly sourced from REFINITIV.
Note 3: Investment decisions should be made depending on an individual's appetite for upside potential, risks, holding duration, and any previous holdings. An 'Exit' from the stock can be considered if the Target Price mentioned as per the Valuation and or the technical levels provided has been achieved and is subject to the factors discussed above.
Note 4: The report publishing date is as per the Pacific Time Zone.
Technical Indicators Defined: -
Support: A level at which the stock prices tend to find support if they are falling, and a downtrend may take a pause backed by demand or buying interest. Support 1 refers to the nearby support level for the stock and if the price breaches the level, then Support 2 may act as the crucial support level for the stock.
Resistance: A level at which the stock prices tend to find resistance when they are rising, and an uptrend may take a pause due to profit booking or selling interest. Resistance 1 refers to the nearby resistance level for the stock and if the price surpasses the level, then Resistance 2 may act as the crucial resistance level for the stock.
Stop-loss: It is a level to protect against further losses in case of unfavorable movement in the stock prices.
Kalkine Equities LLC, with Delaware File Number 4697384, Foreign Qualification Registration in California File Number 202109211078, and Texas File Number 805521396, is authorized to provide general advice only. The information on https://kalkine.com/ does not take into account any of your investment objectives, financial situation or needs. You should consider the appropriateness of advice taking into account your own objectives, financial situation and needs and seek independent financial advice before making any financial decisions. The link to our Terms and Conditions and Privacy Policy has been provided for your reference. On the date of publishing the reports (mentioned on the website), employees and/or associates of Kalkine do not hold positions in any of the stocks covered on the website. These stocks can change any time and readers of the reports should not consider these stocks as advice or recommendations later.
Past performance is not a reliable indicator of future performance.
 Please wait processing your request...