
 CA
 NZ
 UK
 AU
 IND

 US

This report is an updated version of report published on 13 May 2026 as on 09:57 AM IST

The ‘India Equity Opportunities Report’ is a forward-looking, conviction-based research product that identifies and evaluates investment options within the Indian equity market.
Anchored in a robust global and domestic macro framework, the report blends structural growth tailwinds with company-level fundamentals, valuation discipline, and technical signals to support confident, data-driven decision-making.

India is one of the world’s largest pharmaceutical producers and a major supplier of generic medicines, vaccines, and specialty drugs. The country holds nearly 5.71% share in the global pharmaceuticals market, supported by strong manufacturing capabilities, cost competitiveness, and regulatory-approved facilities.
In FY25, India’s pharmaceutical exports stood at around USD 30.4 billion, compared with USD 27.8 billion in FY24, while exports reached USD 10.2 billion during FY26 (April–July 2025). Formulations and biologics contributed the largest share of exports at 79.26%, followed by drug intermediates and bulk drugs at 16.08%.
India has the highest number of USFDA-compliant plants outside the US, with over 55% of exports directed toward highly regulated markets. The country also supplies nearly 65–70% of WHO vaccine requirements globally, reinforcing its position as the “Pharmacy of the World.”
Government initiatives such as the PLI scheme, bulk drug parks, and increasing demand for specialty therapies including oncology and complex generics are expected to support long-term industry growth, benefiting companies like NATCO Pharma.
(Data Source: India Brand Equity Foundation (IBEF) – Pharmaceutical Exports from India)
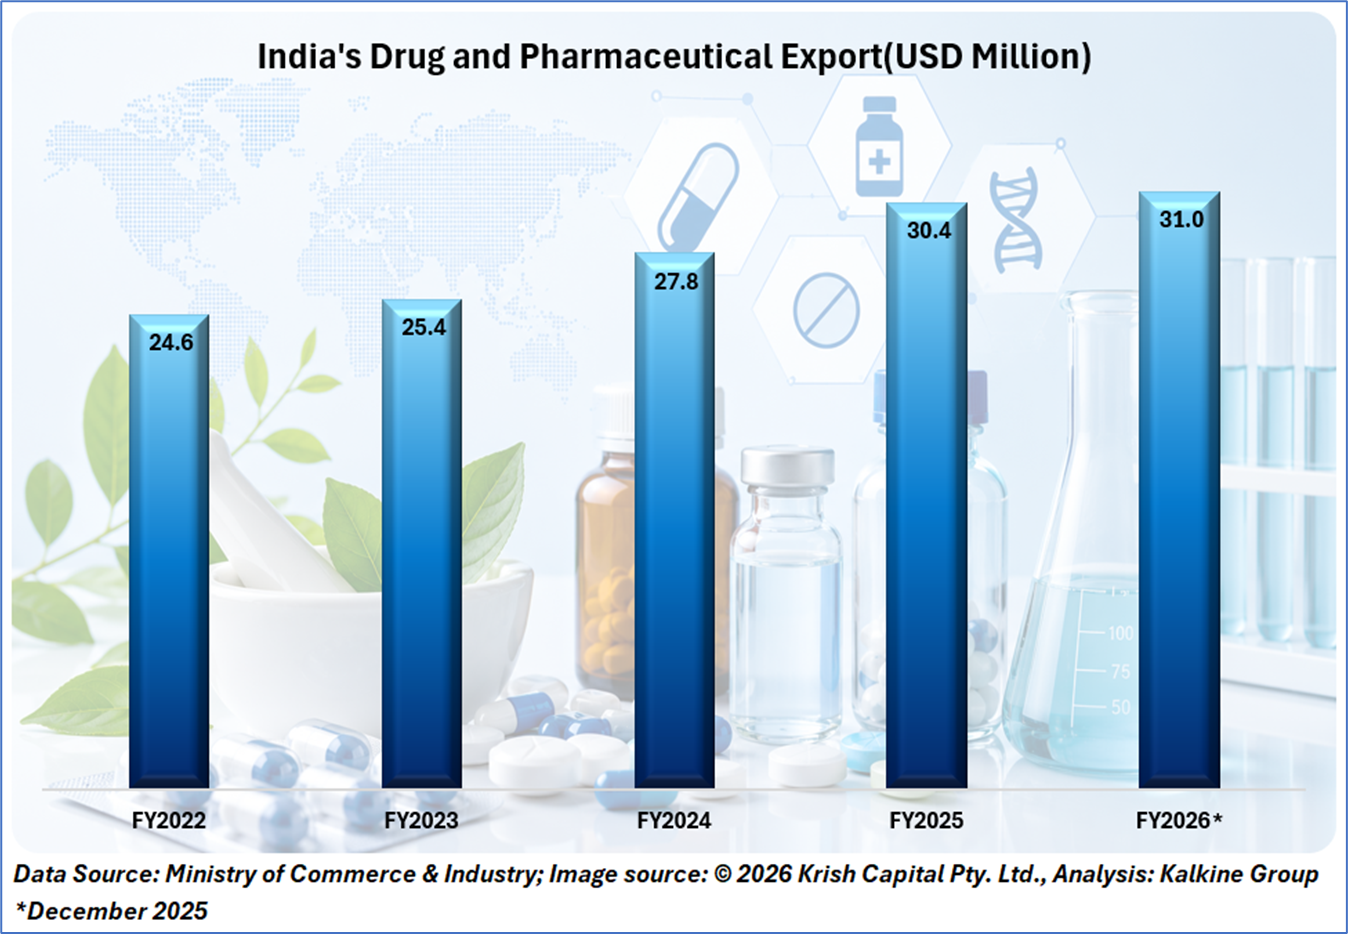

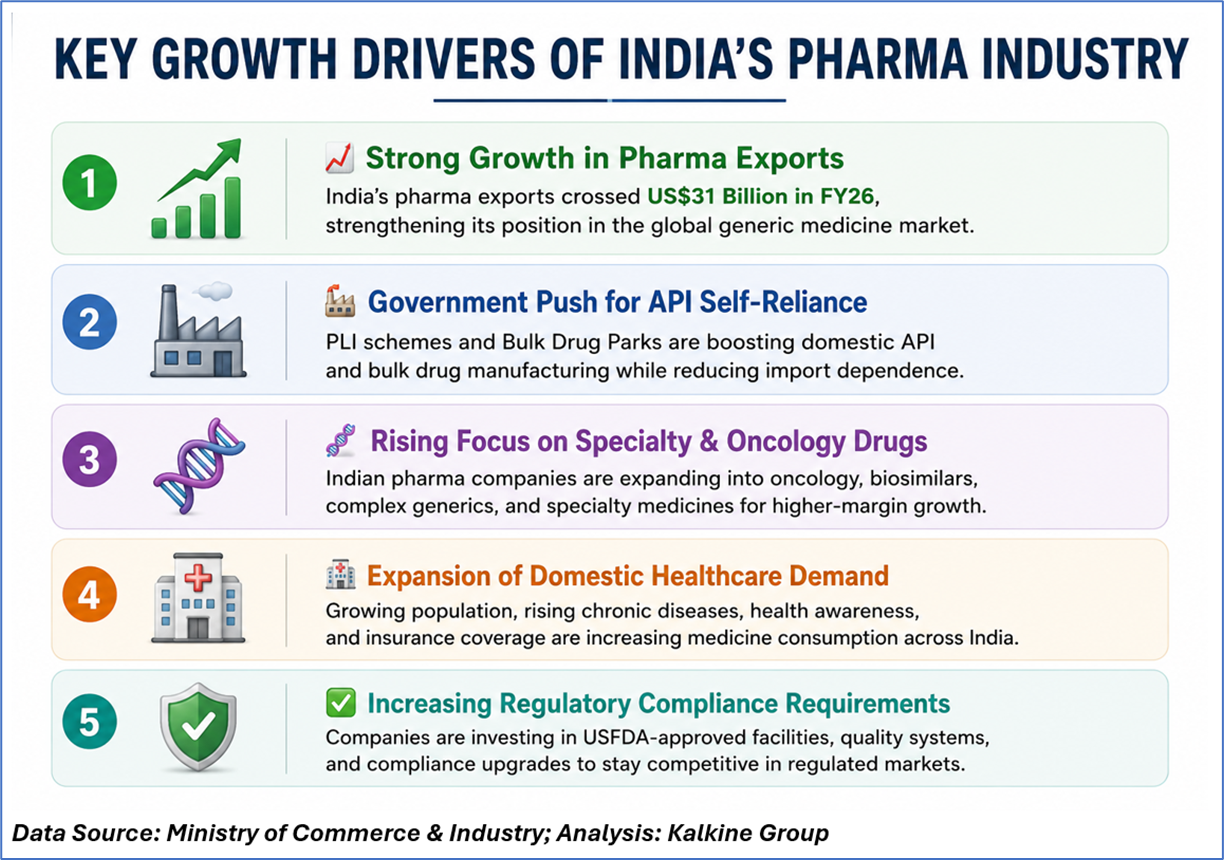

The outlook for the Indian pharmaceutical industry remains positive, supported by favorable demographics, rising healthcare spending, expanding export opportunities, and strong policy support. Industry estimates suggest the Indian pharmaceutical market could reach nearly USD 130 billion by 2030, supported by sustained double-digit growth trends. (Data source: Ministry of Commerce & Industry)
The API and pharmaceutical manufacturing segments are expected to witness healthy growth due to capacity additions, PLI-linked investments, and supply-chain diversification initiatives by global pharmaceutical companies.
In the medium term, companies with strong research capabilities, niche product portfolios, export exposure, and specialty drug pipelines are expected to outperform. Rising opportunities in oncology, chronic therapies, biosimilars, and complex generics could further support industry profitability.
However, the sector may continue to face challenges including pricing pressure in the US generics market, regulatory observations, raw material cost volatility, and geopolitical trade uncertainties. Despite these risks, India’s pharmaceutical industry is expected to remain a structurally strong growth sector over the long term.
Based on the above data, one NSE-listed India Equity Opportunities stock has been identified to showcase the momentum.
Section 1: Company Overview and Fundamentals Insights
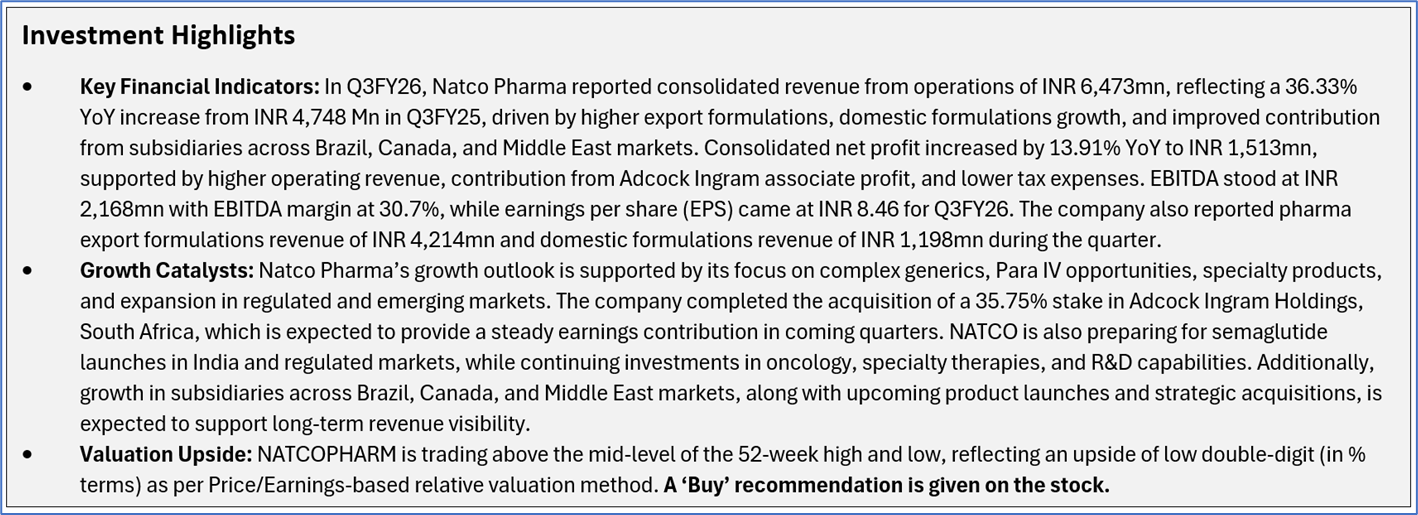
Company Overview: Natco Pharma Limited (NSE: NATCOPHARM) is an India-based pharmaceutical company focused on research, development, manufacturing, and marketing of generic medicines, specialty drugs, APIs, and agrochemical products. The company operates across pharmaceuticals and crop protection segments, serving domestic and international markets through vertically integrated operations and multiple manufacturing facilities in India. Kalkine’s India Equity Opportunities Report covers the Investment Highlights, Management Commentary, Key Financial Metrics, Risks, and Technical Analysis along with the Valuation, Target Price, and Recommendation on the stock.
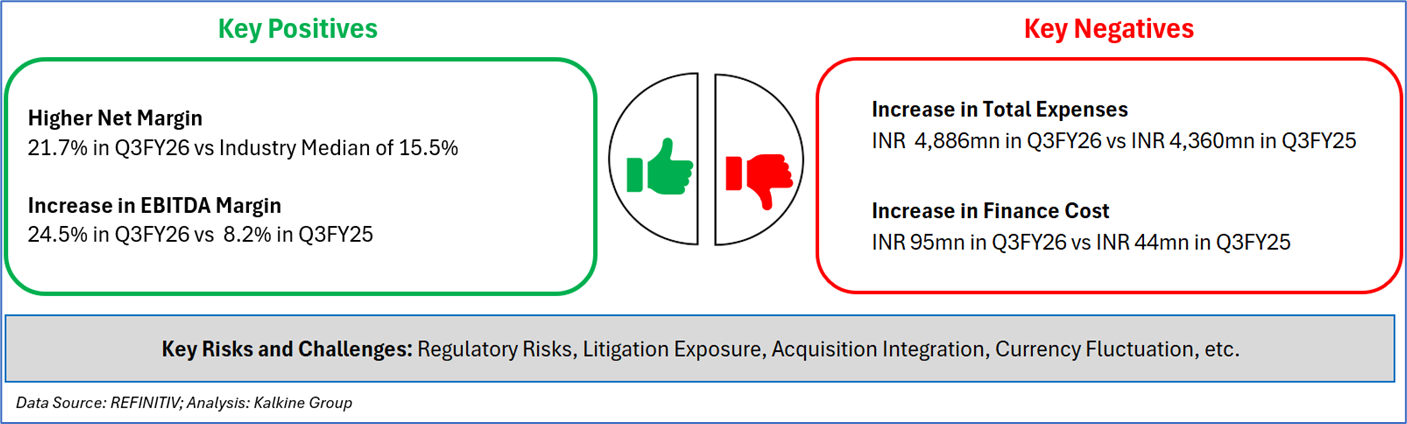
1.2 The Key Positives, Negatives, Investment Highlights, and Risks
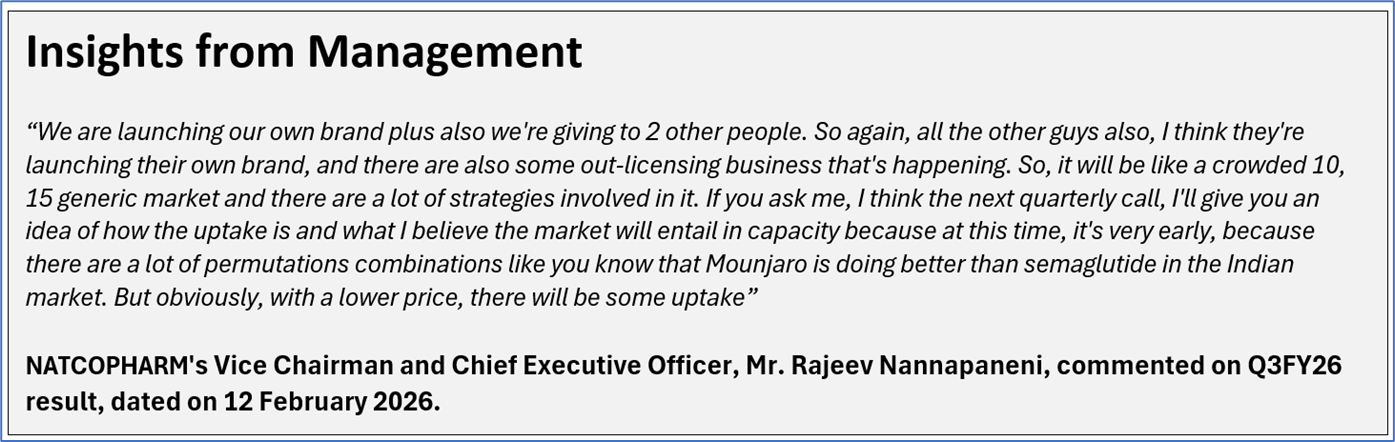
1.3 Top 10 Shareholders:
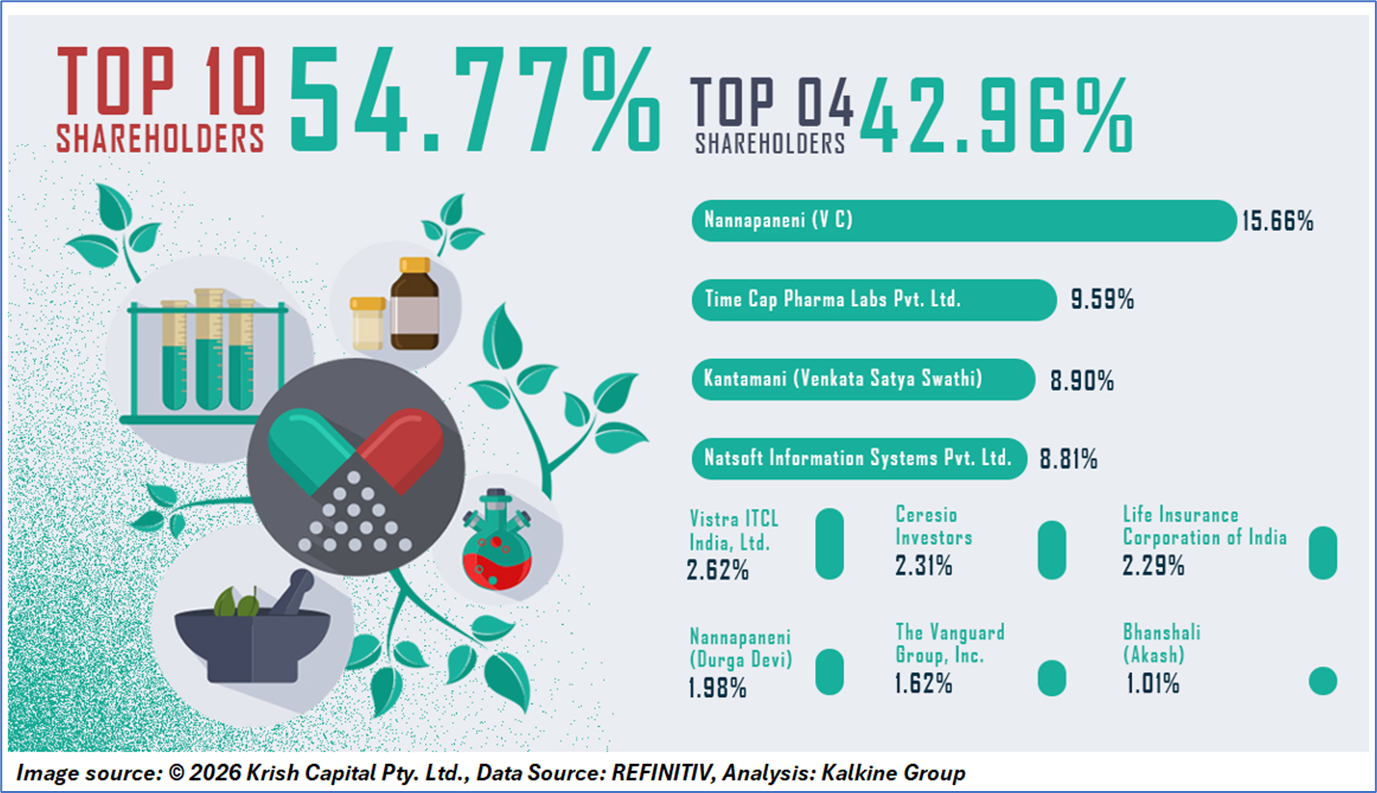
The top 10 shareholders together form ~54.77% of the total shareholding. Nannapaneni (V C) and Time Cap Pharma Labs Pvt. Ltd. hold maximum stakes of 15.66% and 9.59%, respectively.
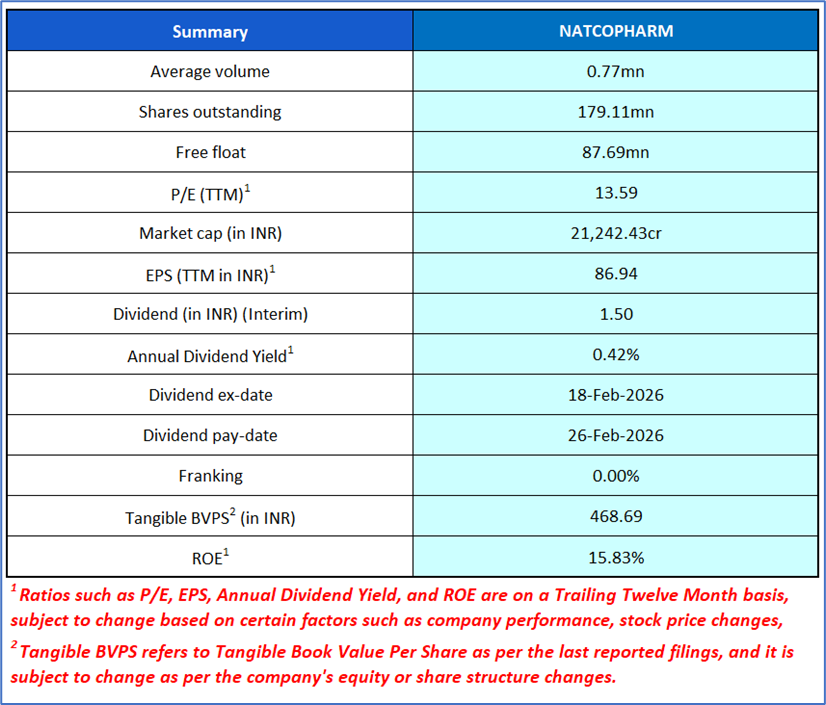
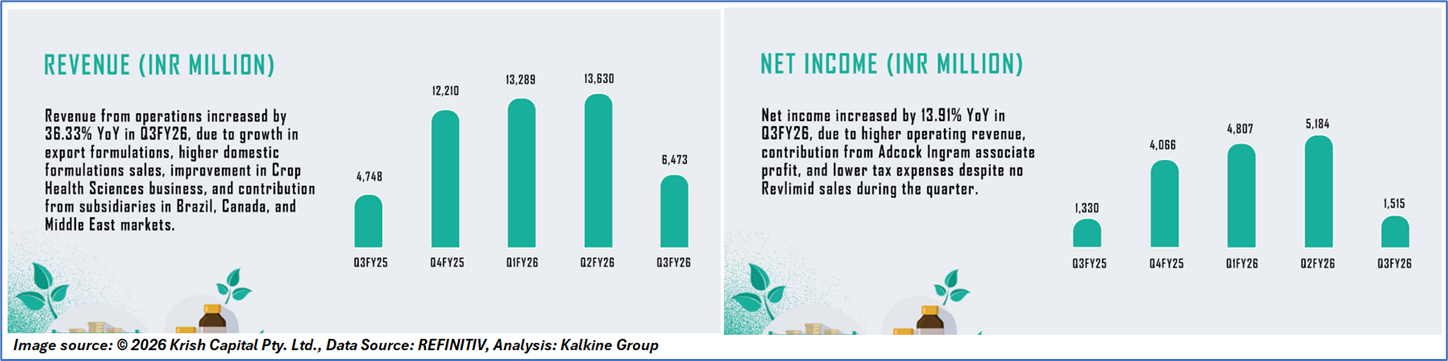
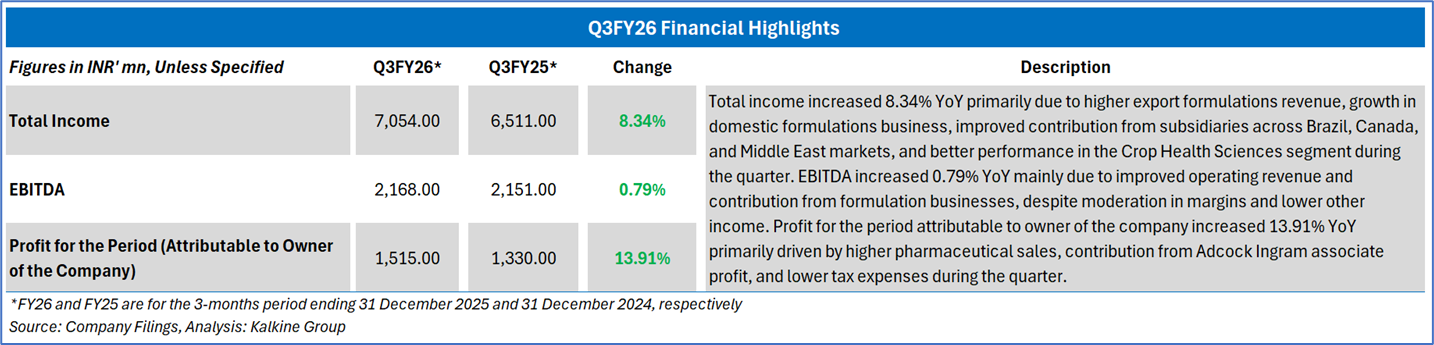
1.4 Key Metrics: NATCOPHARM’s earnings per share increased to INR 8.46 in Q3FY26 compared to INR 7.43 in Q3FY25. Below is captured other metrics:
Section 2: Business Updates, Financial and Operational Highlights
2.1 Recent Business Updates:
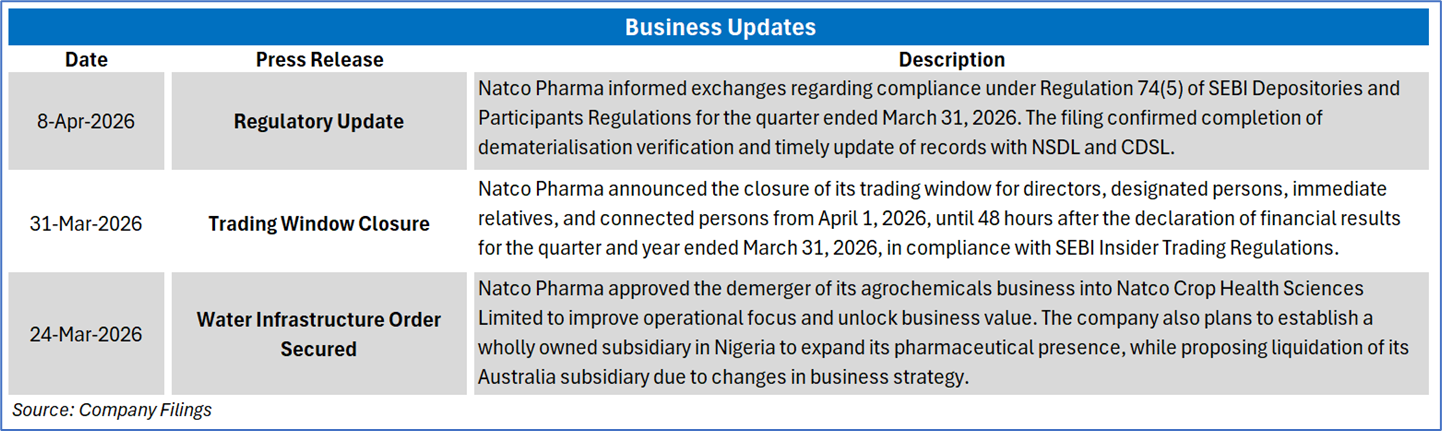
2.2 Q3FY26 Results Highlights (for the 03 months ended 31 December 2025): Below mentioned are some key financial highlights:
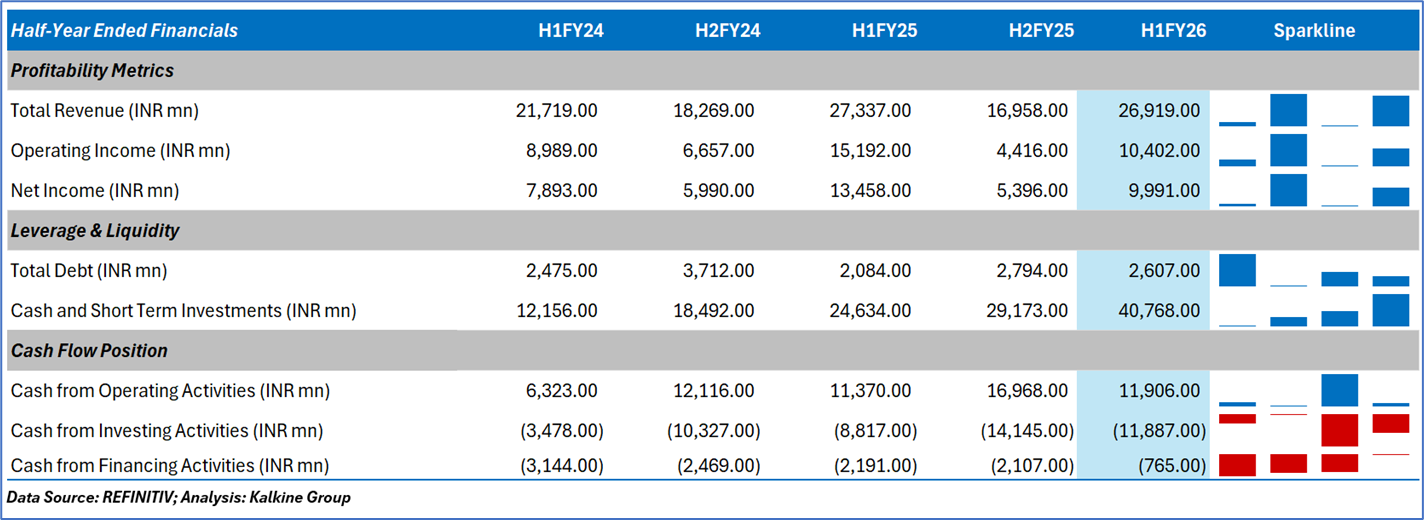
2.3 Historical Financial Trend
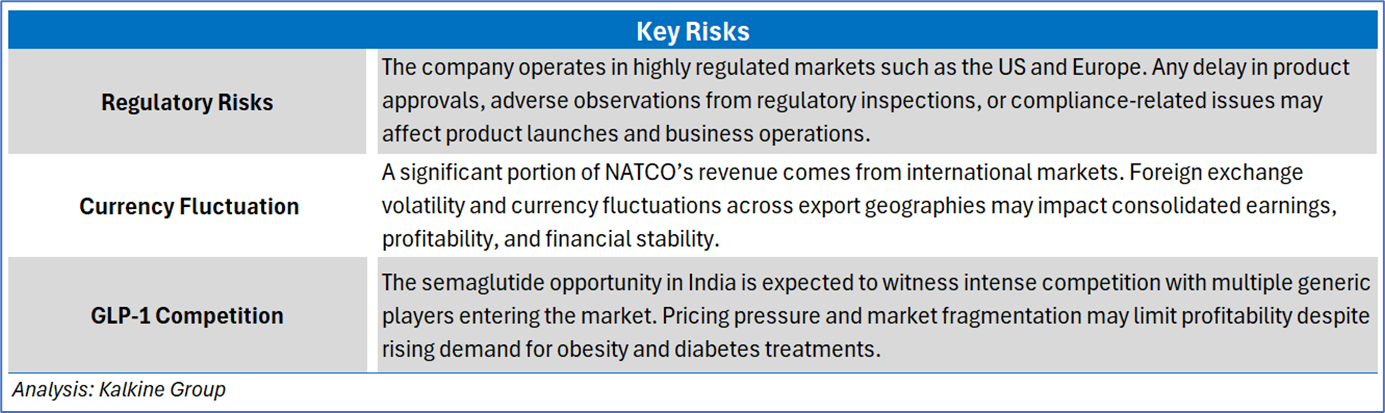
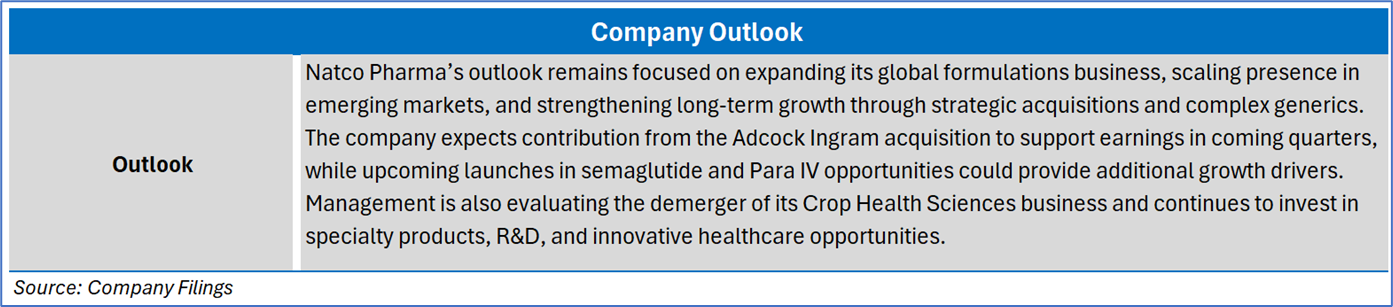
Section 3: Key Risks and Outlook:
Section 4: Stock Recommendation Summary
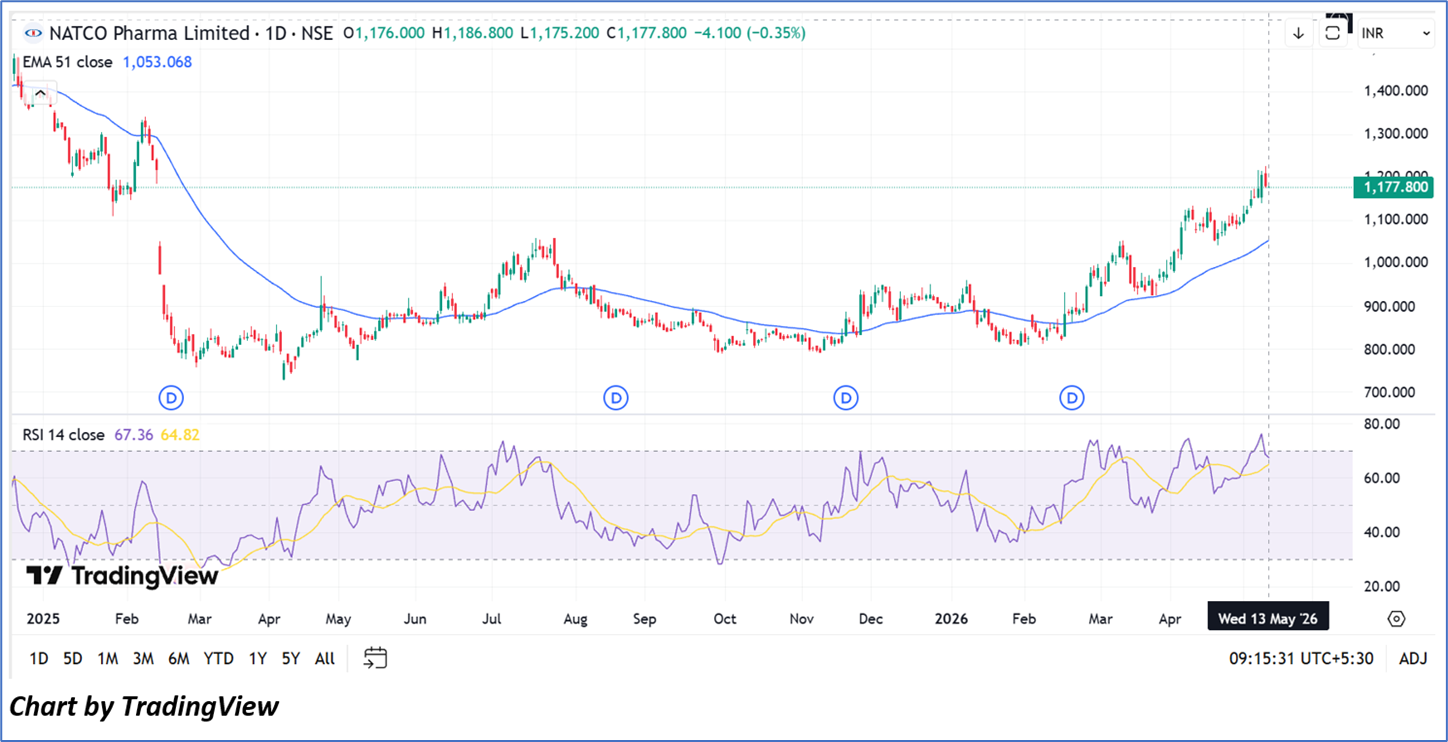
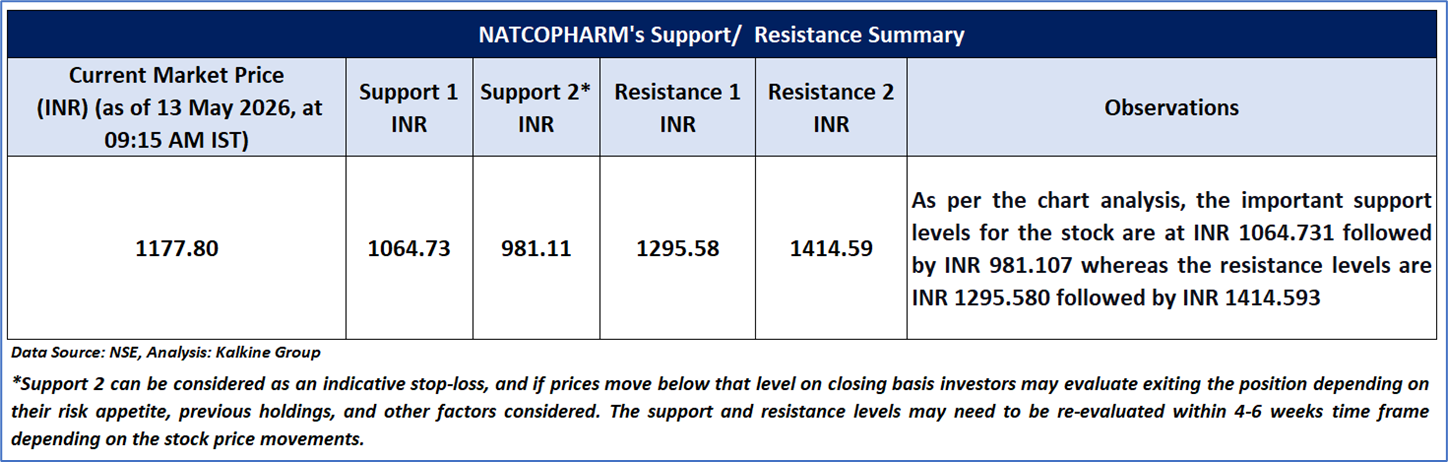
4.1 Price Performance and Technical Summary
The stock has increased by ~40.15% in the last three months, whereas over the past six months, stock has increased by ~44.99%. The stock has a 52-week low and 52-week high of INR 789.00 and INR 1,226.80, respectively. The stock is currently trading above the midpoint of its 52-week trading range.
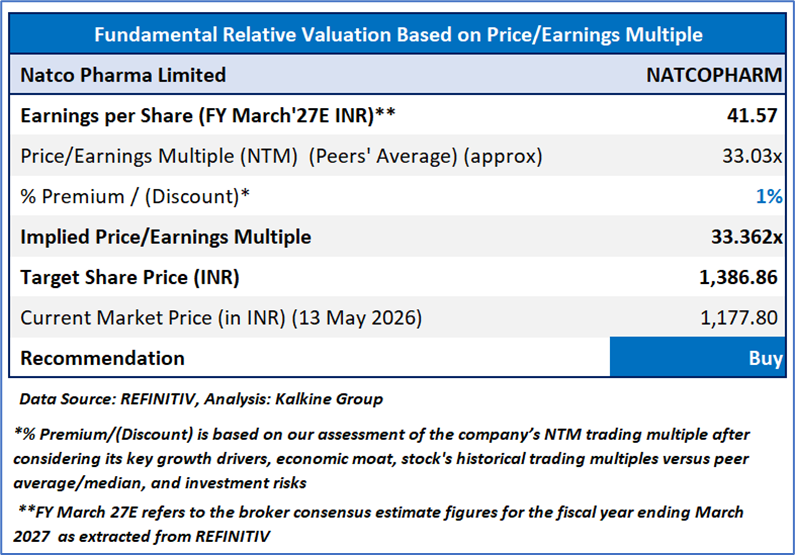
4.2 Fundamental Valuation and Stock Recommendation
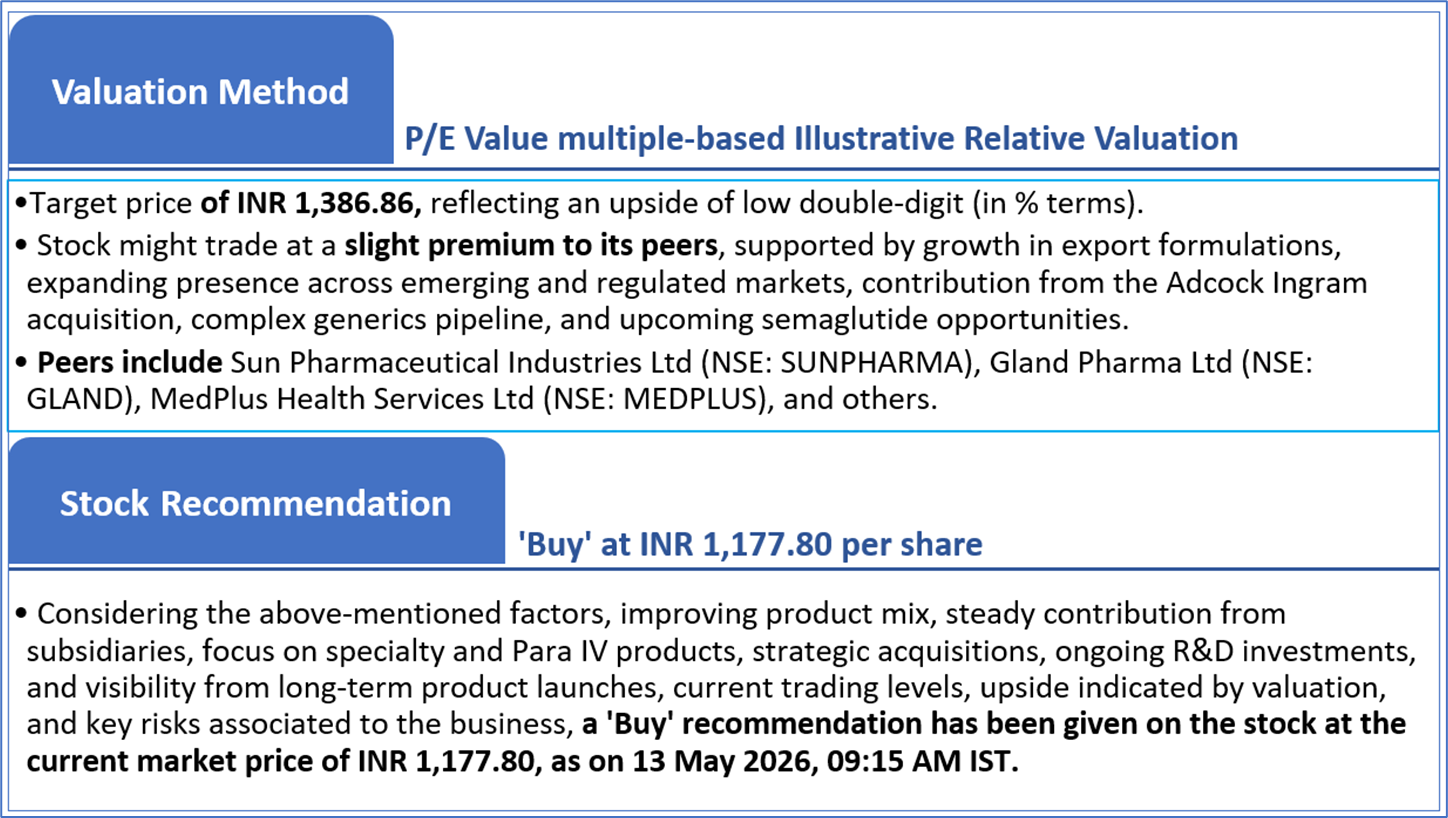
Markets are trading in a highly volatile zone currently due to certain macro-economic issues and geopolitical tensions prevailing. Therefore, it is prudent to follow a cautious approach while investing.
Note 1: Past performance is neither an indicator nor a guarantee of future performance.
Note 2: The reference date for all price data, currency, technical indicators, support, and resistance levels is 13 May 2026. The reference data in this report has been partly sourced from REFINITIV.
Note 3: Investment decisions should be made depending on an individual's appetite for upside potential, risks, holding duration, and any previous holdings. An 'Exit' from the stock can be considered if the Target Price mentioned as per the Valuation and or the technical levels provided have been achieved and is subject to the factors discussed above.
Note 4: Dividend Yield may vary as per the stock price movement.
Note 5: Kalkine reports are prepared based on the stock prices captured either from REFINITIV or Trading View. Typically, REFINITIV or Trading View may reflect stock prices with a delay which could be a lag of 25-30 minutes. There can be no assurance that future results or events will be consistent with the information provided in the report. The information is subject to change without any prior notice.
Technical Indicators Defined: -
Support: A level at which the stock prices tend to find support if they are falling, and a downtrend may take a pause backed by demand or buying interest. Support 1 refers to the nearby support level for the stock and if the price breaches the level, then Support 2 may act as the crucial support level for the stock.
Resistance: A level at which the stock prices tend to find resistance when they are rising, and an uptrend may take a pause due to profit booking or selling interest. Resistance 1 refers to the nearby resistance level for the stock and if the price surpasses the level, then Resistance 2 may act as the crucial resistance level for the stock.
Stop-loss: It is a level to protect further losses in case of unfavourable movement in the stock prices.
Kalkine Equities LLC, with Delaware File Number 4697384, Foreign Qualification Registration in California File Number 202109211078, and Texas File Number 805521396, is authorized to provide general advice only. The information on https://kalkine.com/ does not take into account any of your investment objectives, financial situation or needs. You should consider the appropriateness of advice taking into account your own objectives, financial situation and needs and seek independent financial advice before making any financial decisions. The link to our Terms and Conditions and Privacy Policy has been provided for your reference. On the date of publishing the reports (mentioned on the website), employees and/or associates of Kalkine do not hold positions in any of the stocks covered on the website. These stocks can change any time and readers of the reports should not consider these stocks as advice or recommendations later.
Past performance is not a reliable indicator of future performance.
 Please wait processing your request...