
 CA
CA
 NZ
NZ
 UK
UK
 AU
AU
 IND
IND

 US
US

Section 1: Company Overview and Fundamentals
1.1 Company Overview:
Hafnia Limited (NYSE: HAFN) is a tanker company. The principal activity of the Company is investment holding. The Company’s segments include Long Range II (LR2), Long Range I (LR1), Medium Range (MR), Handy, and Specialised. The LR2 segment consists of vessels between 85,000 deadweight tons (DWT) and 124,999 DWT in size and provides transportation of clean petroleum oil products.
Kalkine’s Dividend Income Report covers the Company Overview, Key positives & negatives, Investment summary, Key investment metrics, Top 10 shareholding, Business updates and insights into company recent financial results, Key Risks & Outlook, Price performance and technical summary, Target Price, and Recommendation on the stock.
Price Performance:
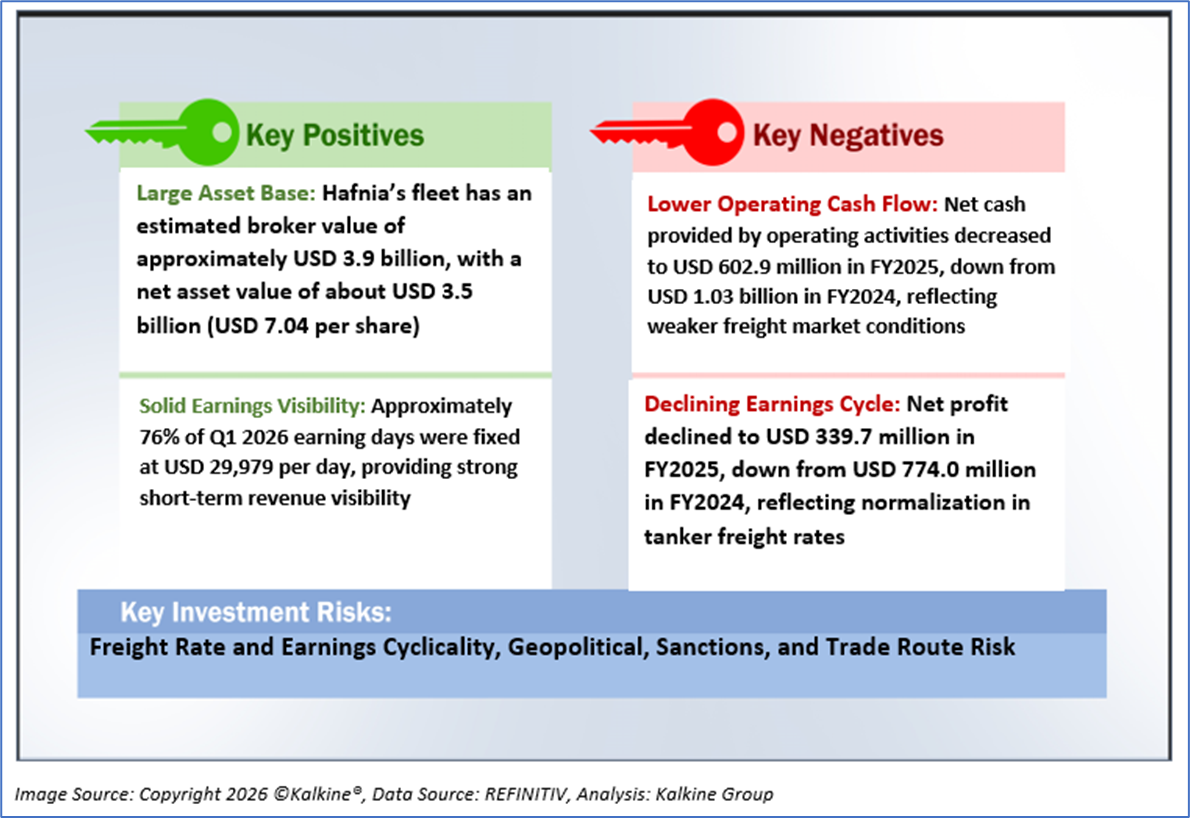
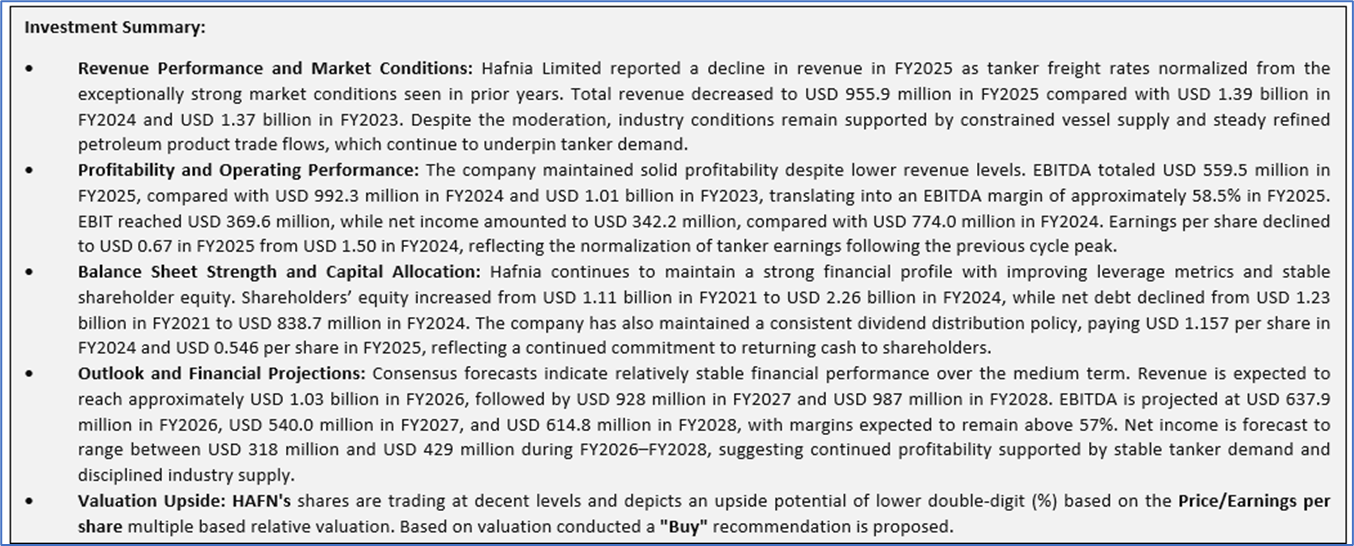
1.2 The Key Positives, Negatives, and Investment summary
1.3 Top 10 shareholders:
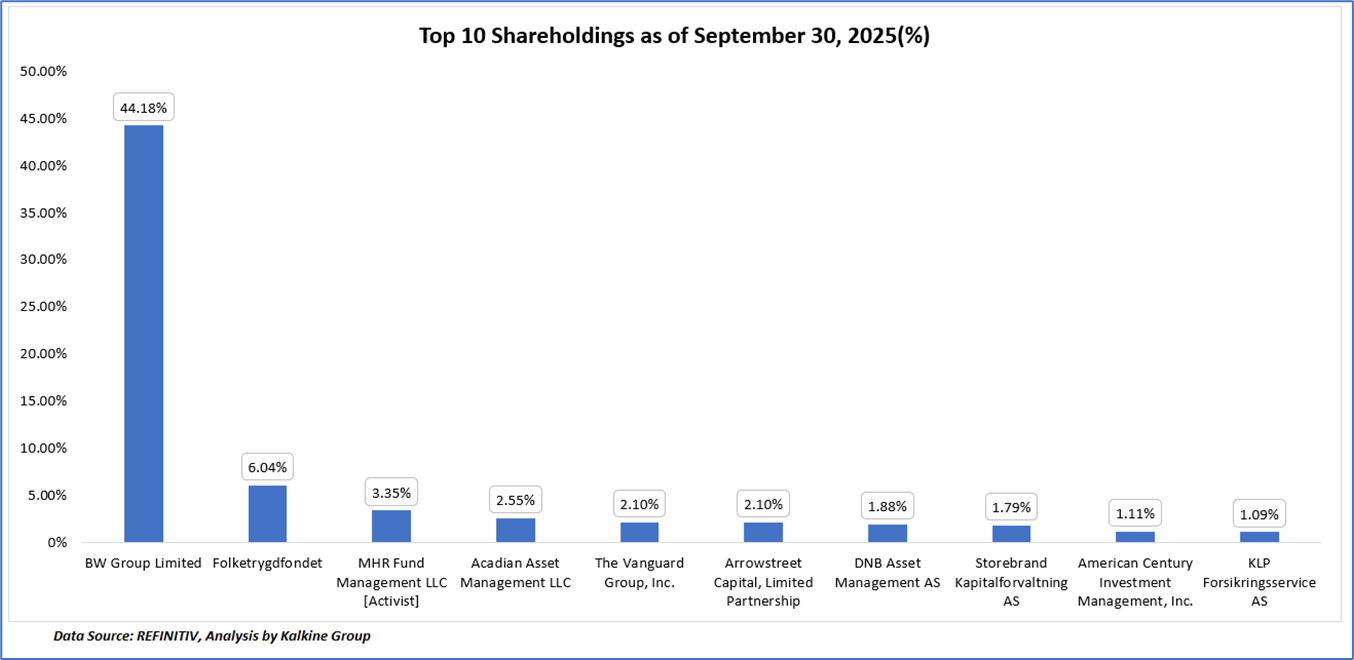
The top 10 shareholders together form ~66.21% of the total shareholding, signifying concentrated shareholding. BW Group Limited and Folketrygdfondet are the biggest shareholders, holding the maximum stake in the company at ~44.18% and ~6.04%, respectively.
1.4 Dividend payments with impressive dividend yield:
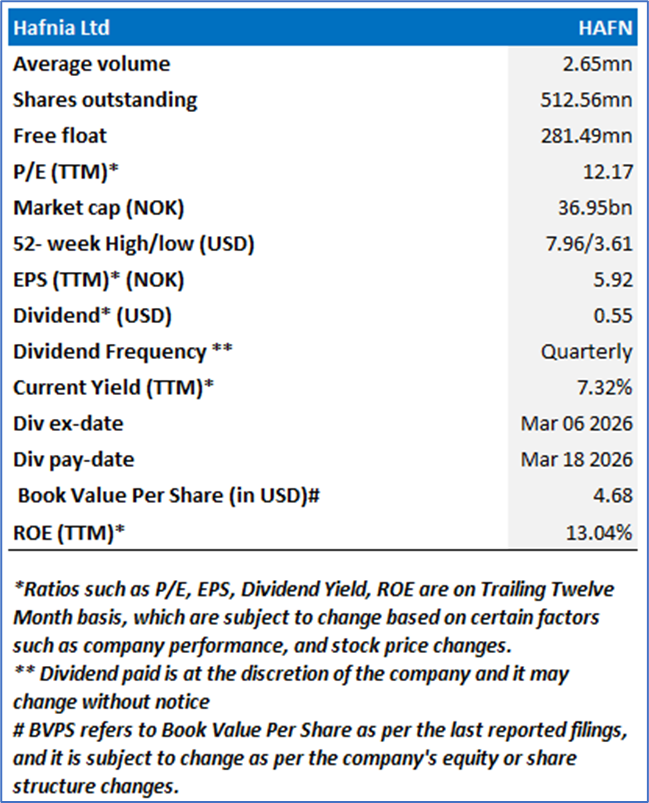
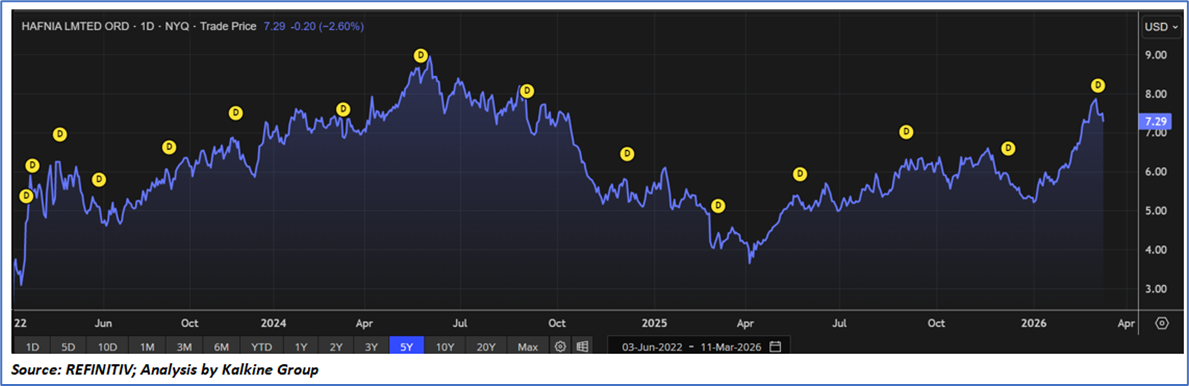
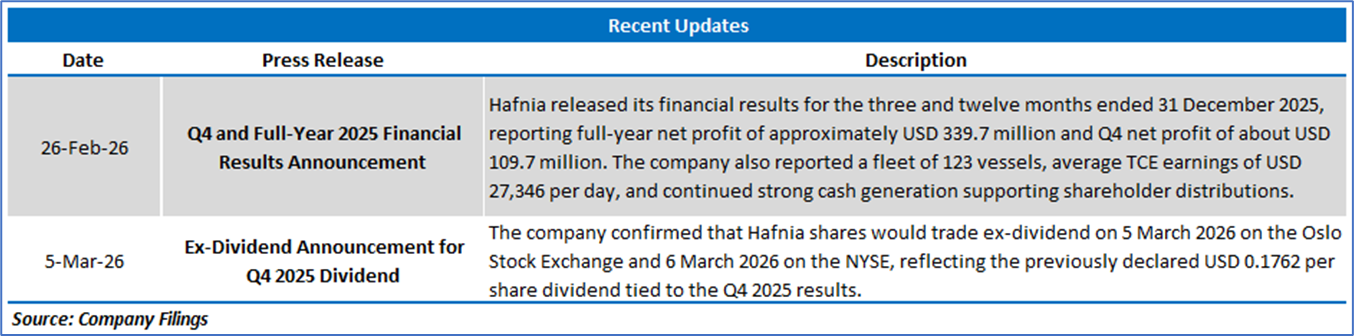
Hafnia Limited maintains a shareholder-focused capital return policy through consistent dividend distributions linked to earnings performance. For Q4 2025, the company declared a cash dividend of USD 0.1762 per share, approved on 25 February 2026, with a record date of 6 March 2026. The shares traded ex-dividend on 5 March 2026 on the Oslo Stock Exchange and 6 March 2026 on the NYSE, with the distribution reflecting Hafnia’s strategy of returning a significant portion of profits to shareholders. Based on the current share price, the stock offers an annualized dividend yield of approximately 7.32%, underscoring its strong income-generating profile within the product tanker sector.
1.5 Key Metrics
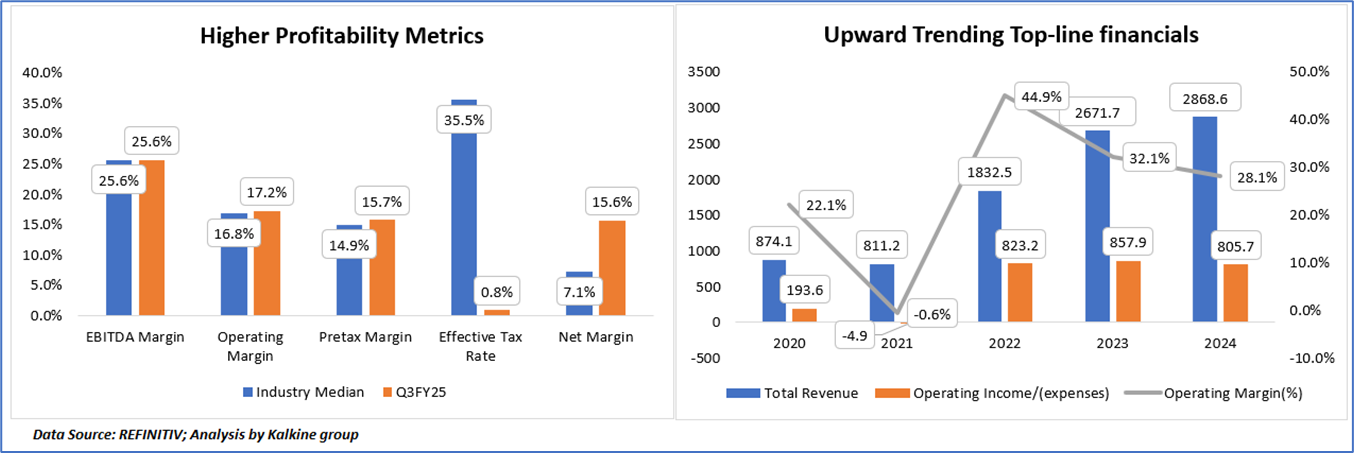
The financial profile reflects a mixed margin performance relative to industry benchmarks, with Q3 FY25 operating and net margins outperforming industry medians, indicating effective cost management and operating efficiency. Operating margin of 17.2% and net margin of 15.6% compare favorably against industry medians of 16.8% and 7.1%, respectively, highlighting stronger bottom-line conversion. However, EBITDA and pretax margins remain modestly below industry norms, suggesting some pressure at the gross operating level, while the notably lower effective tax rate of 0.8% versus the industry median of 35.5% materially supports net profitability and earnings retention.
From a growth perspective, the company demonstrates a structurally improving top-line trajectory, with total revenue expanding from USD 811 million in 2021 to USD 2.87 billion in 2024, underscoring strong scale-up and demand momentum. Operating income has also increased steadily, while operating margins have remained elevated, peaking at 44.9% in 2022 and normalizing to 28.1% in 2024, indicating sustainable profitability despite revenue normalization. Overall, the financials point to a business that has successfully transitioned into a higher-revenue, higher-margin operating profile, with improving earnings quality and resilience across the cycle.
Section 2: Business Updates and Financial Highlights
2.1 Recent Updates:
The below picture gives an overview of the recent updates:
2.2 Insights of FY25:
Section 3: Key Risks and Outlook:
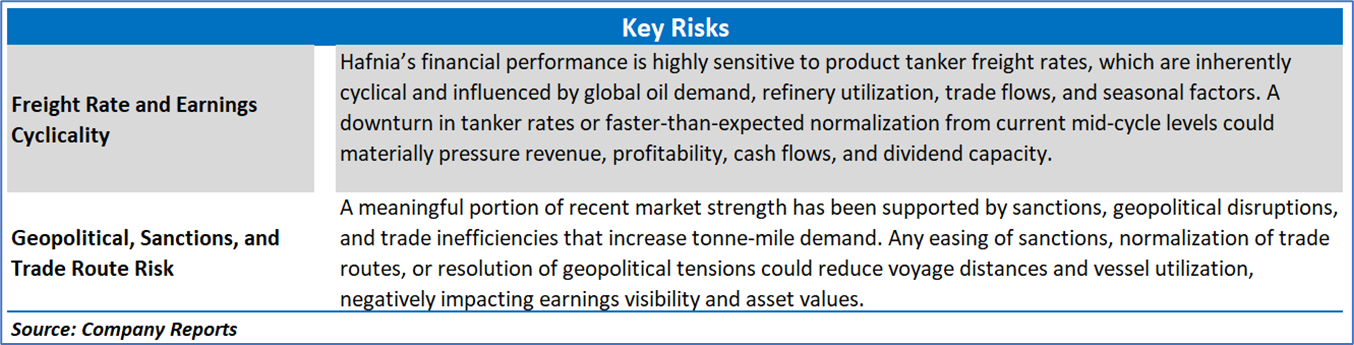
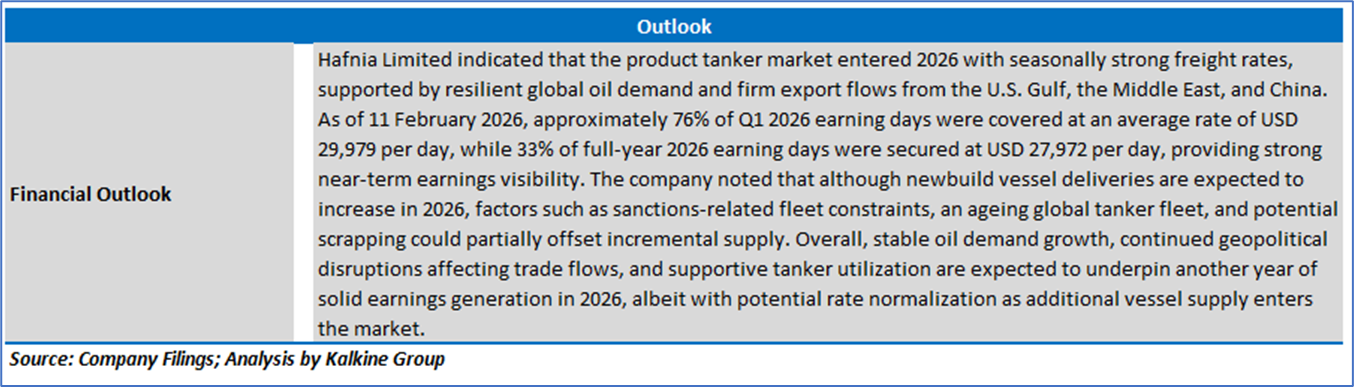
Section 4: Stock Recommendation Summary:
4.1 Technical Summary:
Price Performance:
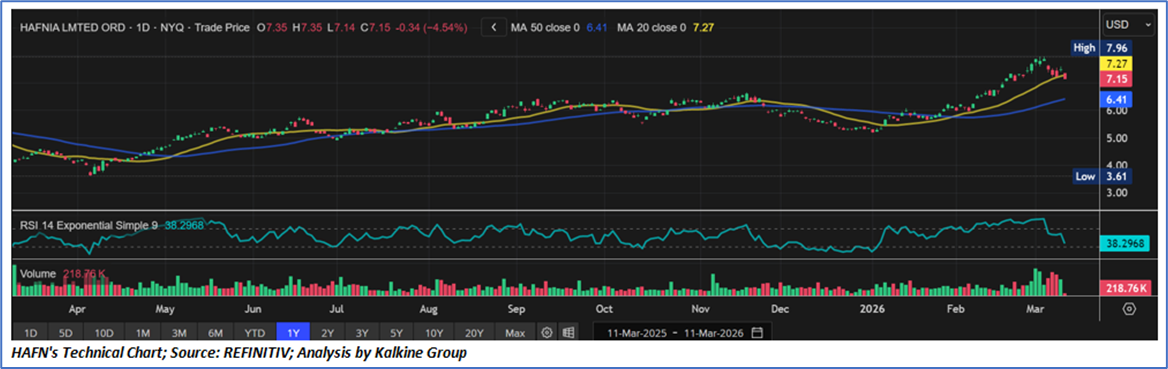
4.2 Fundamental Valuation
Valuation Methodology: Price/Earnings Per Share Multiple Based Relative Valuation
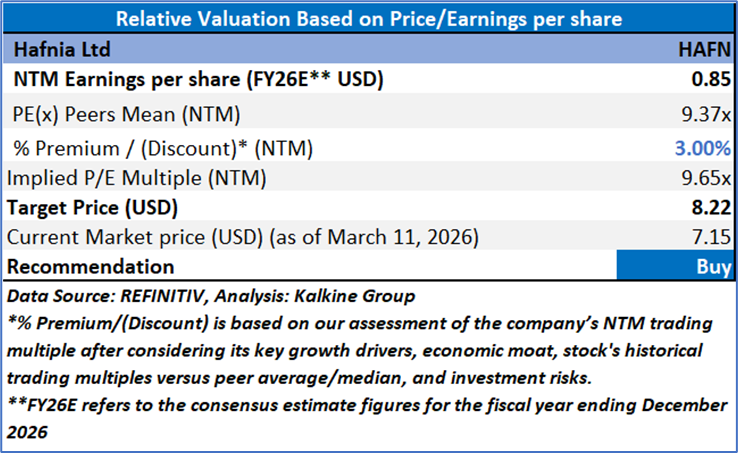
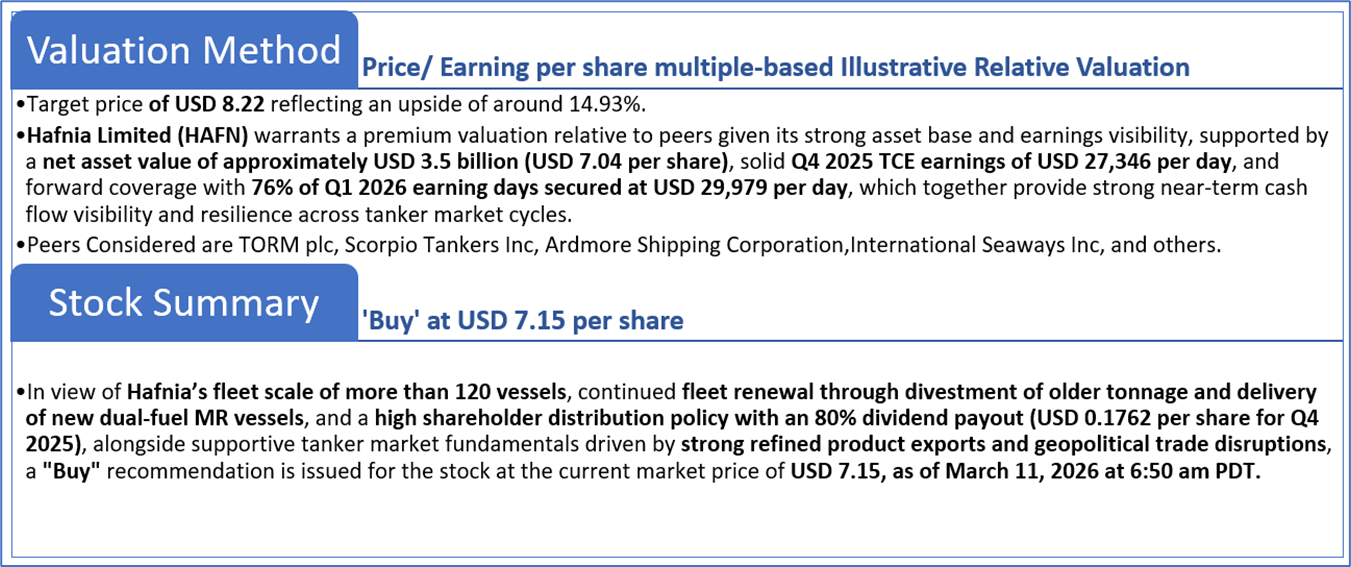
Markets are trading in a highly volatile zone currently due to certain macroeconomic issues and geopolitical tensions prevailing. Therefore, it is prudent to follow a cautious approach while investing.
Note 1: Past performance is not a reliable indicator of future performance.
Note 2: The reference date for all price data, currency, technical indicators, support, and resistance levels is March 11, 2026. The reference data in this report has been partly sourced from REFINITIV.
Note 3: Investment decisions should be made depending on an individual's appetite for upside potential, risks, holding duration, and any previous holdings. An 'Exit' from the stock can be considered if the Target Price mentioned as per the Valuation and or the technical levels provided has been achieved and is subject to the factors discussed above.
Note 4: The report publishing date is as per the Pacific Time Zone.
Technical Indicators Defined: -
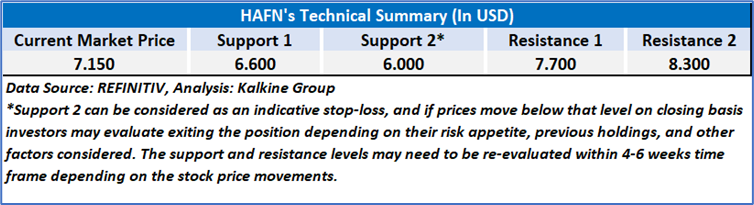
Support: A level at which the stock prices tend to find support if they are falling, and a downtrend may take a pause backed by demand or buying interest. Support 1 refers to the nearby support level for the stock and if the price breaches the level, then Support 2 may act as the crucial support level for the stock.
Resistance: A level at which the stock prices tend to find resistance when they are rising, and an uptrend may take a pause due to profit booking or selling interest. Resistance 1 refers to the nearby resistance level for the stock and if the price surpasses the level, then Resistance 2 may act as the crucial resistance level for the stock.
Stop-loss: It is a level to protect against further losses in case of unfavorable movement in the stock prices.
Kalkine Equities LLC, with Delaware File Number 4697384, Foreign Qualification Registration in California File Number 202109211078, and Texas File Number 805521396, is authorized to provide general advice only. The information on https://kalkine.com/ does not take into account any of your investment objectives, financial situation or needs. You should consider the appropriateness of advice taking into account your own objectives, financial situation and needs and seek independent financial advice before making any financial decisions. The link to our Terms and Conditions and Privacy Policy has been provided for your reference. On the date of publishing the reports (mentioned on the website), employees and/or associates of Kalkine do not hold positions in any of the stocks covered on the website. These stocks can change any time and readers of the reports should not consider these stocks as advice or recommendations later.
Past performance is not a reliable indicator of future performance.
 Please wait processing your request...