
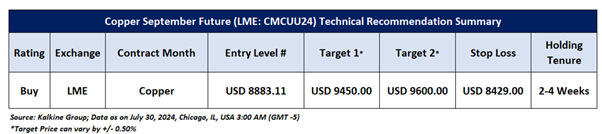
Copper September Future (LME: CMCUU24):
As per the previous recommendation on ‘Copper’ on 30 July 2024, a ‘Buy’ rating was given on the Commodity at USD 8883.11, and noted below are the details of the recommendation summary provided in the previous report:
Technical Analysis summary as on 30 July 2024.
Copper Daily Chart:
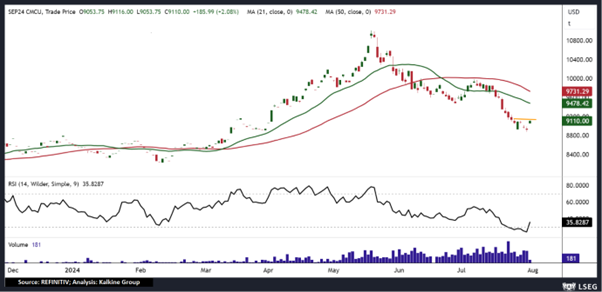
Chicago, IL, USA, 03:01 AM (GMT-5)
Considering the target levels is yet to achieved, but 'Copper’ currently trading near a Resistance level, and it is prudent to book profits at the current levels. Hence, a ‘Exit’ rating has been provided on the Commodity at the Current Market Price of USD 9110.00 as of July 31, 2024.
Note 1: Past performance is neither an indicator nor a guarantee of future performance.
Note 2: The reference date for all price data, currency, technical indicators, support, and resistance levels is July 31, 2024. The reference data in this report has been partly sourced from REFINITIV.
Note 3: Investment decisions should be made depending on an individual's appetite for upside potential, risks, holding duration, and any previous holdings. An 'Exit' from the Commodity can be considered if the Target Price mentioned as per the Valuation and or the technical levels provided has been achieved and is subject to the factors discussed above.
Technical Indicators Defined: -
Support: A level at which the Commodity prices tend to find support if they are falling, and downtrend may take a pause backed by demand or buying interest.
Resistance: A level at which the Commodity prices tend to find resistance when they are rising, and uptrend may take a pause due to profit booking or selling interest.
Stop-loss: In general, it is a level to protect further losses in case of any unfavourable movement in the Commodity prices.
Kalkine Equities LLC, with Delaware File Number 4697384, Foreign Qualification Registration in California File Number 202109211078, and Texas File Number 805521396, is authorized to provide general advice only. The information on https://kalkine.com/ does not take into account any of your investment objectives, financial situation or needs. You should consider the appropriateness of advice taking into account your own objectives, financial situation and needs and seek independent financial advice before making any financial decisions. The link to our Terms and Conditions and Privacy Policy has been provided for your reference. On the date of publishing the reports (mentioned on the website), employees and/or associates of Kalkine do not hold positions in any of the stocks covered on the website. These stocks can change any time and readers of the reports should not consider these stocks as advice or recommendations later.
Copyright © 2024 Krish Capital Pty Ltd. All rights reserved.
 US
US  AU
AU UK
UK CA
CA NZ
NZ Please wait processing your request...