Global Commodity Market Wrap-Up
The metals market experienced a bullish trend last week, with precious metals surging from their lows and showing upward momentum, while base metals also saw positive results. Gold surged by 2.30%, and silver rose by 4.15%. Base metals also experienced upward momentum, with copper increasing by 2.83%, lead rising by 1.39%, and zinc showing a notable surge of 3.29%. These changes reflect shifting investor sentiment and evolving demand patterns across the metal sectors. The market's previous uncertainty has given way to heightened volatility, with uncertain dynamics likely to continue impacting price movements in the near term.
Last week, natural gas prices surged by 14.32%, driven by supply constraints and heightened seasonal demand. Crude oil, on the other hand, saw a significant decline of 3.74%, as market uncertainty and shifting investor sentiment weighed heavily on prices. Meanwhile, U.S. sugar prices dropped by 1.13%, following the broader trend across agricultural commodities. These price movements highlight ongoing demand supply imbalances, with investors adjusting their strategies amid global economic instability. Both the energy and agricultural sectors are facing increased volatility, influenced by disruptions in supply and changing demand dynamics. This environment is expected to continue shaping market trends shortly.
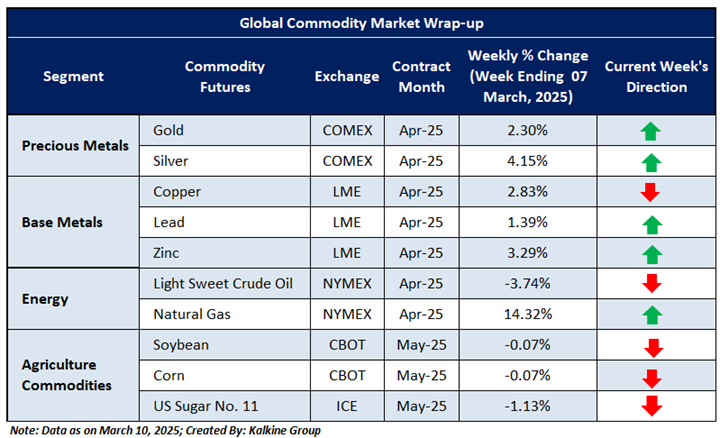
Global commodity prices have bonce back from recent support levels, influenced by a range of global factors. Precious metals remain above key support zones, suggesting the possibility of a bullish trend if conditions align. In the energy sector, natural gas continues to experience volatility within a wide price range, while crude oil shows signs of weakness, falling below critical support levels. Agricultural commodities are under downward pressure, driven by sector-specific challenges. This market environment, characterized by both stability and volatility, calls for caution. Investors are closely monitoring economic and geopolitical developments, balancing risks and opportunities in the evolving commodities landscape.
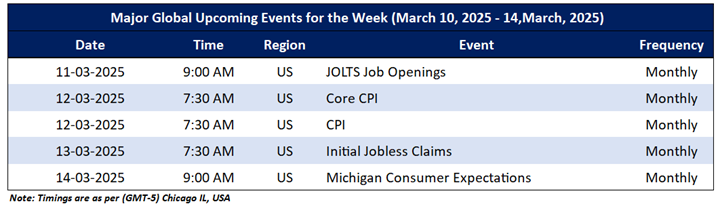
The upcoming Micro and Macroeconomic events that may impact market sentiments include an update JOLTS Job Openings, Core CPI, CPI and Initial Jobless Claims.
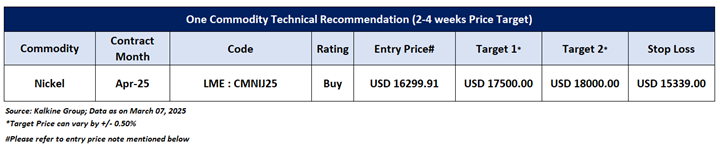
Having understood the global commodities performance over the past week, taking cues from major global economic events, and based on technical analysis, noted below is the recommendation with the generic insights, entry price, target prices, and stop-loss Nickel April Future (LME: CMNIJ25) for the next 2-4 weeks duration:
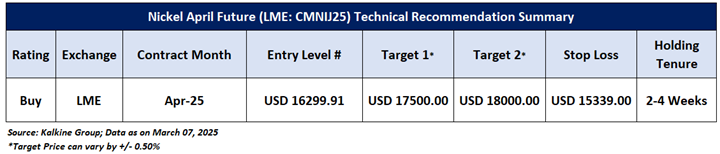
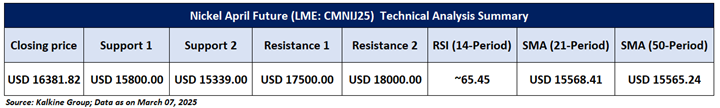
Nickel April Future (LME: CMNIJ25)
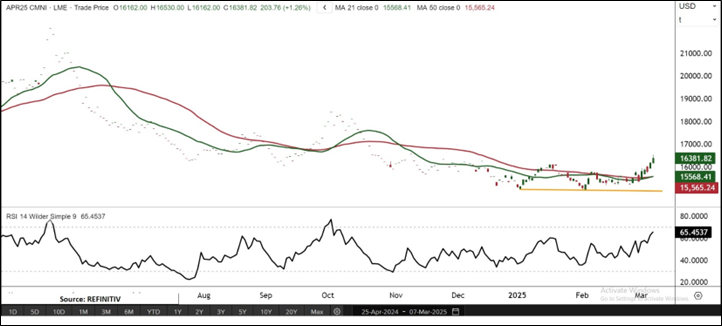
Price Action and Technical Indicator Analysis: Nickel's futures for April are currently trading above a horizontal and ascending trendline, accompanied by a bullish candlestick pattern, signaling potential for further upside. The price has closed above the 21-period Simple Moving Average (SMA), reinforcing the positive outlook. On the daily charts, a strong resistance level presents a challenge to continued upward movement. The Relative Strength Index (RSI) is at 65.45, indicating bullish momentum, while the 50-period SMA provides short-term support. These technical indicators suggest a bullish market trend for nickel in the near term, with upward potential unless resistance proves too strong.
Now the next crucial resistance levels appear to be at USD 17500.00 and USD 18000.00, and prices may test these levels in the coming periods (2-4 weeks).
As per the above-mentioned price action and technical indicators analysis, Nickel April Future (LME: CMNIJ25) is looking technically well-placed for a ‘Buy’ rating. Investment decisions should be made depending on an individual’s appetite for downside potential, risks, and any previous holdings. This recommendation is purely based on technical analysis, and fundamental analysis has not been considered in this report. Technical summary of the ‘Buy’ recommendation is as follows:
Upcoming Major Global Economic Events
Market events occur on a day-to-day basis depending on the frequency of the data and generally include an update on employment, inflation, GDP, WASDE report, consumer sentiments, etc. Noted below are the upcoming week's major global economic events that could impact commodities’ prices:
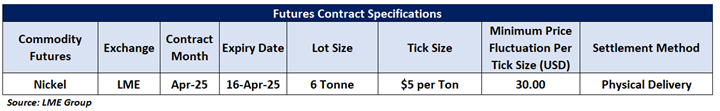
Futures Contract Specifications
Disclaimers
Related Risks: Based on the technical analysis, the risks are defined as per risk-reward ratio (~0.80:1.00), however, returns are generated within a 2-4 weeks’ time frame. This may be looked at by Individuals with sufficient risk appetite looking for returns within short investment duration. The investment recommendations provided in this report are solely based on technical parameters, and the fundamental performance of the commodities has not been considered in the decision-making process. Other factors which could impact commodity prices include market risks, regulatory risks, interest rates risk, currency risks, and social and political instability risks etc.
Note 1: Past performance is not a reliable indicator of future performance.
Note 2: Individuals can consider exiting from the commodity if the Target Price mentioned as per the Technical Analysis has been achieved and subject to the factors discussed above.
Note 3: How to Read the Charts?
The Green colour line reflects the 21-period moving average while the red line indicates the 50- period moving average. SMA helps to identify existing price trend. If the prices are trading above the 21-period and 50-period moving average, then it shows prices are currently trading in a bullish trend.
The Black colour line in the chart’s lower segment reflects the Relative Strength Index (14-Period) which indicates price momentum and signals momentum in trend. A reading of 70 or above suggests overbought status while a reading of 30 or below suggests an oversold status.
The Blue colour bars in the chart’s lower segment show the volume of the commodity. Commodity with high volumes is more liquid compared to the lesser ones. Liquidity in commodity helps in easier and faster execution of the order.
The Orange colour lines are the trend lines drawn by connecting two or more price points and used for trend identification purposes. The trend line also acts as a line of support and resistance.
Technical Indicators Defined: -
Support: A level at which the stock prices tend to find support if they are falling, and a downtrend may take a pause backed by demand or Selling interest. Support 1 refers to the nearby support level for the stock and if the price breaches the level, then Support 2 may act as the crucial support level for the stock.
Resistance: A level at which the stock prices tend to find resistance when they are rising, and an uptrend may take a pause due to profit booking or Selling interest. Resistance 1 refers to the nearby resistance level for the stock and if the price surpasses the level, then Resistance 2 may act as the crucial resistance level for the stock.
Stop-loss: It is a level to protect further losses in case of unfavourable movement in the stock prices.
Risk Reward Ratio: The risk reward ratio is the difference between an entry point to a stop loss and profit level. This report is based on ~80% Stop Loss of the Target 1 from the entry point.
The reference date for all price data, volumes, technical indicators, support, and resistance levels is March 07, 2025. The reference data in this report has been partly sourced from REFINITIV.
Note: Trading decisions require a thorough analysis by individuals. Technical reports, in general, chart out metrics that may be assessed by individuals before any commodity evaluation. The above are illustrative analytical factors used for evaluating the commodity; other parameters can be looked at along with additional risks per se.
Kalkine Equities LLC, with Delaware File Number 4697384, Foreign Qualification Registration in California File Number 202109211078, and Texas File Number 805521396, is authorized to provide general advice only. The information on https://kalkine.com/ does not take into account any of your investment objectives, financial situation or needs. You should consider the appropriateness of advice taking into account your own objectives, financial situation and needs and seek independent financial advice before making any financial decisions. The link to our Terms and Conditions and Privacy Policy has been provided for your reference. On the date of publishing the reports (mentioned on the website), employees and/or associates of Kalkine do not hold positions in any of the stocks covered on the website. These stocks can change any time and readers of the reports should not consider these stocks as advice or recommendations later.
Past performance is not a reliable indicator of future performance.
 Please wait processing your request...