
Section 1: Company Overview and Fundamentals
1.1 Company Overview:
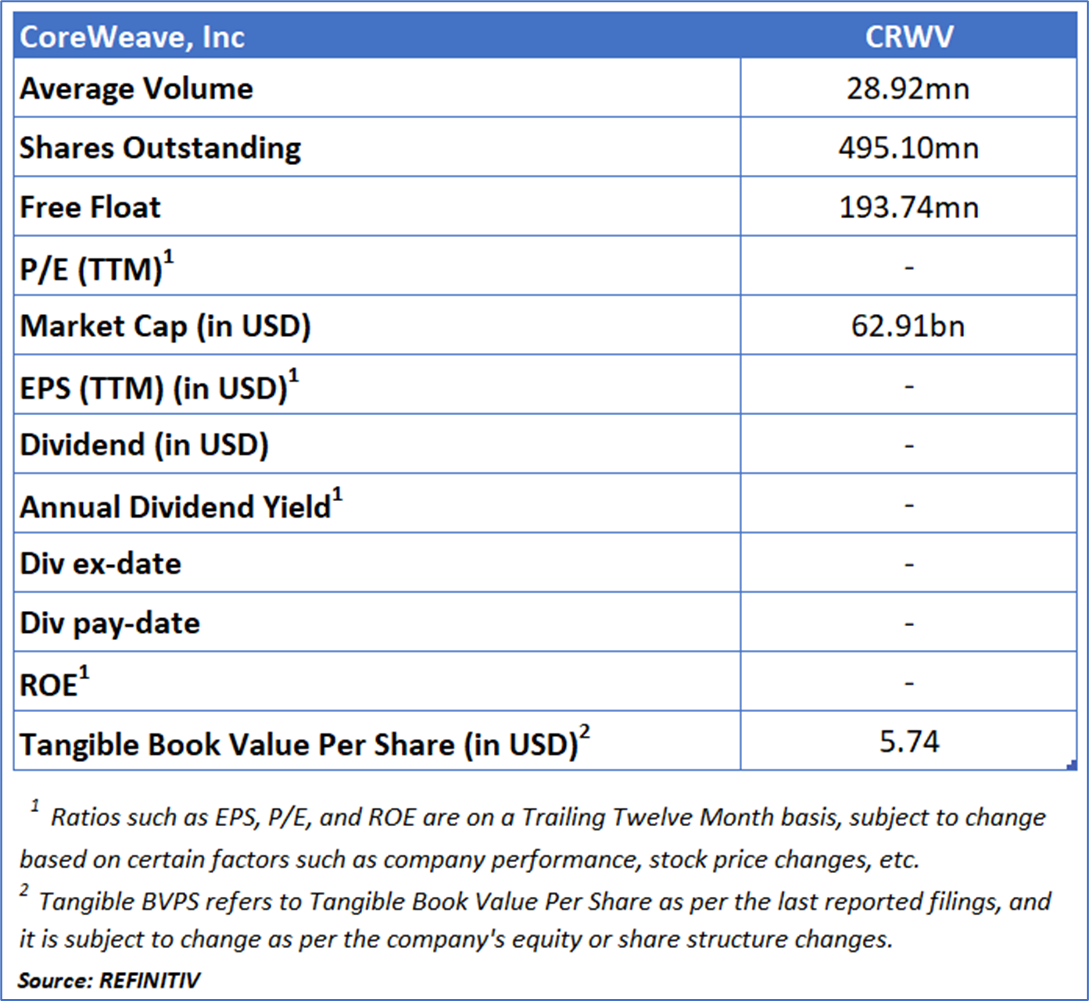
CoreWeave, Inc (NASDAQ: CRWV) is a cloud infrastructure firm that provides the CoreWeave Cloud Platform, a suite of software and cloud-based services designed to automate and optimize the management of complex artificial intelligence (AI) computing environments.
Kalkine’s American Tech Report covers the Company Overview, Key positives & negatives, Investment summary, Key investment metrics, Top 10 shareholding, Business updates and insights into company recent financial results, Key Risks & Outlook, Price performance and technical summary, Target Price, and Recommendation on the stock.
Price Performance:
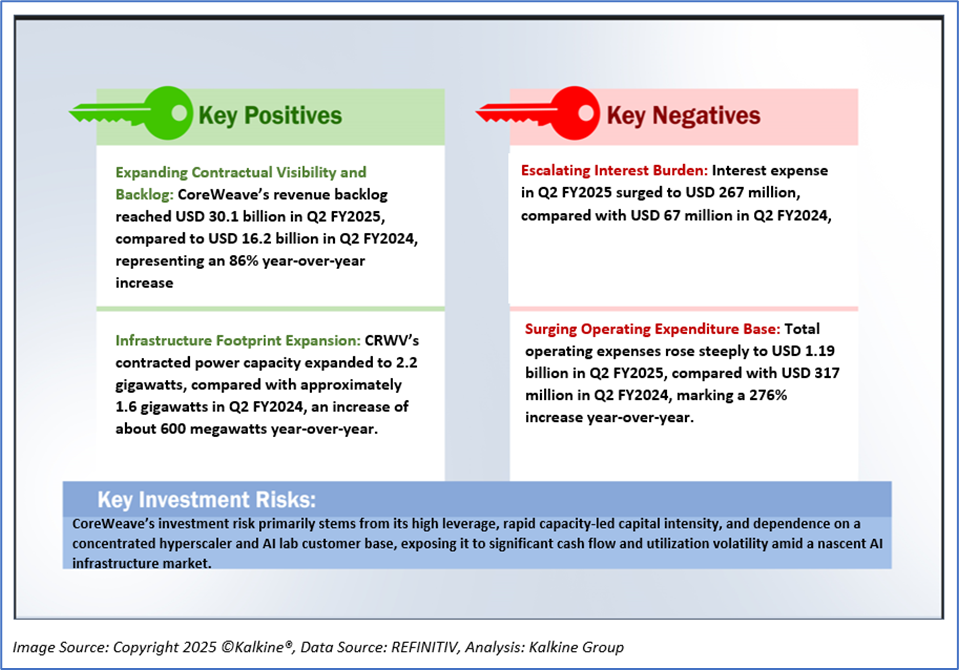
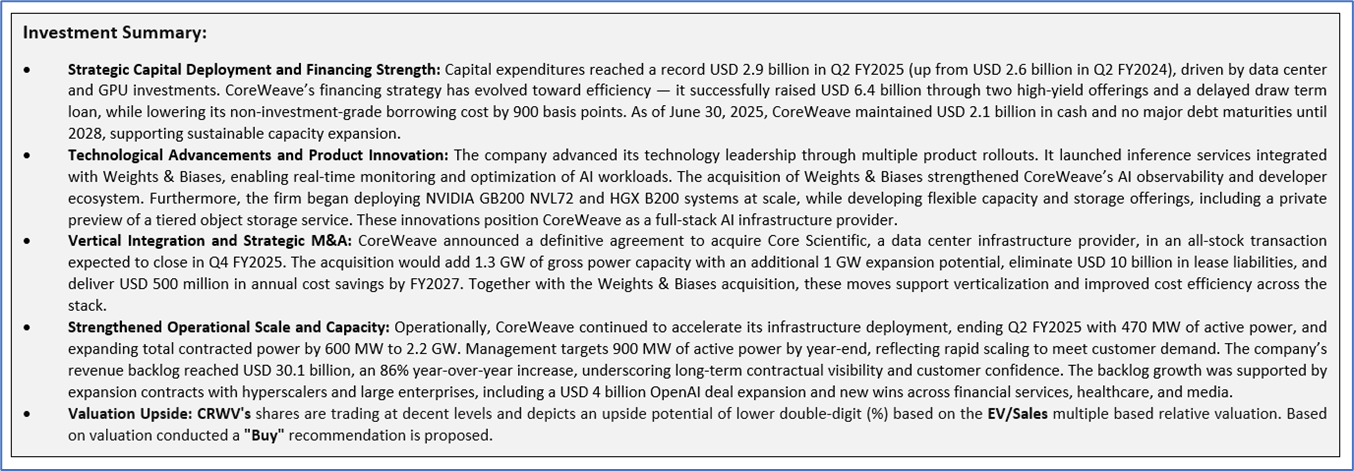
1.2 The Key Positives, Negatives, and Investment summary
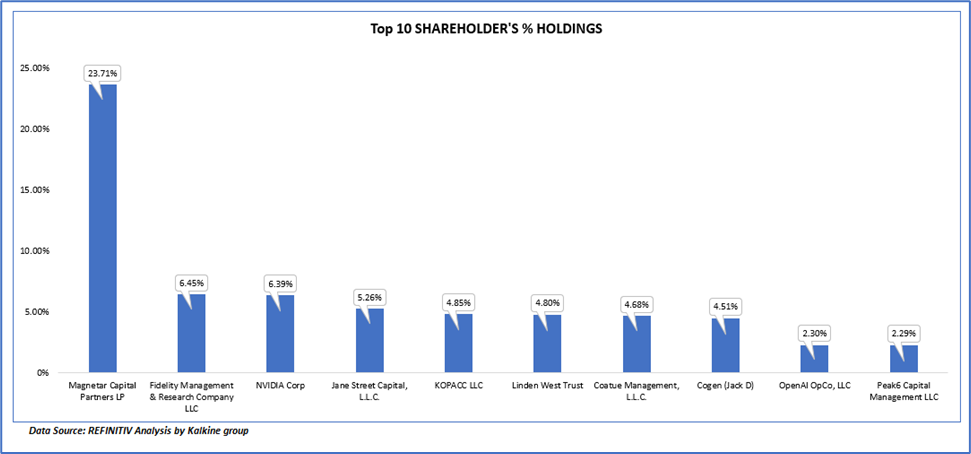
1.3 Top 10 shareholders:
The top 10 shareholders together form ~65.23% of the total shareholding, signifying concentrated shareholding. Magnetar Capital Partners LP. And Fidelity Management & Research Company LLC are the biggest shareholders, holding the maximum stake in the company at ~23.71% and ~6.45%, respectively.
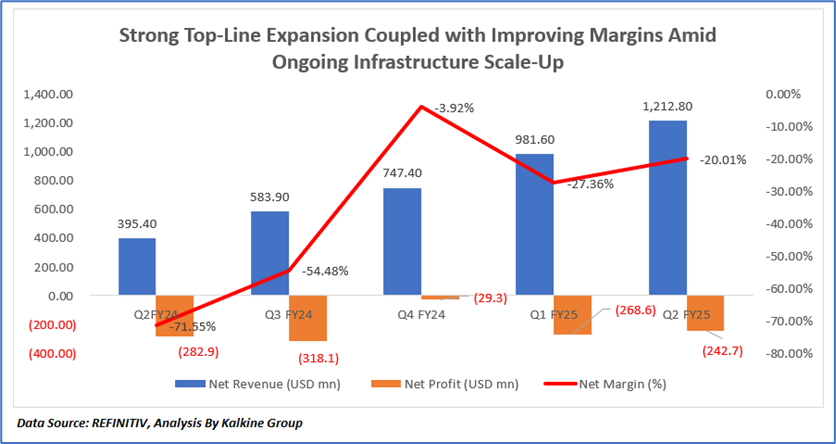
1.4 Key Metrics:
The graph illustrates CoreWeave’s strong revenue growth trajectory alongside gradual improvement in profitability metrics between Q2 FY2024 and Q2 FY2025. Net revenue increased sharply from USD 395 million in Q2 FY2024 to USD 1.21 billion in Q2 FY2025, driven by accelerated enterprise AI adoption, expansion of hyperscaler contracts such as OpenAI, and higher data center utilization. Although the company continued to report losses, net loss narrowed from USD 323 million to USD 243 million over the same period, reflecting better cost absorption and operating leverage. Gross margin showed notable recovery, improving from –71.6% in Q2 FY2024 to –20.0% in Q2 FY2025, supported by efficiency gains and optimized GPU deployment. The interim volatility visible between Q3 FY2024 and Q1 FY2025 reflects the impact of CoreWeave’s heavy capital investments, IPO-related expenses, and the acquisition of Weights & Biases, which temporarily inflated costs. Overall, the trend highlights a company transitioning from a hypergrowth phase to a more stable operating model, with robust revenue expansion gradually translating into improved profitability and margin recovery.
Section 2: Business Updates and Financial Highlights
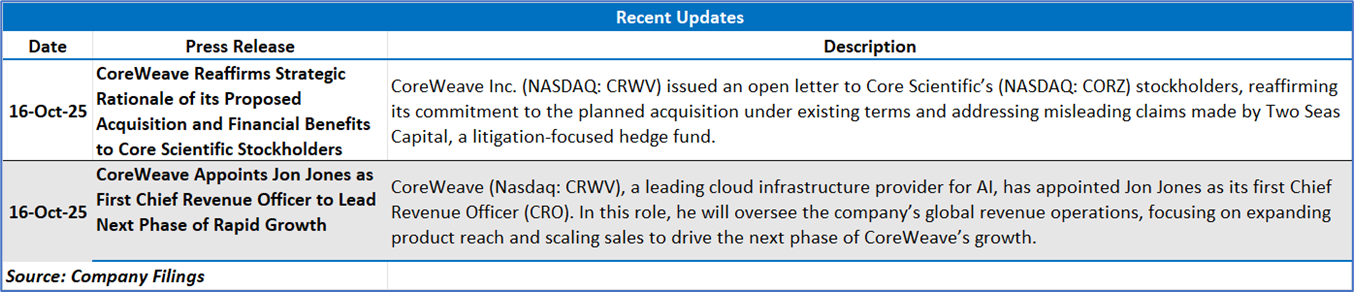
2.1 Recent Updates:
The below picture gives an overview of the recent updates:
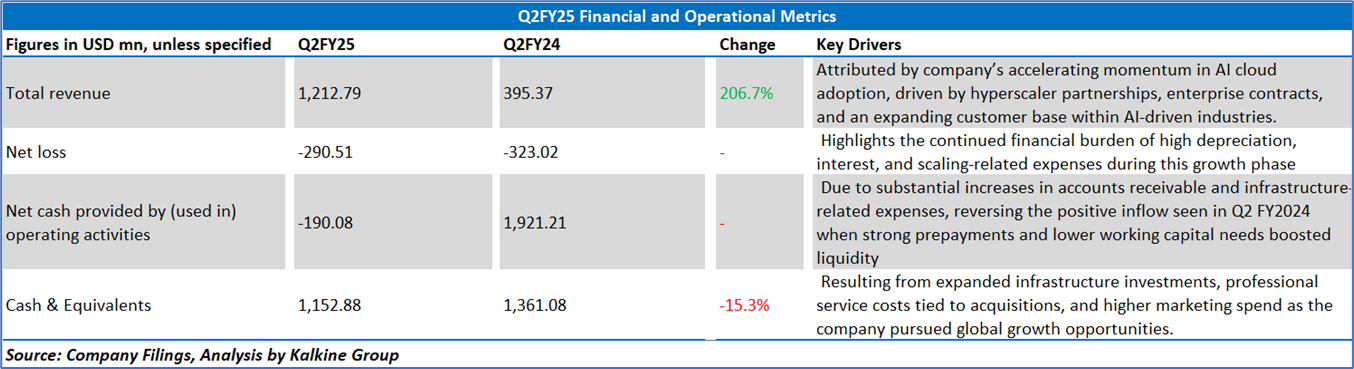
2.2 Insights of Q2FY25:
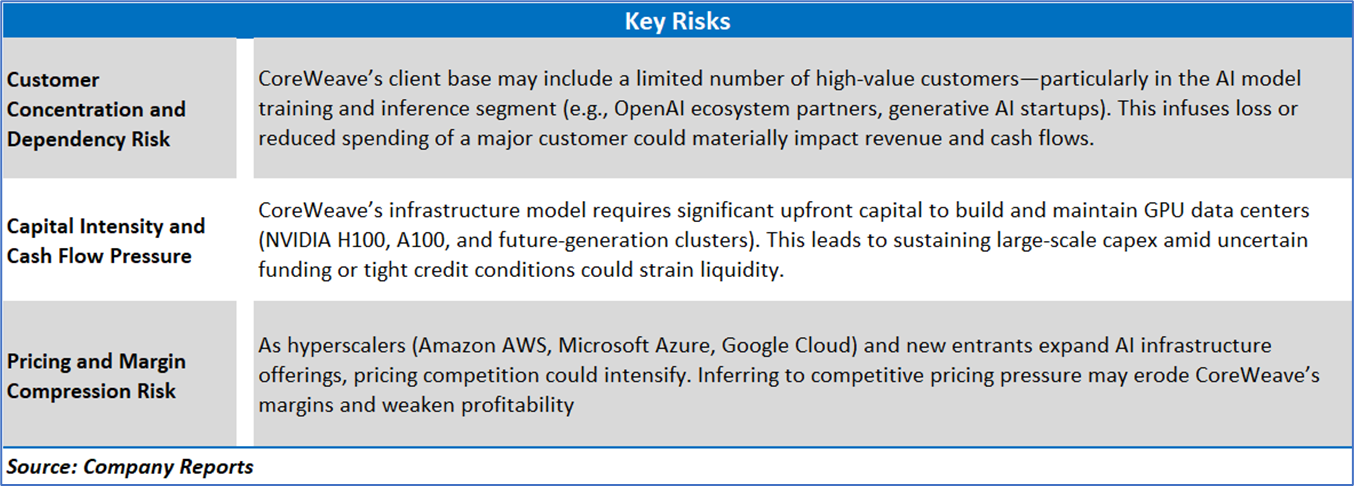
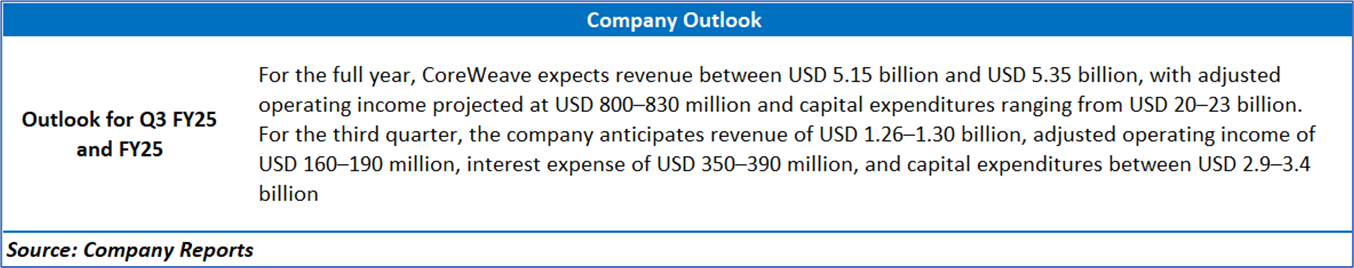
Section 3: Key Risks and Outlook:
Section 4: Stock Recommendation Summary:
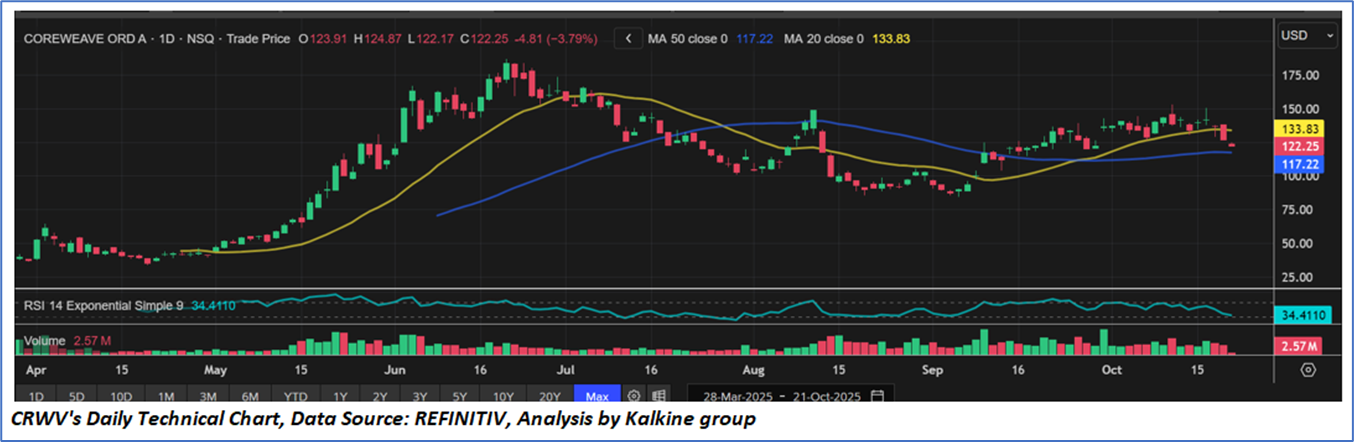
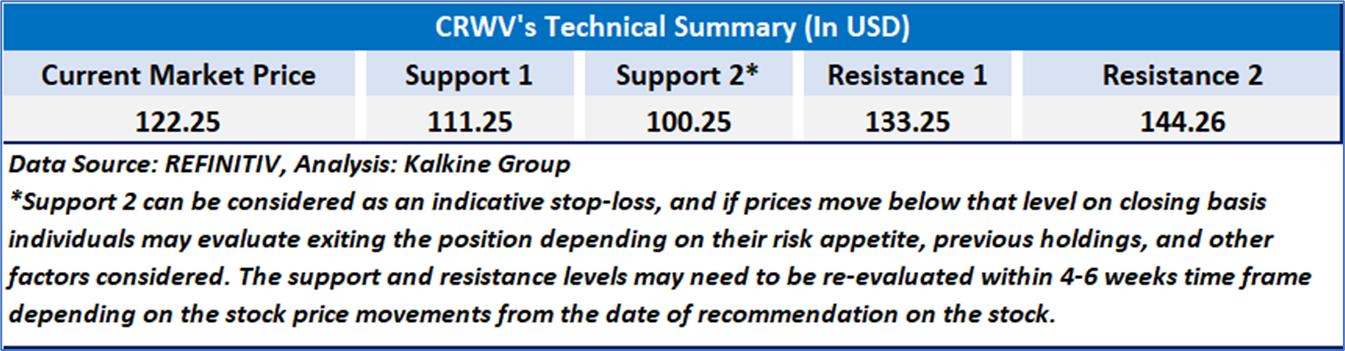
4.1 Technical Summary:
Price Performance:
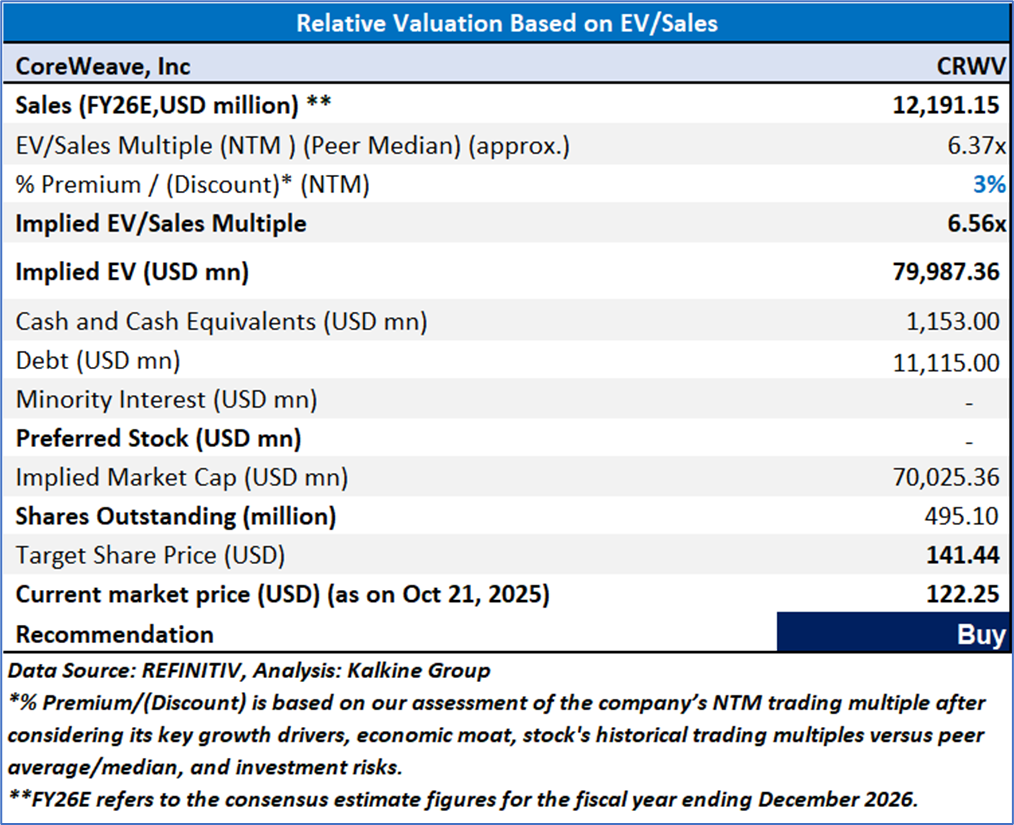
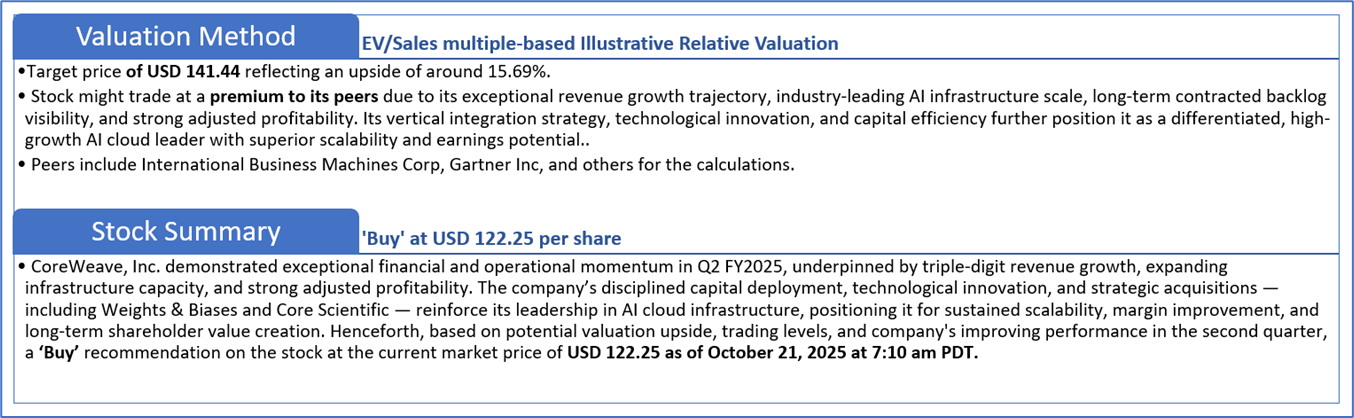
4.2 Fundamental Valuation
Valuation Methodology: EV/Sales Multiple Based Relative Valuation
Markets are trading in a highly volatile zone currently due to certain macroeconomic issues and geopolitical tensions prevailing. Therefore, it is prudent to follow a cautious approach while investing.
Note 1: Past performance is not a reliable indicator of future performance.
Note 2: The reference date for all price data, currency, technical indicators, support, and resistance levels is October 21, 2025. The reference data in this report has been partly sourced from REFINITIV.
Note 3: Investment decisions should be made depending on an individual's appetite for upside potential, risks, holding duration, and any previous holdings. An 'Exit' from the stock can be considered if the Target Price mentioned as per the Valuation and or the technical levels provided has been achieved and is subject to the factors discussed above.
Note 4: The report publishing date is as per the Pacific Time Zone.
Technical Indicators Defined: -
Support: A level at which the stock prices tend to find support if they are falling, and a downtrend may take a pause backed by demand or buying interest. Support 1 refers to the nearby support level for the stock and if the price breaches the level, then Support 2 may act as the crucial support level for the stock.
Resistance: A level at which the stock prices tend to find resistance when they are rising, and an uptrend may take a pause due to profit booking or selling interest. Resistance 1 refers to the nearby resistance level for the stock and if the price surpasses the level, then Resistance 2 may act as the crucial resistance level for the stock.
Stop-loss: It is a level to protect against further losses in case of unfavorable movement in the stock prices.
Kalkine Equities LLC, with Delaware File Number 4697384, Foreign Qualification Registration in California File Number 202109211078, and Texas File Number 805521396, is authorized to provide general advice only. The information on https://kalkine.com/ does not take into account any of your investment objectives, financial situation or needs. You should consider the appropriateness of advice taking into account your own objectives, financial situation and needs and seek independent financial advice before making any financial decisions. The link to our Terms and Conditions and Privacy Policy has been provided for your reference. On the date of publishing the reports (mentioned on the website), employees and/or associates of Kalkine do not hold positions in any of the stocks covered on the website. These stocks can change any time and readers of the reports should not consider these stocks as advice or recommendations later.
Past performance is not a reliable indicator of future performance.
 Please wait processing your request...