
Global Commodity Market Wrap-Up
Last week, the metals market showed a clear positive trend. Gold exhibited resilience with a modest gain of 0.30%, while silver saw a notable increase of 3.37%. Base metals experienced robust results: copper rose by 2.75%, zinc gained 5.54%, and lead surged by 5.08%. This varied performance contrasts with the previous week's stability, reflecting a shift towards a more bullish sentiment in the metals market.
Last week, Natural Gas prices stayed mostly stable with a slight decline of -2.98%, likely due to supply changes or seasonal factors. Crude Oil prices also fell a bit by -0.94%, reflecting growing market confidence. In contrast, US Sugar prices in the agricultural sector rose by 2.00%, contributing to a positive trend in agricultural commodities amid the varied performance across different sectors.
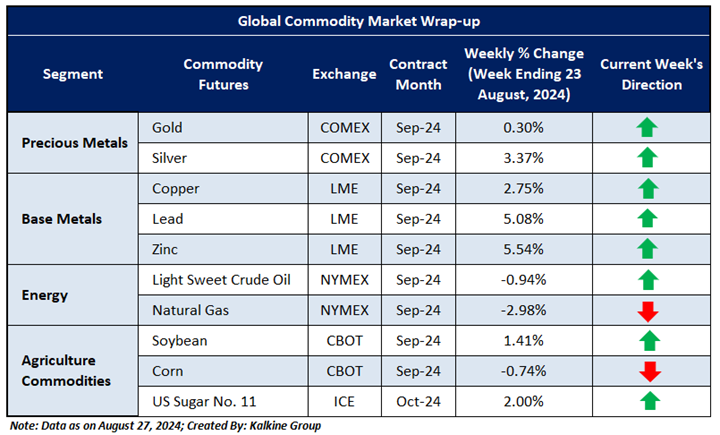
Global commodities have recently rebounded from their lows due to various global factors. Precious metals are holding above support levels with a mild bullish trend. In the energy sector, Natural Gas shows neutral momentum, while Crude Oil prices are breaking through support levels. Conversely, agricultural commodities are experiencing an upward trend.
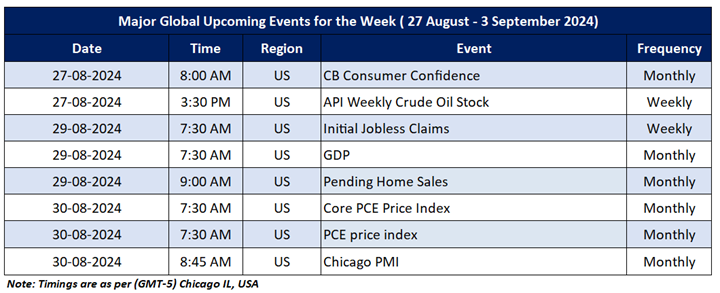
The upcoming Micro and Macroeconomic events that may impact market sentiments include an update on the CB Consumer Confidence, Initial Jobless Claims, GDP, Core PCE Price Index, Pending Home Sales.
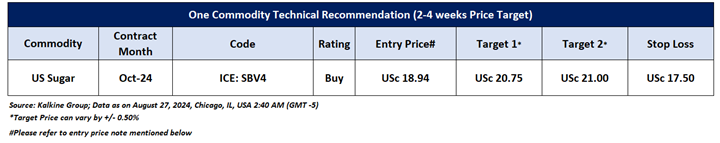
Having understood the global commodities performance over the past week, taking cues from major global economic events, and based on technical analysis, noted below is the recommendation with the generic insights, entry price, target prices, and stop-loss for US Sugar October Future (ICE: SBV4) for the next 2-4 weeks duration:
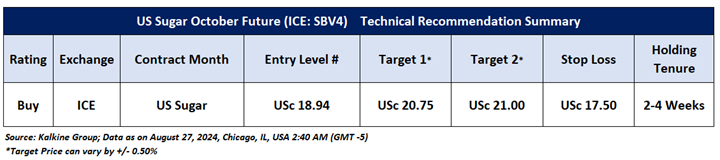
US Sugar October Future (ICE: SBV4)
Price Action and Technical Indicator Analysis:
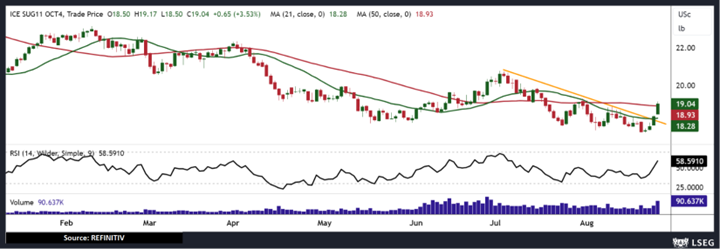
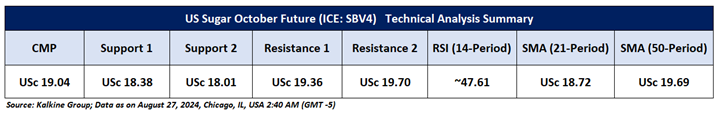
In October, US Sugar futures showed a bullish trend, positively influencing the base agriculture prices index. This increase comes amid decreased global tensions, creating a favorable trading environment. Technically, prices are above a downward trend line, suggesting a possible trend reversal. A solid bottom on daily charts indicates strong support levels. The Relative Strength Index (RSI) at 58.59 points to the potential for further gains. Currently, prices are above the 21-period Simple Moving Average (SMA), suggesting support, but trading below the 50-period SMA, which may act as near-term resistance.
Now the next crucial Resistance levels appear to be at USc 20.75 and USc 21.00, and prices may test these levels in the coming sessions (2-4 weeks).
As per the above-mentioned price action and technical indicators analysis, US Sugar October Future (ICE: SBV4) is looking technically well-placed for a ‘Buy’ rating. Investment decisions should be made depending on an individual’s appetite for downside potential, risks, and any previous holdings. This recommendation is purely based on technical analysis, and fundamental analysis has not been considered in this report. Technical summary of the ‘Buy’ recommendation is as follows:
Upcoming Major Global Economic Events
Market events occur on a day-to-day basis depending on the frequency of the data and generally include an update on employment, inflation, GDP, WASDE report, consumer sentiments, etc. Noted below are the upcoming week's major global economic events that could impact the commodities prices:
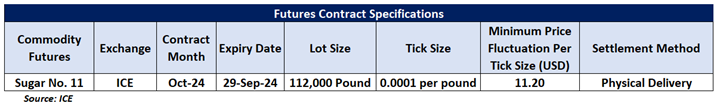
Futures Contract Specifications
Disclaimers
Related Risks: Based on the technical analysis, the risks are defined as per risk-reward ratio (~0.80:1.00), however, returns are generated within a 2-4 weeks’ time frame. This may be looked at by Individuals with sufficient risk appetite looking for returns within short investment duration. The investment recommendations provided in this report are solely based on technical parameters, and the fundamental performance of the commodities has not been considered in the decision-making process. Other factors which could impact commodity prices include market risks, regulatory risks, interest rates risk, currency risks, and social and political instability risks etc.
Note 1: Past performance is not a reliable indicator of future performance.
Note 2: Individuals can consider exiting from the commodity if the Target Price mentioned as per the Technical Analysis has been achieved and subject to the factors discussed above.
Note 3: How to Read the Charts?
The Green colour line reflects the 21-period moving average while the red line indicates the 50- period moving average. SMA helps to identify existing price trend. If the prices are trading above the 21-period and 50-period moving average, then it shows prices are currently trading in a bullish trend.
The Black colour line in the chart’s lower segment reflects the Relative Strength Index (14-Period) which indicates price momentum and signals momentum in trend. A reading of 70 or above suggests overbought status while a reading of 30 or below suggests an oversold status.
The Blue colour bars in the chart’s lower segment show the volume of the commodity. Commodity with high volumes is more liquid compared to the lesser ones. Liquidity in commodity helps in easier and faster execution of the order.
The Orange colour lines are the trend lines drawn by connecting two or more price points and used for trend identification purposes. The trend line also acts as a line of support and resistance.
Technical Indicators Defined: -
Support: A level at which the stock prices tend to find support if they are falling, and a downtrend may take a pause backed by demand or buying interest. Support 1 refers to the nearby support level for the stock and if the price breaches the level, then Support 2 may act as the crucial support level for the stock.
Resistance: A level at which the stock prices tend to find resistance when they are rising, and an uptrend may take a pause due to profit booking or selling interest. Resistance 1 refers to the nearby resistance level for the stock and if the price surpasses the level, then Resistance 2 may act as the crucial resistance level for the stock.
Stop-loss: It is a level to protect further losses in case of unfavourable movement in the stock prices.
Risk Reward Ratio: The risk reward ratio is the difference between an entry point to a stop loss and profit level. This report is based on ~80% Stop Loss of the Target 1 from the entry point.
The reference date for all price data, volumes, technical indicators, support, and resistance levels is August 27, 2024 (Chicago, IL, USA 2:40 AM (GMT-5). The reference data in this report has been partly sourced from REFINITIV.
Note: Trading decisions require a thorough analysis by individuals. Technical reports, in general, chart out metrics that may be assessed by individuals before any commodity evaluation. The above are illustrative analytical factors used for evaluating the commodity; other parameters can be looked at along with additional risks per se.
Kalkine Equities LLC, with Delaware File Number 4697384, Foreign Qualification Registration in California File Number 202109211078, and Texas File Number 805521396, is authorized to provide general advice only. The information on https://kalkine.com/ does not take into account any of your investment objectives, financial situation or needs. You should consider the appropriateness of advice taking into account your own objectives, financial situation and needs and seek independent financial advice before making any financial decisions. The link to our Terms and Conditions and Privacy Policy has been provided for your reference. On the date of publishing the reports (mentioned on the website), employees and/or associates of Kalkine do not hold positions in any of the stocks covered on the website. These stocks can change any time and readers of the reports should not consider these stocks as advice or recommendations later.
Copyright © 2024 Krish Capital Pty Ltd. All rights reserved.
 US
US  AU
AU UK
UK CA
CA NZ
NZ Please wait processing your request...