
 CA
 NZ
 UK
 AU
 IND

 US

Section 1: Company Overview and Fundamentals
1.1 Company Overview:
Amazon.com, Inc (NASDAQ: AMZN) operates a broad, diversified platform delivering products and digital services across global markets. Its retail ecosystem includes goods and digital content sold directly by the company, alongside offerings from third-party merchants. The business is structured across three primary segments—North America, International, and Amazon Web Services (AWS). It reaches customers through online marketplaces, mobile applications, voice-enabled devices such as Alexa, streaming platforms, proprietary hardware, and a network of physical retail locations, with a continued emphasis on wide selection, competitive pricing, and seamless convenience.
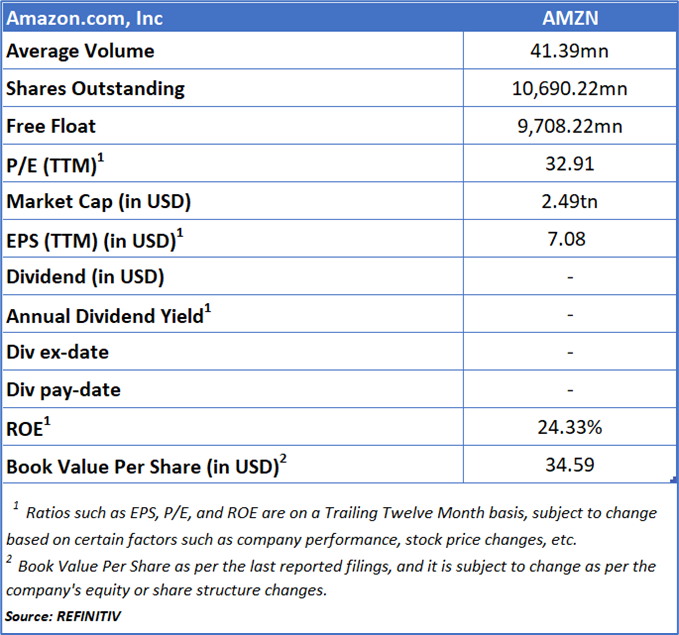
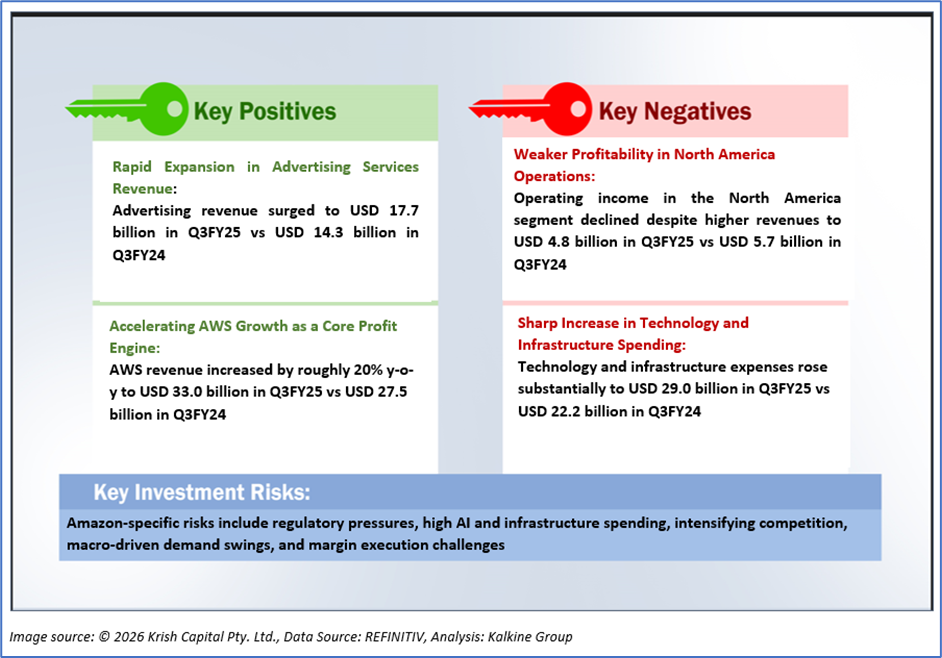
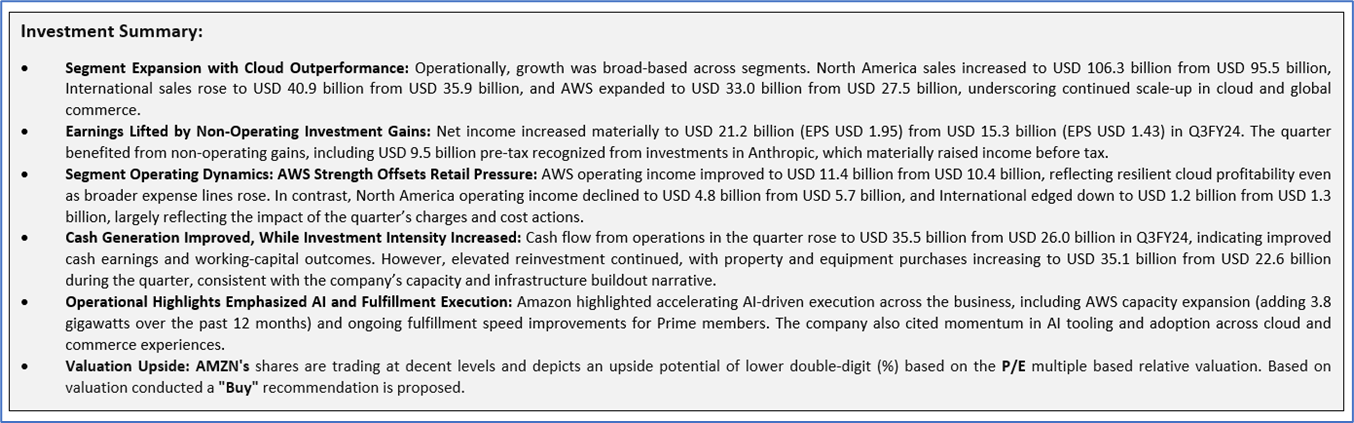
Kalkine’s Diversified Opportunities Report covers the Company Overview, Key positives & negatives, Investment summary, Key investment metrics, Top 10 shareholding, Business updates and insights into company recent financial results, Key Risks & Outlook, Price performance and technical summary, Target Price, and Recommendation on the stock.
Stock Performance:
1.2 The Key Positives, Negatives, and Investment summary
1.3 Top 10 shareholders:
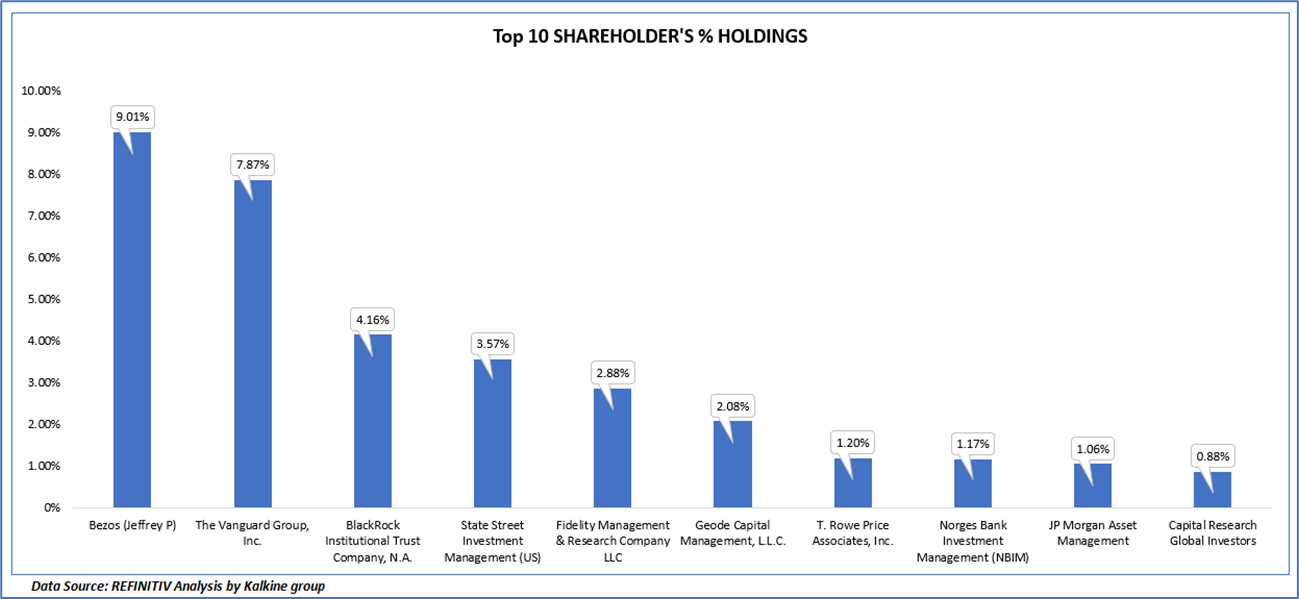
The top 10 shareholders together form ~ 33.88% of the total shareholding, signifying concentrated shareholding. Bezos (Jeffrey P) and The Vanguard Group, Inc. are the biggest shareholders, holding the maximum stake in the company at 9.01% and 7.87%, respectively.
1.4 Key Metrics:
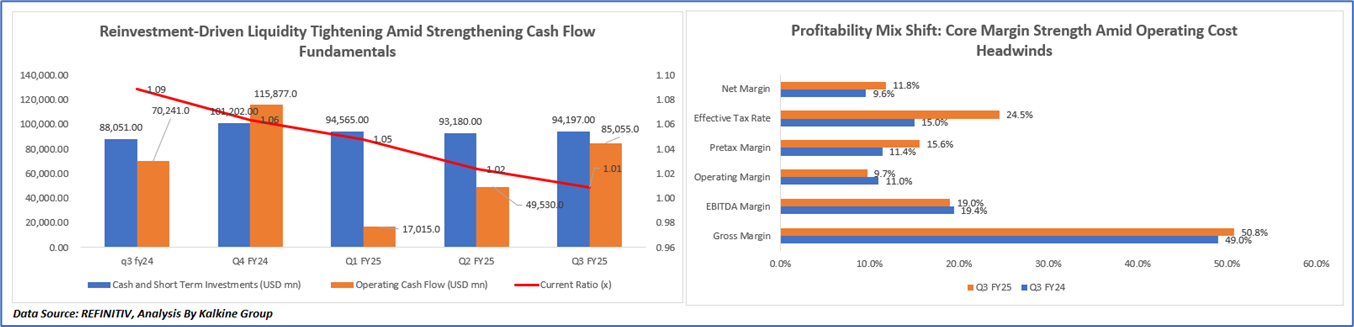
1) Reinvestment-Driven Liquidity Tightening Amid Strengthening Cash Flow Fundamentals
The liquidity trend illustrated in the chart highlights a period of heightened financial transition for Amazon, marked by short-term pressure on liquidity alongside strengthening underlying cash generation. Operating cash flow experienced a sharp contraction in Q1 FY25, largely reflecting the impact of one-time legal settlements, restructuring costs, and a surge in operating and infrastructure-related expenditures as the company accelerated investments in AI capabilities, cloud capacity, and fulfillment network expansion. This temporary compression was followed by a meaningful rebound in Q2 and Q3 FY25 as core business profitability improved, higher-margin segments such as AWS and advertising scaled further, and working-capital efficiency normalized, restoring stronger cash inflows.
At the same time, cash and short-term investments remained broadly stable but showed a mild downward drift across the period, signaling that incremental operating cash was being actively deployed into capital expenditures rather than accumulated on the balance sheet. This reflects Amazon’s strategic emphasis on long-term growth through capacity build-out and technological leadership, even at the expense of near-term liquidity buffers. The steadily declining current ratio reinforces this narrative, indicating tighter short-term financial flexibility as higher capex, investment outflows, and operating cost absorption increased current liabilities relative to liquid assets. Collectively, the chart suggests that while Amazon’s core cash-earning power is strengthening, the company is deliberately prioritizing reinvestment and scale expansion over short-term liquidity optimization, positioning itself for sustained competitive advantage but with elevated near-term financial intensity.
2) Profitability Mix Shift: Core Margin Strength Amid Operating Cost Headwinds
Profitability chart shows that margin expansion at the gross and EBITDA levels in Q3 FY25 was driven by stronger contributions from high-margin segments such as AWS and advertising, along with scale efficiencies across the platform, while operating margin softened due to elevated infrastructure spending, restructuring costs, and one-time legal charges that increased the cost base. Despite this pressure, pretax and net margins improved primarily because of significant non-operating investment gains, which boosted earnings before tax, though the benefit was partly offset by a higher effective tax rate. Overall, the trend reflects improving core business economics tempered by heavy reinvestment and exceptional costs, with bottom-line profitability supported by non-operating income.
Section 2: Business Updates and Corporate Business Highlights
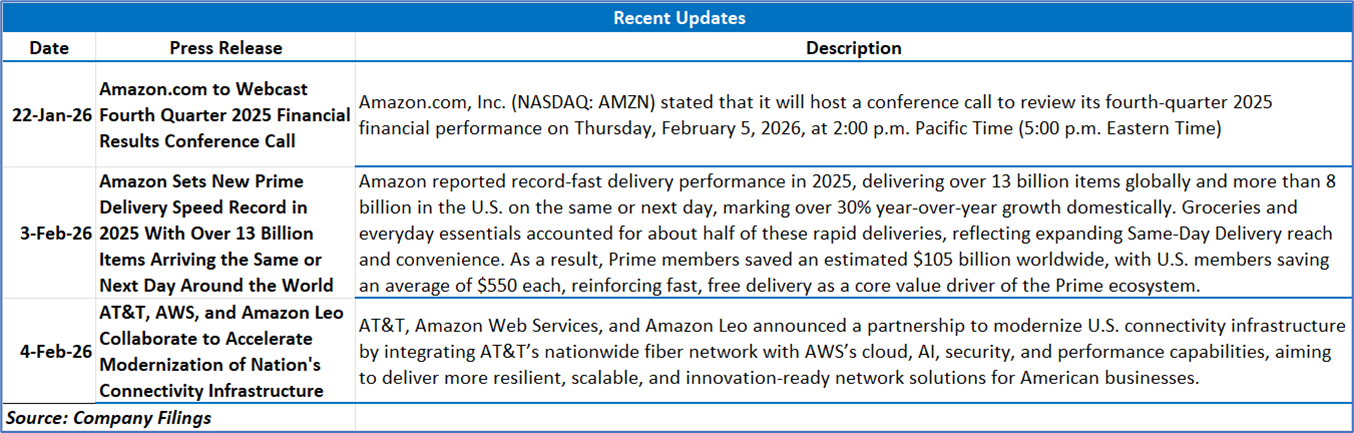
2.1 Recent Business Updates
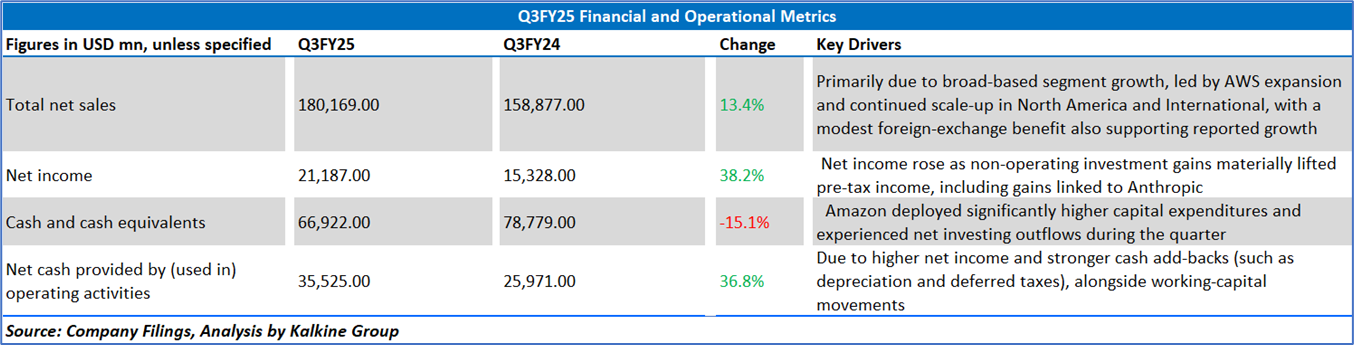
2.2 Insights of Q3FY25:
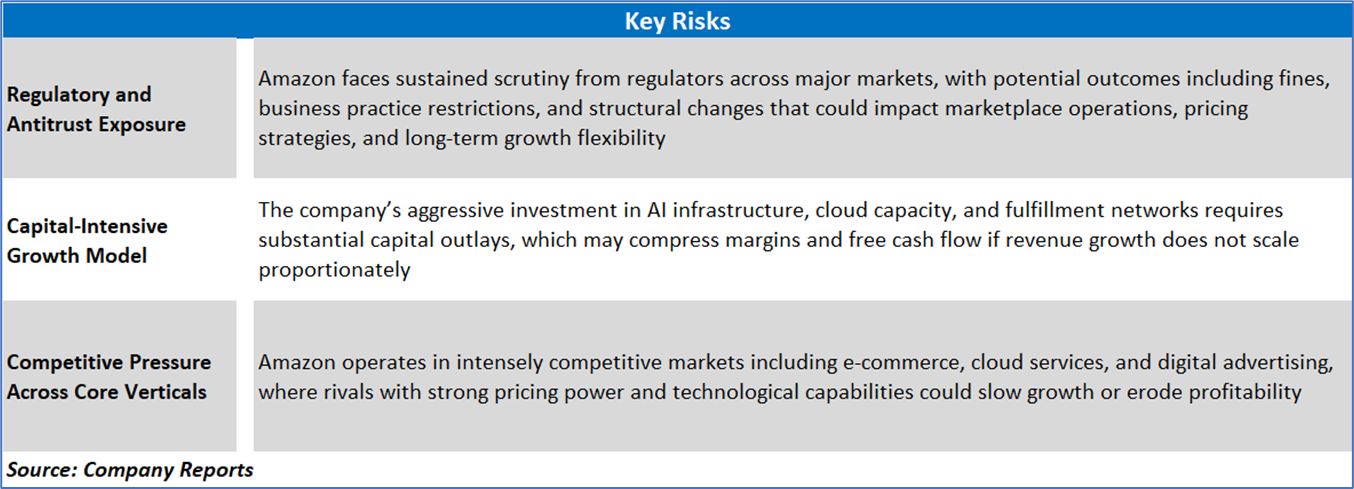
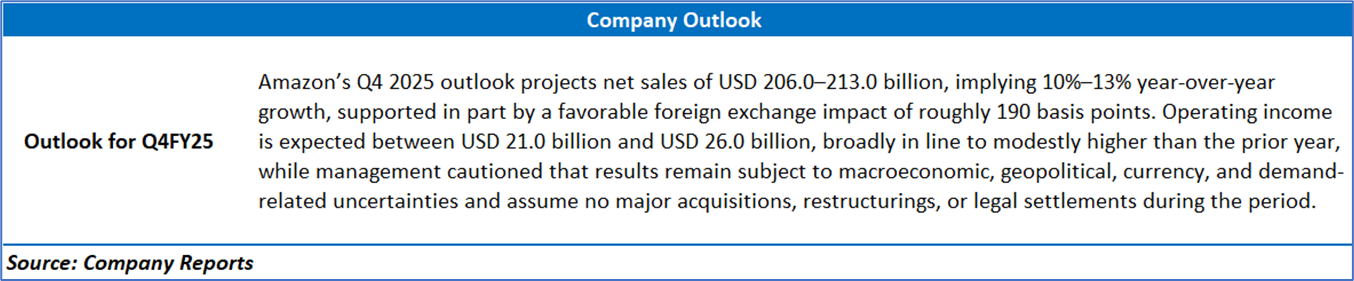
Section 3: Key Risks & Outlook
Section 4: Stock Recommendation Summary:
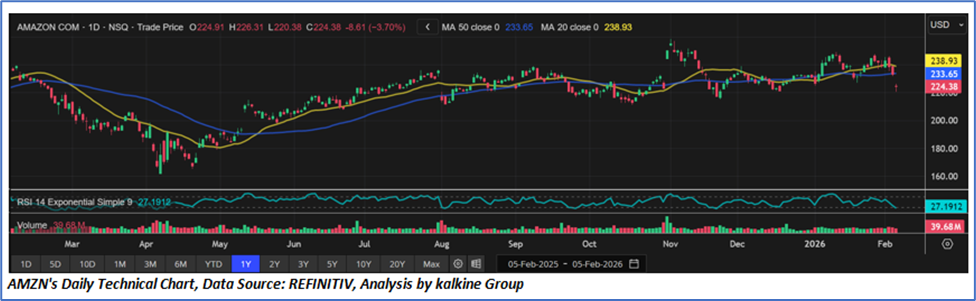
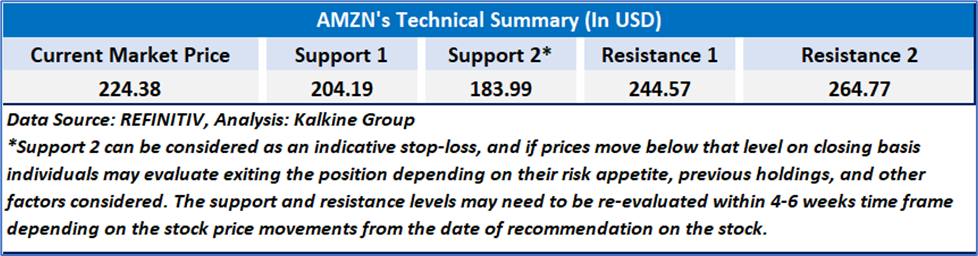
4.1 Price Performance and Technical Summary:
Stock Performance:
4.2 Fundamental Valuation
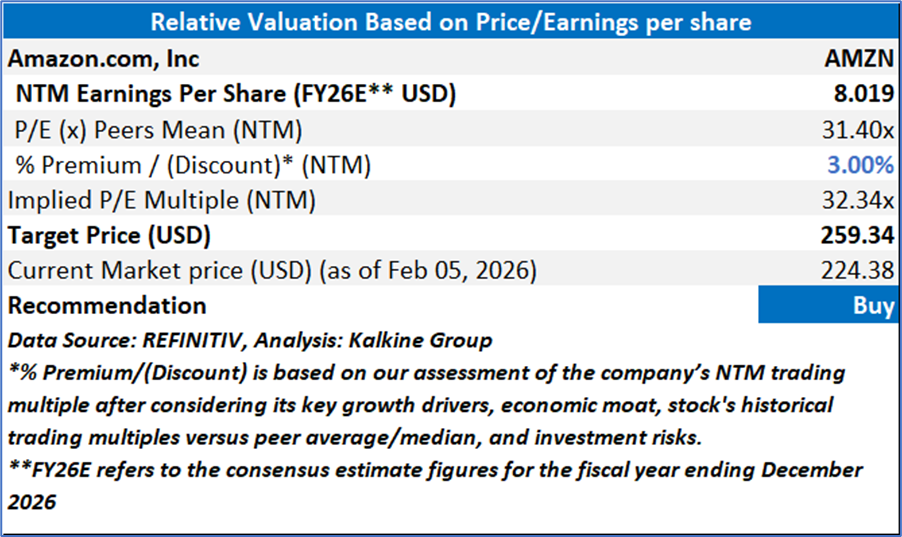
Valuation Methodology: Price/Earnings Multiple Based Relative Valuation
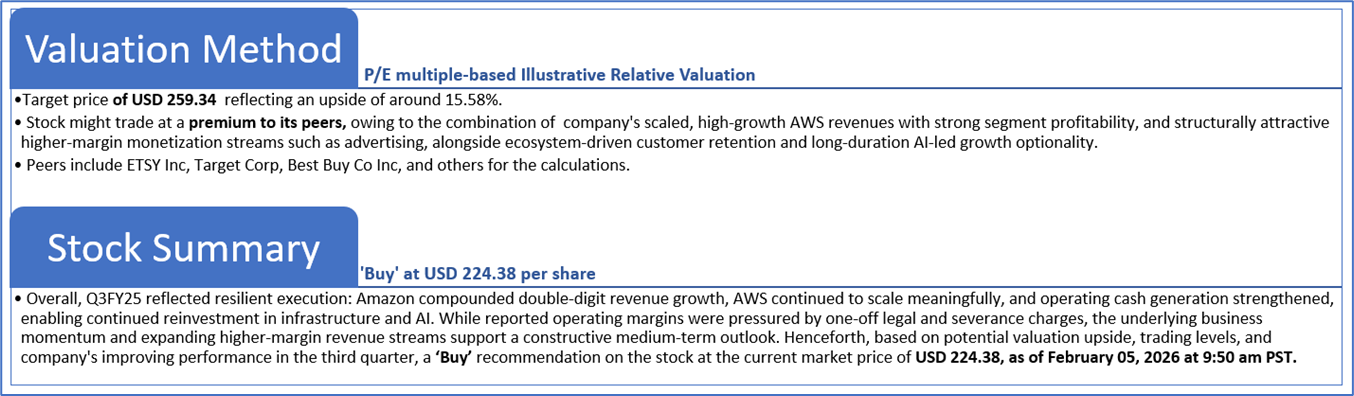
Markets are trading in a highly volatile zone currently due to certain macroeconomic issues and geopolitical tensions prevailing. Therefore, it is prudent to follow a cautious approach while investing.
Note 1: Past performance is not a reliable indicator of future performance.
Note 2: The reference date for all price data, currency, technical indicators, support, and resistance levels is February 05, 2026. The reference data in this report has been partly sourced from REFINITIV.
Note 3: Investment decisions should be made depending on an individual's appetite for upside potential, risks, holding duration, and any previous holdings. An 'Exit' from the stock can be considered if the Target Price mentioned as per the Valuation and or the technical levels provided has been achieved and is subject to the factors discussed above.
Note 4: The report publishing date is as per the Pacific Time Zone.
Technical Indicators Defined: -
Support: A level at which the stock prices tend to find support if they are falling, and a downtrend may take a pause backed by demand or buying interest. Support 1 refers to the nearby support level for the stock and if the price breaches the level, then Support 2 may act as the crucial support level for the stock.
Resistance: A level at which the stock prices tend to find resistance when they are rising, and an uptrend may take a pause due to profit booking or selling interest. Resistance 1 refers to the nearby resistance level for the stock and if the price surpasses the level, then Resistance 2 may act as the crucial resistance level for the stock.
Stop-loss: It is a level to protect against further losses in case of unfavorable movement in the stock prices.
Kalkine Equities LLC, with Delaware File Number 4697384, Foreign Qualification Registration in California File Number 202109211078, and Texas File Number 805521396, is authorized to provide general advice only. The information on https://kalkine.com/ does not take into account any of your investment objectives, financial situation or needs. You should consider the appropriateness of advice taking into account your own objectives, financial situation and needs and seek independent financial advice before making any financial decisions. The link to our Terms and Conditions and Privacy Policy has been provided for your reference. On the date of publishing the reports (mentioned on the website), employees and/or associates of Kalkine do not hold positions in any of the stocks covered on the website. These stocks can change any time and readers of the reports should not consider these stocks as advice or recommendations later.
Past performance is not a reliable indicator of future performance.
 Please wait processing your request...