
 CA
 NZ
 UK
 AU
 IND

 US

 Share
 X (Formerly Twitter)
 Whatsapp
 Facebook
 LinkedIn
 Telegram
 Email This Article
 Copy Link
 Summarize with AI
 Chat GPT
 Perplexity

Wolfspeed, Inc. (NYSE: WOLF), the North Carolina-based silicon carbide and GaN chipmaker, is posting one of its stronger sessions in weeks. As of this chart snapshot (Wednesday, October 1, with about three hours left), shares are trading at $29.80, up $1.67 (+5.94%). The stock opened at $28.72, dipped to $28.03, and has pushed to an intraday high of $30.64. The advance carries price above the 21-day EMA and into a test of the 63-day EMA at $29.74, the level that has capped every rally since the July breakdown. I could not find a company-specific catalyst for today's move, so the case rests on the chart. 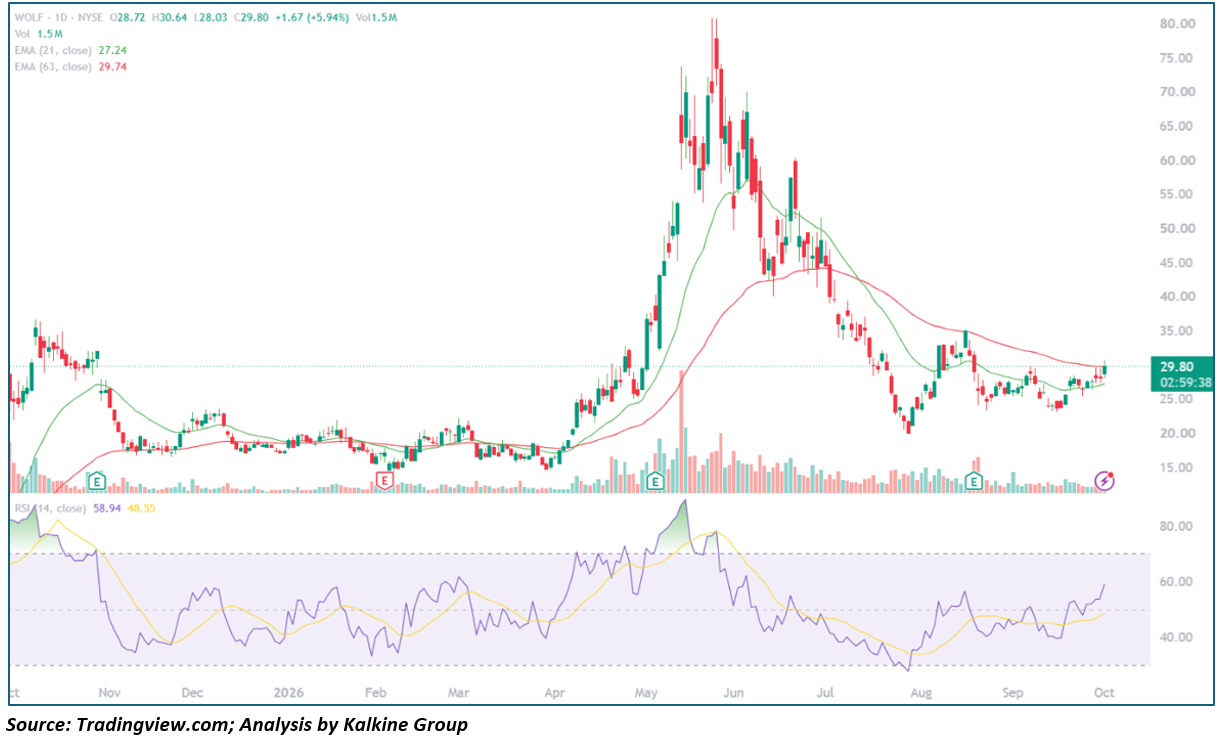
Key Highlights
- Trading at $29.80, up $1.67 (+5.94%), on partial-session Volume of 1.5M shares
- Opened at $28.72, low of $28.03, high of $30.64
- 21-day EMA at $27.24 (price now above it); 63-day EMA at $29.74 (price testing it)
- 14-day RSI at 58.94, well above its 48.55 signal line
- Resistance at $30.64 and $35; support at $28 and $27.24
Trend Structure: Three-Act Pattern
WOLF's Daily Chart over the past twelve months shows a long base, a parabolic spike and a deep Retracement that has now stabilized:
- Base Building (October 2025 – April 2026): The stock fell from the mid-$30s in October to the high teens by November, then ground sideways in a narrow $15 to $23 range through March, with the EMAs flat and tightly bunched. A low near $15 in early April marked the bottom of the base.
- Parabolic Spike and Reversal (April – July 2026): The breakout from the base was explosive, taking the stock from about $15 to a peak near $81 in late May, with RSI pushing above 85 and volume surging. The reversal was just as sharp: a drop to about $40 in mid-June, a failed bounce to about $60, and a slide to a low near $20 in late July.
- Rebuilding and Compression (August – October 2026): A rebound carried price to about $35 in mid-August, but it stalled and pulled back to the mid-$20s. Since then the stock has traded in a tight $23 to $30 band, building a higher low near $23 in mid-September. The 21-day EMA has flattened and turned up, and RSI has climbed from the 30s to the high 50s. Today's move is the first test of the 63-day EMA from below in this phase.
Backdrop
The chart shows Earnings markers near each of the major swings, and WOLF has reacted sharply to reports. The next earnings release is typically due in early to mid-November, so confirm the date, as results are likely the next significant catalyst. The stock has retraced about 75% of its May peak, so the market is still pricing in a lot of uncertainty about the recovery.
Moving Averages and Momentum Profile
- Moving Average Stack: Price at $29.80 is about 9% above the 21-day EMA ($27.24) and essentially level with the 63-day EMA ($29.74). The 21-day is still below the 63-day, so the longer-term trend stays negative until the faster average crosses back above.
- Oscillator Behavior: RSI at 58.94 has crossed above 50 and sits far above its signal line, which points to improving momentum without being overbought.
- Volume Behavior: Volume of 1.5M is partial, with the session still open, and is well below the heavy readings of May and June. A close on rising volume would add credibility to the move.
- Candle Structure: The stock held above $28 all day and is trading near the upper end of its range, which signals buyers in control so far.
Key Technical Levels
|
Level |
Type |
Note |
|
$45–$50 |
Resistance |
Late-June and early-July consolidation zone |
|
$35 |
Resistance |
Mid-August swing high |
|
$30.64 |
Resistance |
Today's intraday high |
|
$29.80 |
Reference |
Current price |
|
$29.74 |
Resistance/Pivot |
63-day EMA |
|
$28.72 |
Support |
Today's open |
|
$28.03 |
Support |
Today's low |
|
$27.24 |
Support |
21-day EMA |
|
$23 |
Support |
September low |
|
$20 |
Support |
Late-July cycle low |
Actionable Technical Outlook
- A daily close above the 63-day EMA and above $30.64 would be the first sign that the two-month base is resolving upward. The next resistance is the $35 mid-August high.
- Near-term structure stays constructive while the stock holds above $28 and the 21-day EMA near $27. A close back below that zone would turn today's move into a failed test of the 63-day EMA.
- The pattern since August is a range between roughly $23 and $35, so a rejection near $30 would keep the stock in that range. A break below $23 would reopen the $20 low.
- Because the session is still open, the closing price and volume could change this read. This is a technical read, not Investment advice.
Metadata
|
Field |
Value |
|
Headline |
Why is Wolfspeed (NYSE: WOLF) up 5.9% into its 63-day EMA, and can it break out of a two-month base? |
|
SEO title |
Wolfspeed (WOLF) Jumps 5.9%: 63-Day EMA Test and $35 Levels |
|
Meta description |
Wolfspeed (NYSE: WOLF) rallies 5.9% to $29.80 and tests its 63-day EMA. RSI 59, key support and resistance levels for traders. |
|
Slug |
why-wolfspeed-wolf-nyse-stock-rallied-63-day-ema-test-35-levels |
|
Tags |
Wolfspeed, WOLF, NYSE, silicon carbide, semiconductors, technical analysis, moving averages |
|
Ticker |
WOLF |
|
Sector |
Information Technology |
|
Verification status |
PARTIAL (price levels read from the chart; catalyst not confirmed) |
|
Data as-of date |
October 1, 2026 (intraday) |


 Nov 13, 2026





 Please wait processing your request...