
 CA
 NZ
 UK
 AU
 IND

 US

 Share
 X (Formerly Twitter)
 Whatsapp
 Facebook
 LinkedIn
 Telegram
 Email This Article
 Copy Link
 Summarize with AI
 Chat GPT
 Perplexity

Today's session delivered an aggressive, broad-based rally across IT services, consumer hardware, and semiconductor names. Garmin (NYSE: GRMN) led the entire group with a nearly 20% gap higher on a decisive breakout, while ExlService Holdings (NASDAQ: EXLS) and Cognizant (NASDAQ: CTSH) both posted gains above 11%. Clear Secure (NYSE: YOU), EPAM Systems (NYSE: EPAM), ServiceNow (NYSE: NOW), ServiceTitan (NASDAQ: TTAN), and Ambarella (NASDAQ: AMBA) all added between roughly 4% and 11%, with most names reclaiming or extending above their key moving averages. Navitas Semiconductor (NASDAQ: NVTS) and Sandisk (NASDAQ: SNDK) posted more modest bounces but remain well below their EMA clusters after steep corrections.
Garmin Ltd. (NYSE: GRMN) — Largest Gain in the Group, Explosive Gap to Fresh Highs
Key Highlights
- GRMN trading at $303.06, up 19.48% ($49.41) on volume of 2.31M shares, after ranging between $261.04 and $303.87 on an open at $261.81.
- Price has rocketed well above both the 20-day EMA ($248.66) and the 50-day EMA ($243.26), gapping cleanly through a choppy trading range that had capped the stock for most of the past year.
- RSI has spiked to roughly 81.74, with the signal line at 56.10 — a sharp move into deeply overbought territory on the back of today's gap.
- GRMN spent the bulk of the past year rangebound between roughly $190 and $280, with repeated failed attempts to break decisively higher, before today's gap clears that entire range in a single session.
- Today's percentage gain is by far the largest in the group, and the volume behind the move confirms strong conviction behind the breakout.
Trend Structure GRMN's chart shows a choppy, range-bound structure through most of the past year, oscillating between the high-$190s and roughly $280 with no clear directional resolution. Today's explosive gap up shatters that range entirely, pushing the stock to its best levels on the chart. 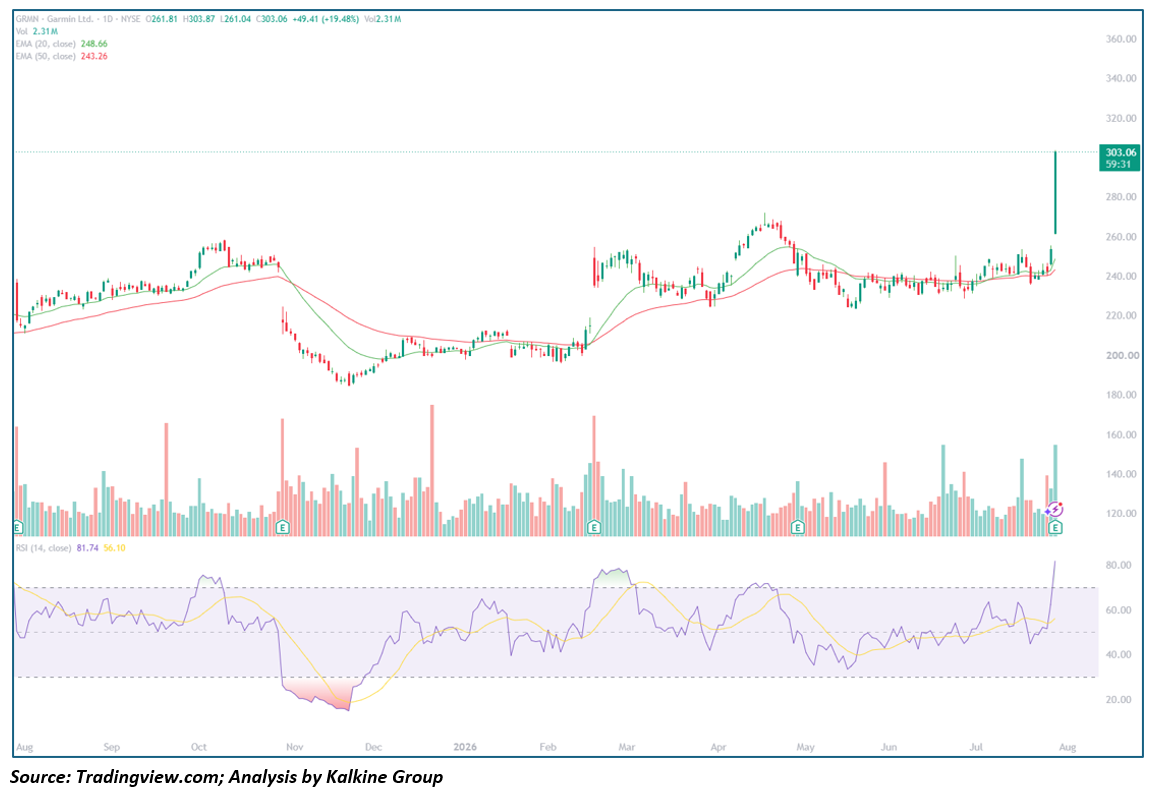
Key Technical Levels Resistance
- ~$310.00 – Psychological round-number level just above today's high
- No prior chart resistance overhead; the stock is in uncharted territory
Support
- $261.81 – Today's opening price / gap-fill level
- $248.66 – 20-day EMA
- $243.26 – 50-day EMA
Outlook GRMN's gap is a textbook breakout on heavy relative volume, but the extreme RSI reading raises the risk of near-term consolidation or a pullback to fill part of the gap. Holding above $280 on any retest would confirm the breakout has staying power; a full round-trip back into the prior range would suggest today's move was an overextension.
ExlService Holdings, Inc. (NASDAQ: EXLS) — Powerful Reversal, Decisive Break Above Both EMAs
Key Highlights
- EXLS trading at $35.85, up 17.43% ($5.32) on volume of 4.36M shares, after ranging between $31.05 and $36.15 on an open at $31.25.
- Price has surged well above both the 20-day EMA ($28.65) and the 50-day EMA ($28.58), which had been capping the stock from above for months.
- RSI has jumped to roughly 78.17, with the signal line at 53.60 — a steep move into overbought territory after a long, grinding downtrend.
- EXLS fell from a late-2025 high near $48 into a sharp gap-down low near $26 in early 2026, then spent months based in the high-$20s before today's powerful reversal.
- Today's gain is the largest single-day move on the chart, occurring on heavy volume relative to the stock's recent average.
Trend Structure EXLS's chart shows a steady decline through 2025 followed by a sharp gap-down in early 2026 that established a new, lower trading range. The stock spent the following months grinding sideways in the high-$20s before today's session broke decisively above both EMAs on a surge of buying interest. 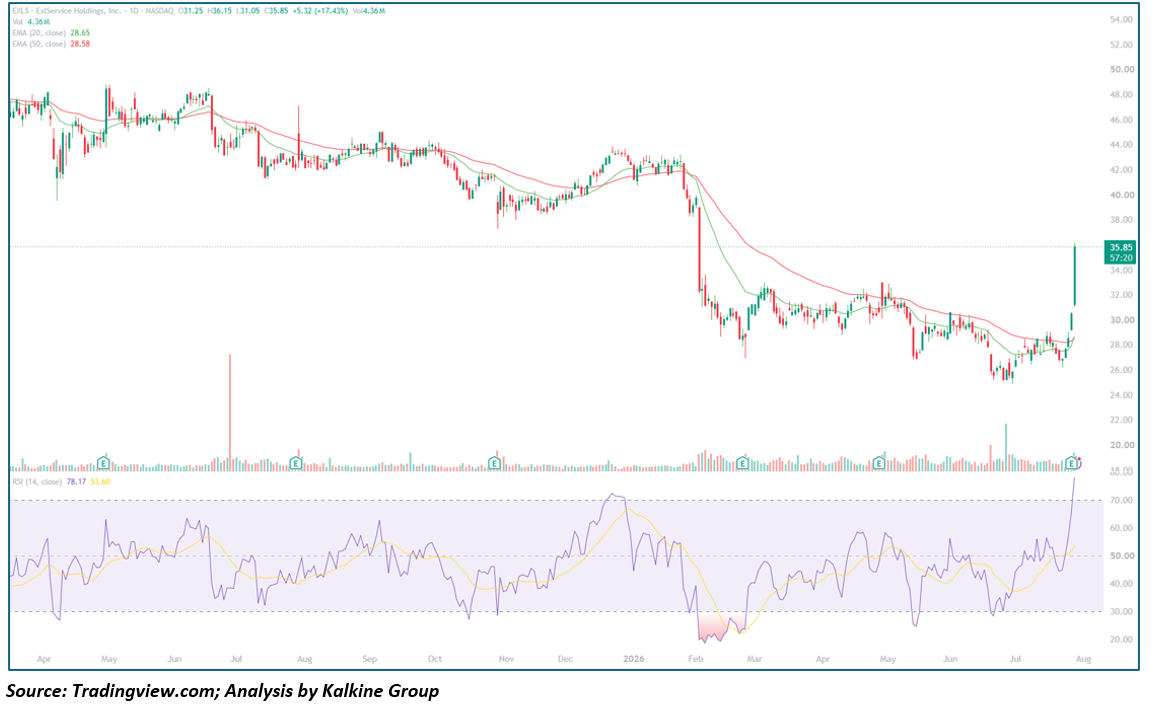
Key Technical Levels Resistance
- ~$38.00 – Late-2025 consolidation shelf
- ~$42.00 – Prior swing-high zone from late 2025
Support
- $28.65 – 20-day EMA
- $28.58 – 50-day EMA
- ~$31.00 – Today's intraday low
Outlook EXLS's breakout is one of the sharpest reversals in the group, reclaiming a multi-month base in a single session. A close that holds above $32-33 on any pullback would confirm the move; a fast fade back into the prior range would suggest the gap needs more time to be digested.
Cognizant Technology Solutions Corporation (NASDAQ: CTSH) — Strong Breakout, Sharpest RSI Move in the Group
Key Highlights
- CTSH trading at $56.13, up 11.57% ($5.82) on volume of 10.87M shares, after ranging between $51.23 and $57.06 on an open at $52.31.
- Price has broken well above both the 20-day EMA ($45.94) and the 50-day EMA ($47.54), clearing levels that had capped the stock since a sharp gap-down earlier this year.
- RSI has surged to roughly 74.82, with the signal line at 50.93 — one of the steepest single-day RSI accelerations in the group.
- CTSH declined from a late-2025 high near $85 into a May 2026 low near $38, before basing in the low-to-mid $40s and $50s ahead of today's sharp move higher.
- Today's gain is the largest single-day percentage move on the chart by a wide margin.
Trend Structure CTSH's chart shows a persistent downtrend from a late-2025 peak into a May 2026 low, followed by a choppy, multi-month basing period. Today's rally breaks cleanly above the EMA cluster that had constrained the stock during that base. 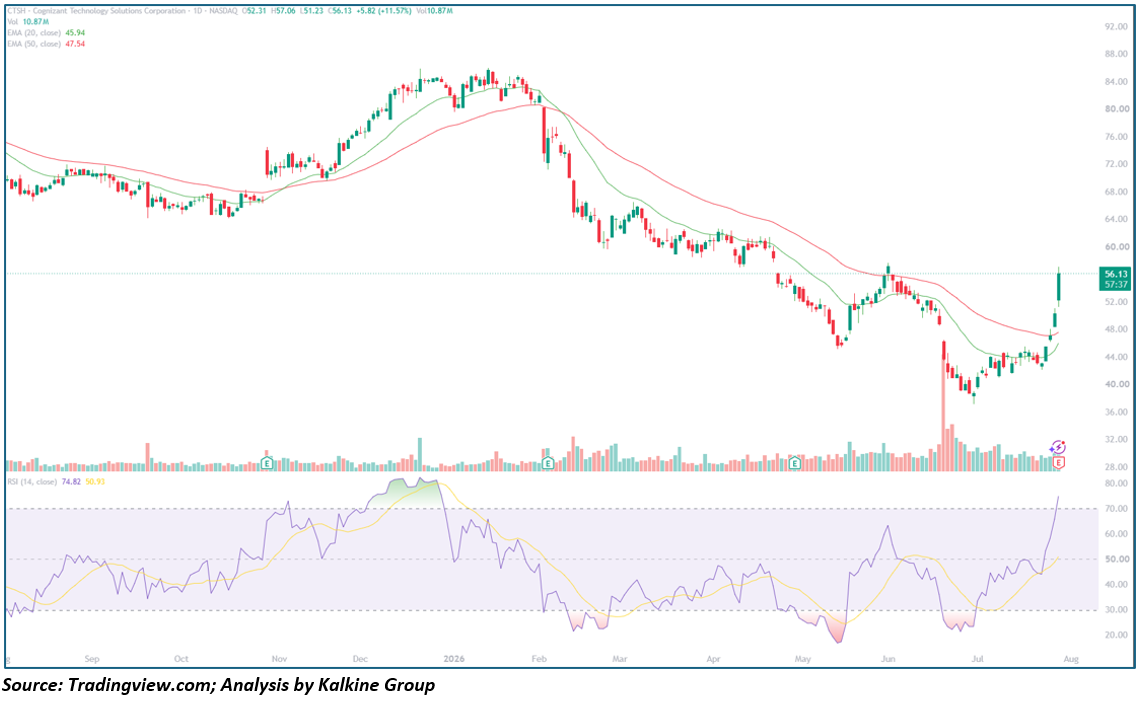
Key Technical Levels Resistance
- ~$60.00 – February 2026 consolidation zone
- ~$65.00 – Prior pullback shelf from late 2025
Support
- $47.54 – 50-day EMA
- $45.94 – 20-day EMA
- ~$44.00 – Recent base area
Outlook CTSH's breakout is a significant technical development after a long downtrend, though the sharp RSI spike suggests the move is stretched short-term. A hold above the EMA cluster on any pullback would support a continued recovery; a quick reversal back below $50 would raise questions about follow-through.
ServiceTitan, Inc. (NASDAQ: TTAN) — Solid Gain, Reclaiming Ground After a Choppy Multi-Month Base
Key Highlights
- TTAN trading at $85.03, up 8.47% ($6.64) on volume of 1.66M shares, after ranging between $77.63 and $85.58 on an open at $77.73.
- Price has moved back above both the 20-day EMA ($75.22) and the 50-day EMA ($72.21).
- RSI sits at roughly 64.83, with the signal line at 55.51 — firm bullish momentum without yet reaching extreme overbought levels.
- TTAN fell from a December 2025 high near $120 into a February 2026 low near $60, then spent months chopping in a wide range before today's move pushes toward the top of that range.
- Today's gain is among the strongest single-day moves since the stock's initial decline began.
Trend Structure TTAN's chart shows a steep decline from a December 2025 peak into a February 2026 low, followed by an extended, choppy recovery attempt through the spring and early summer. Today's rally clears both EMAs and pushes the stock back toward its recent range highs. 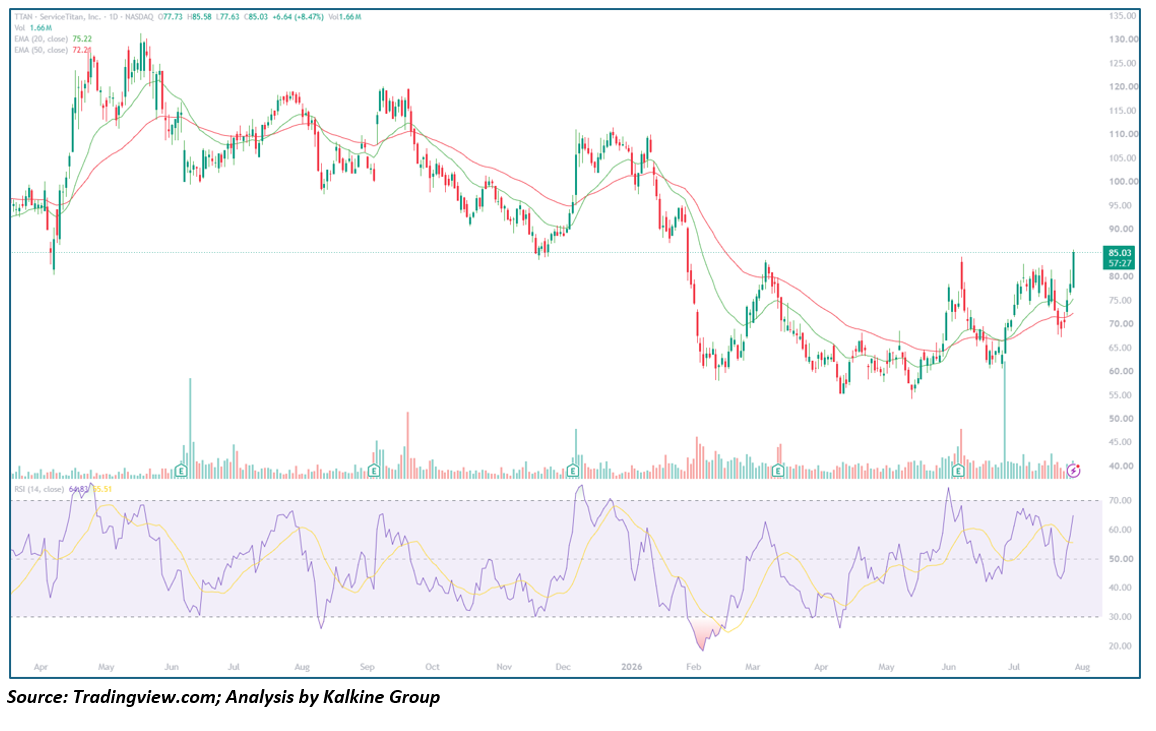
Key Technical Levels Resistance
- ~$90.00 – June 2026 swing high
- ~$100.00 – Psychological round-number level
Support
- $75.22 – 20-day EMA
- $72.21 – 50-day EMA
- ~$65.00 – Recent base area
Outlook TTAN's bounce is constructive and keeps the stock working within its recovery structure. A close above $90 would put the recent swing highs back in reach; a stall near current levels would keep the stock rangebound for longer.
Clear Secure, Inc. (NYSE: YOU) — Strong Gain, Breaking to Fresh Highs for the Move
Key Highlights
- YOU trading at $59.61, up 10.72% ($5.77) on volume of 1.39M shares, after ranging between $53.71 and $59.95 on an open at $53.97.
- Price has broken decisively above both the 20-day EMA ($54.71) and the 50-day EMA ($54.30), pushing to its best levels since earlier this year.
- RSI has climbed to roughly 63.21, with the signal line at 49.86 — a clean crossover back above the midpoint.
- YOU rallied steadily from roughly $24 in April 2025 to a high near $65 in May 2026, corrected into the high-$40s to low-$50s through the summer, and today's surge pushes back toward that prior high.
- Today's move is one of the largest single-day gains on the chart.
Trend Structure YOU's chart shows a long, steady uptrend from a spring-2025 base into a May 2026 peak, followed by a multi-month consolidation in the high-$40s to mid-$50s. Today's breakout clears the EMA cluster and approaches the prior cycle high. 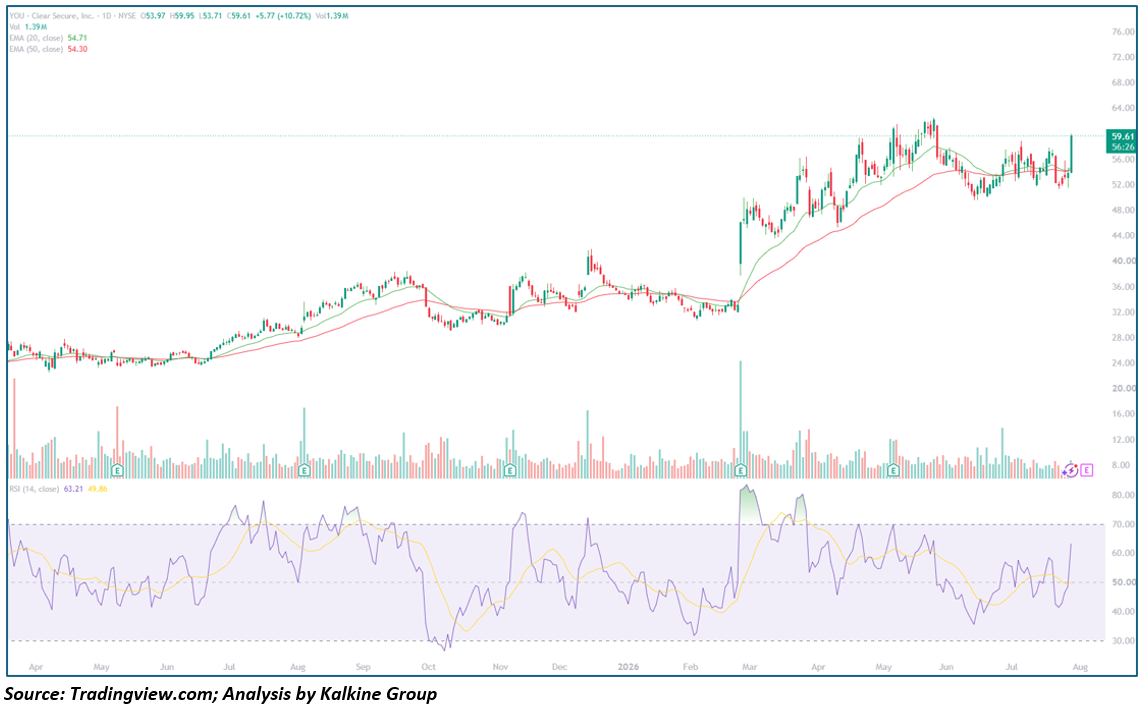
Key Technical Levels Resistance
- ~$62.00 – Recent swing-high area
- ~$65.00 – May 2026 cycle high
Support
- $54.71 – 20-day EMA
- $54.30 – 50-day EMA
- ~$48.00 – Summer 2026 consolidation low
Outlook YOU's breakout keeps its long-term uptrend intact and puts the May highs within reach. A close above $62 would open a path toward retesting $65; a fade back into the EMA cluster would suggest more consolidation is needed first.
EPAM Systems, Inc. (NYSE: EPAM) — Sharp Reversal Off Multi-Year Lows
Key Highlights
- EPAM trading at $107.87, up 7.44% ($7.46) on volume of 1.3M shares, after ranging between $100.21 and $109.01 on an open at $100.27.
- Price has jumped well above both the 20-day EMA ($90.95) and the 50-day EMA ($94.68), a decisive break after months of trading beneath both lines.
- RSI has surged to roughly 72.82, with the signal line at 52.16 — a steep move into overbought territory after a prolonged downtrend.
- EPAM fell from a December 2025 high above $220 into a multi-month slide that bottomed near $80 in May 2026, before basing in the $80s-to-$90s ahead of today's sharp rally.
- Today's gain is the largest single-day move on the chart by a significant margin.
Trend Structure EPAM's chart shows a severe, sustained decline from a December 2025 peak into a May 2026 low, followed by a choppy basing period. Today's rally breaks decisively above the EMA cluster that had capped the stock throughout that base. 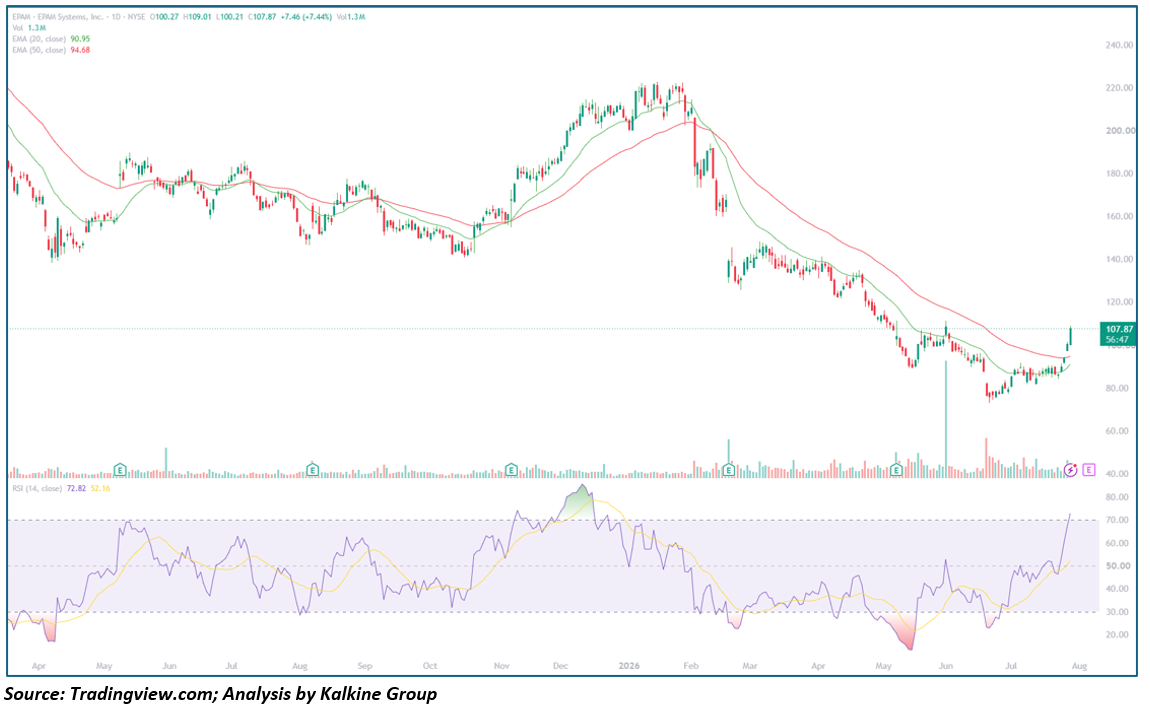
Key Technical Levels Resistance
- ~$120.00 – Early-2026 pullback shelf
- ~$140.00 – Prior consolidation zone from late 2025
Support
- $94.68 – 50-day EMA
- $90.95 – 20-day EMA
- ~$80.00 – May 2026 low
Outlook EPAM's reversal is a meaningful technical development after a brutal downtrend, though the sharp RSI spike suggests some near-term digestion is likely. Holding above the EMA cluster on any pullback would support the case for a durable bottom; a quick fade back below $95 would keep the longer-term downtrend in question.
ServiceNow, Inc. (NYSE: NOW) — Firm Gain, Pushing Toward Recent Swing Highs
Key Highlights
- NOW trading at $116.55, up 5.36% ($5.93) on volume of 27.62M shares, after ranging between $109.50 and $118.36 on an open at $110.42.
- Price has moved above both the 20-day EMA ($104.48) and the 50-day EMA ($103.85), extending its lead above the EMA cluster.
- RSI sits at roughly 62.52, with the signal line at 50.34 — solid bullish momentum without yet reaching overbought extremes.
- NOW declined from an August 2025 high near $210 into an April 2026 low near $90, then staged a choppy recovery that spiked to a June 2026 high near $130 before pulling back; today's gain reverses part of that recent pullback.
- Today's move helps stabilize the stock after several weeks of consolidation below the June peak.
Trend Structure NOW's chart shows a long, steep decline from an August 2025 high into an April 2026 low, followed by a recovery attempt that produced a sharp spike to a June 2026 high before fading. Today's rally reclaims both EMAs and pushes back toward the upper end of the recent range. 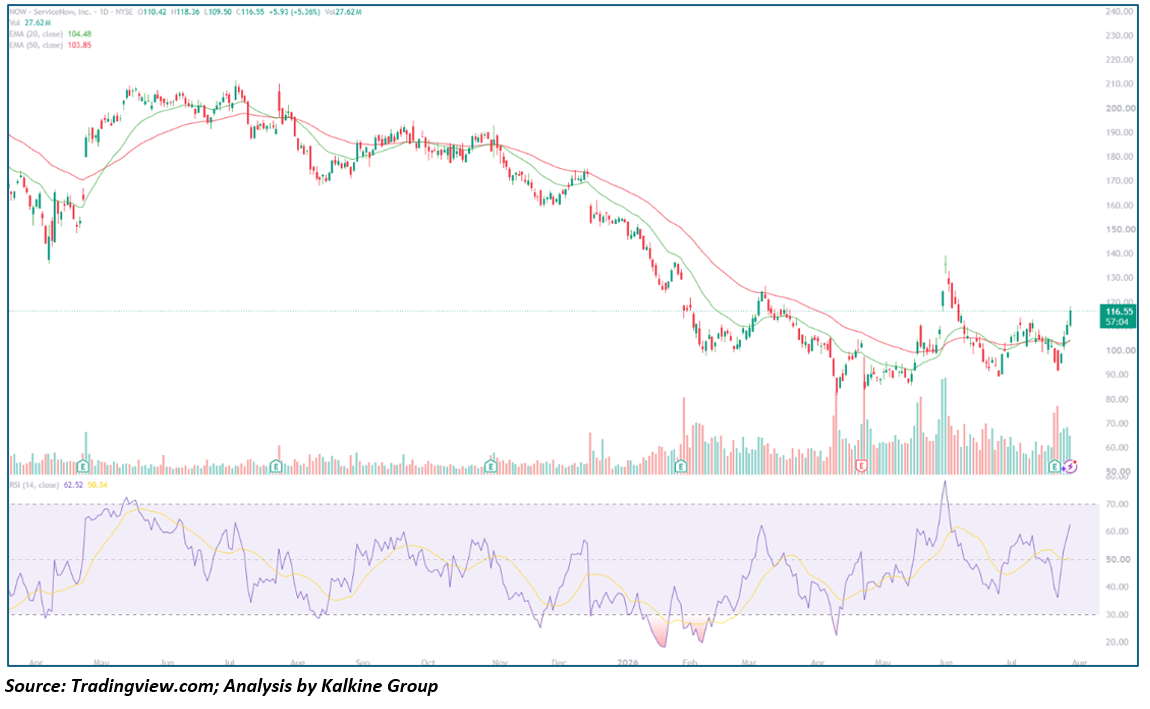
Key Technical Levels Resistance
- ~$130.00 – June 2026 cycle high
- ~$140.00 – Psychological round-number level
Support
- $104.48 – 20-day EMA
- $103.85 – 50-day EMA
- ~$90.00 – April 2026 low
Outlook NOW's bounce keeps the recovery attempt alive after a period of consolidation. A close back above $130 would put the June highs back in play; a slide back below the EMA cluster would suggest the stock needs more time to base.
Ambarella, Inc. (NASDAQ: AMBA) — Solid Bounce, Reclaiming Both EMAs After a Pullback From July Highs
Key Highlights
- AMBA trading at $74.61, up 8.18% ($5.64) on volume of 1.77M shares, after ranging between $65.66 and $75.62 on an open at $67.82.
- Price has moved back above both the 20-day EMA ($70.51) and the 50-day EMA ($70.72), which had briefly crossed below price during the recent pullback.
- RSI has climbed to roughly 54.35, with the signal line at 47.82 — a modest but clear crossover back above the midpoint.
- AMBA has traded in a wide, choppy range over the past year, swinging between roughly $52 and $96, with a sharp pullback from a July 2026 high near $92 into a low near $63 ahead of today's bounce.
- Today's gain helps stabilize the stock after a volatile few weeks following its July peak.
Trend Structure AMBA's chart shows a persistent, wide trading range through the past year, with repeated sharp swings on elevated volume. Today's rally reclaims both EMAs after a recent slide from the July 2026 high. 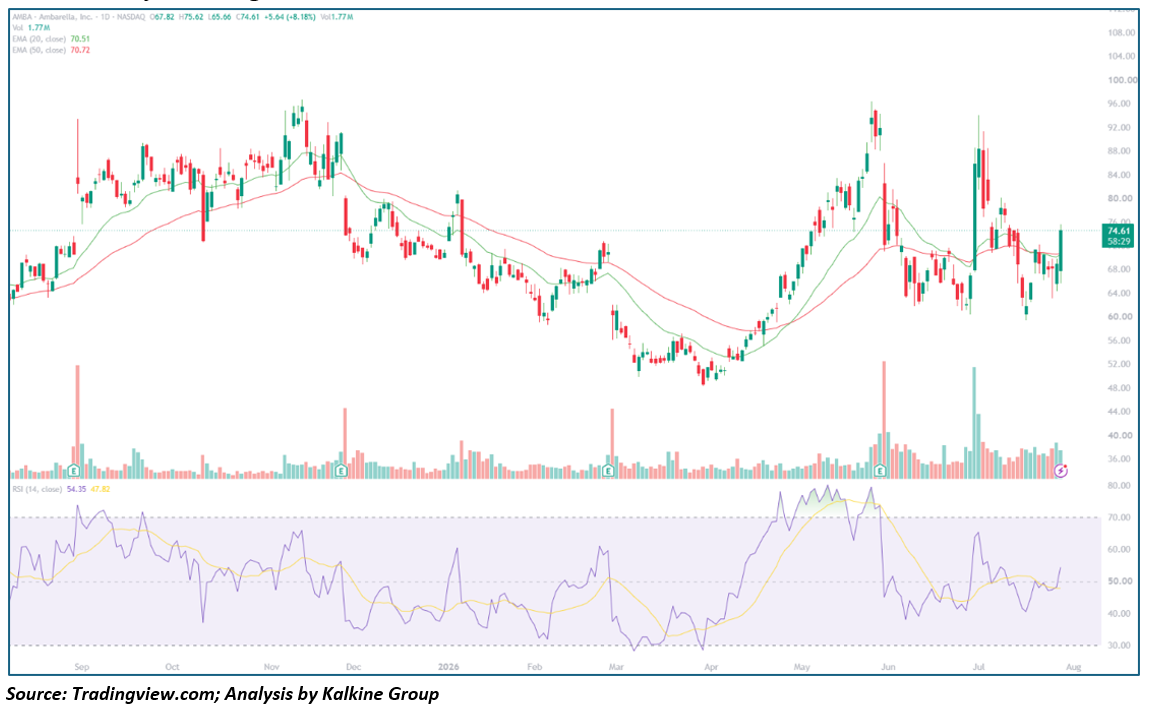
Key Technical Levels Resistance
- ~$80.00 – Recent consolidation zone
- ~$92.00 – July 2026 cycle high
Support
- $70.51 – 20-day EMA
- $70.72 – 50-day EMA
- ~$63.00 – Late-July pullback low
Outlook AMBA's bounce is constructive but remains contained within its long-running, volatile range. A push through $80 would put the stock on track to retest the July highs; a stall near current levels would keep AMBA rangebound for now.
Navitas Semiconductor Corporation (NASDAQ: NVTS) — Modest Bounce, Still Well Below Both EMAs
Key Highlights
- NVTS trading at $10.49, up 4.80% ($0.48) on volume of 16.67M shares, after ranging between $9.85 and $11.04 on an open at $9.86.
- Price remains well below both the 20-day EMA ($13.25) and the 50-day EMA ($15.93), despite today's bounce.
- RSI sits at roughly 33.83, with the signal line at 33.80 — still hovering near oversold territory after a steep, prolonged decline.
- NVTS spiked from a base near $6 in April 2026 to a high near $33 in June 2026, then corrected sharply into today's low near $10, erasing nearly all of that rally.
- Today's gain offers only a modest reprieve after a severe multi-week slide.
Trend Structure NVTS's chart shows an explosive spike into a June 2026 peak followed by a steep, sustained decline that has retraced almost the entire advance. Today's small bounce leaves the stock deep below both EMAs. 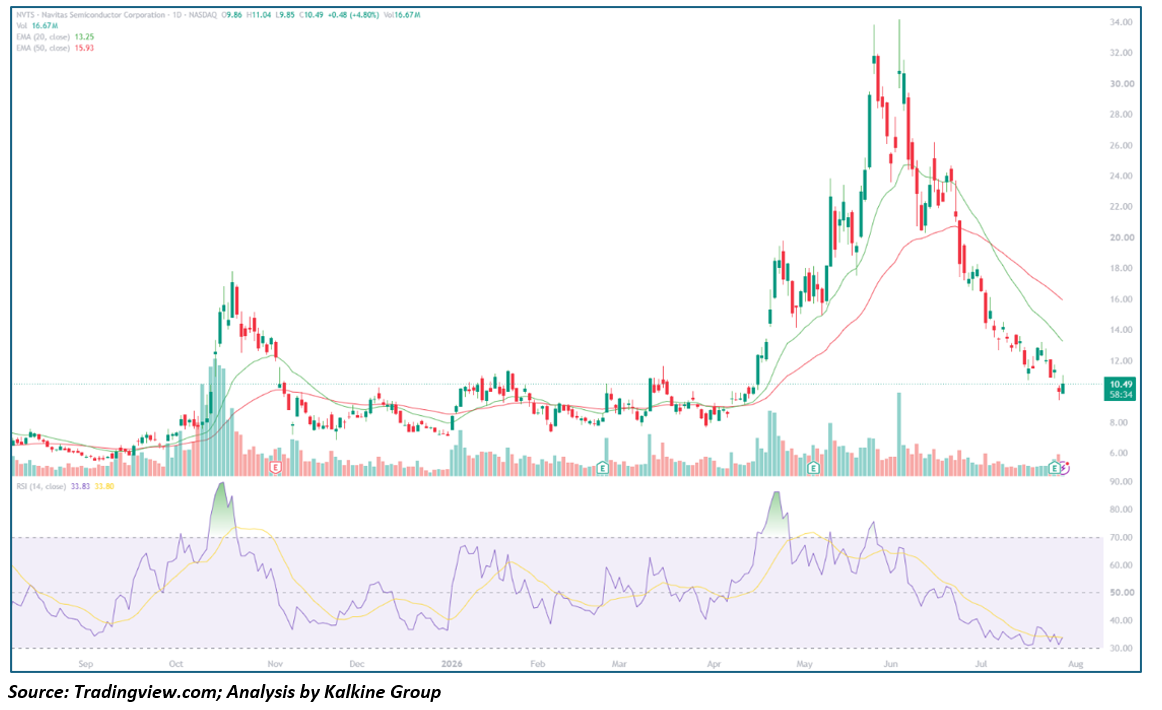
Key Technical Levels Resistance
- $13.25 – 20-day EMA
- $15.93 – 50-day EMA
Support
- ~$10.00 – Psychological level near today's range
- ~$8.00 – Prior base area from earlier in the year
Outlook NVTS's bounce is a modest positive after a punishing decline, but the stock remains deep in a downtrend with both EMAs well overhead. A reclaim of the 20-day EMA would be the first sign of stabilization; continued weakness below $10 would point to further downside risk.
Sandisk Corporation (NASDAQ: SNDK) — Slight Gain, Still Deep Below Both EMAs After a Sharp Correction
Key Highlights
- SNDK trading at $1,113.33, up 1.57% ($17.23) on volume of 17.39M shares, after ranging between $998.19 and $1,121.67 on an open at $1,119.33.
- Price remains well below both the 20-day EMA ($1,530.04) and the 50-day EMA ($1,572.50), despite today's modest bounce off intraday lows.
- RSI sits at roughly 35.02, with the signal line at 42.75 — still near oversold levels after a steep, multi-week slide.
- SNDK rallied from roughly $50 in mid-2025 to a peak near $2,400 in June 2026, then corrected sharply into today's session, which briefly dipped below $1,000 intraday before recovering.
- Today's gain is modest, but the stock's ability to hold above the $1,000 level intraday is notable after such a steep decline.
Trend Structure SNDK's chart shows an extraordinary multi-month advance into a June 2026 peak, followed by a severe correction that has erased a large portion of those gains. Today's session tested the psychological $1,000 level before stabilizing. 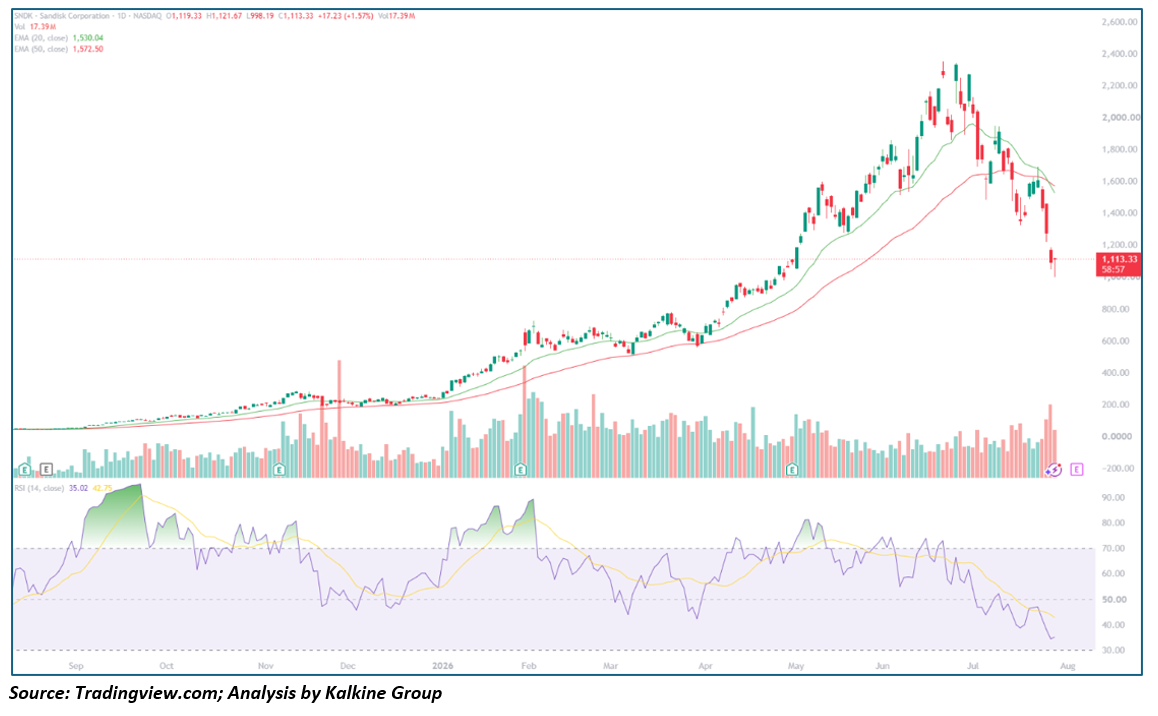
Key Technical Levels Resistance
- $1,530.04 – 20-day EMA
- $1,572.50 – 50-day EMA
Support
- ~$1,000.00 – Psychological round-number level
- ~$998.00 – Today's intraday low
Outlook SNDK's bounce is tentative and the stock remains firmly in a downtrend with both EMAs far overhead. Holding above $1,000 would be a near-term positive; a break below that level would open the door to further downside.
This analysis is based on daily chart technical indicators (20/50-day EMAs, RSI-14) and price action as of July 28, 2026, and is intended for informational purposes only — not investment advice.


 Nov 13, 2026





 Please wait processing your request...