
 CA
 NZ
 UK
 AU
 IND

 US

 Share
 X (Formerly Twitter)
 Whatsapp
 Facebook
 LinkedIn
 Telegram
 Email This Article
 Copy Link
 Summarize with AI
 Chat GPT
 Perplexity

Today's session delivered a broad, high-conviction rally across the semiconductor and chip-equipment complex. Teradyne (NASDAQ: TER) and FormFactor (NASDAQ: FORM) both surged more than 11%, Advanced Micro Devices (NASDAQ: AMD) added nearly 9% on massive volume, and Lattice Semiconductor (NASDAQ: LSCC) and Tower Semiconductor (NASDAQ: TSEM) each climbed between roughly 5% and 8%. Across the group, price reclaimed both the 20-day and 50-day EMAs, and RSI readings pushed back above the midpoint after weeks of consolidation or outright corrections from summer highs.
Advanced Micro Devices, Inc. (NASDAQ: AMD) — Powerful Reversal on Heavy Volume, Reclaiming Both EMAs
Key Highlights
- AMD trading at $527.57, up 8.86% ($42.93) on volume of 26.48M shares, after ranging between $502.20 and $530.13 on an open at $504.00.
- Price has moved back above both the 20-day EMA ($504.54) and the 50-day EMA ($487.83), which had briefly capped the stock during its recent pullback.
- RSI has climbed to roughly 53.62, with the signal line at 47.67 — a clean crossover back above the midpoint after cooling off from deeply overbought levels earlier in the summer.
- AMD spent late 2025 into early 2026 rangebound in the low-$200s before an explosive rally through the spring carried it to a July 2026 high near $570; the stock then corrected sharply into the $430s before today's sharp bounce.
- Today's gain, on volume well above the stock's recent average, is among the largest single-day moves since the initial spring breakout.
Trend Structure AMD's chart shows a long, choppy base through the back half of 2025, followed by an explosive uptrend from around $200 in April 2026 to a peak near $570 in July. The subsequent pullback tested the low-$430s before today's session reclaimed both EMAs on a surge of buying interest. 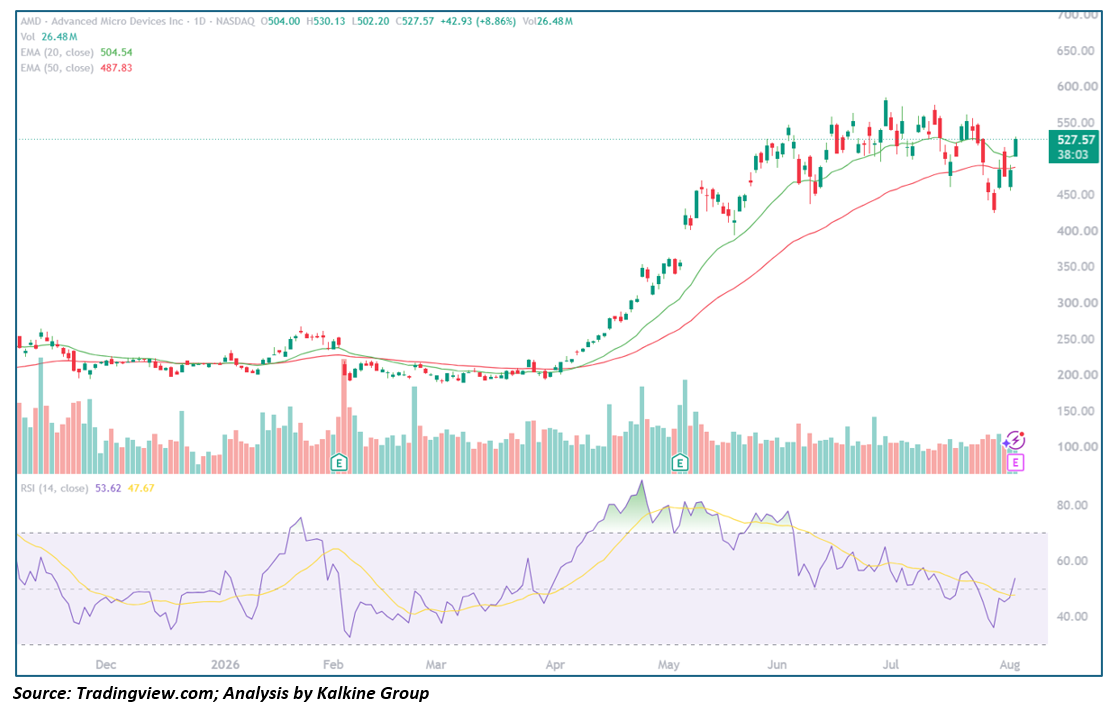
Key Technical Levels
Resistance
- ~$550.00 – Recent swing-high area from late July
- ~$570.00 – July 2026 cycle high
Support
- $504.54 – 20-day EMA
- $487.83 – 50-day EMA
- ~$430.00 – Recent pullback low
Outlook AMD's reversal is constructive and keeps the broader spring-to-summer uptrend intact after a sharp but orderly correction. A close back above $550 would put the July highs in play; a fade back below the EMA cluster would suggest the stock needs more time to consolidate before its next leg higher.
Teradyne, Inc. (NASDAQ: TER) — Sharp Reversal, Breaking Back Above Both EMAs After a Steep Correction
Key Highlights
- TER trading at $406.66, up 11.17% ($40.86) on volume of 2.27M shares, after ranging between $382.87 and $409.72 on an open at $388.61.
- Price has surged back above both the 20-day EMA ($363.18) and the 50-day EMA ($368.18), which had been capping the stock since a sharp slide off its July peak.
- RSI has jumped to roughly 58.60, with the signal line at 46.48 — a decisive crossover back above the midpoint.
- TER climbed steadily from roughly $150 in late 2025 to a July 2026 high near $480, then corrected sharply into the $280s-to-$320s before today's powerful reversal.
- Today's gain is the largest single-day move on the chart since the stock's initial breakout phase.
Trend Structure TER's chart shows a long, persistent uptrend through late 2025 and into mid-2026, cresting near $480 in July before a sharp, high-volume correction. Today's session breaks decisively back above both EMAs after several weeks of choppy consolidation near the lows. 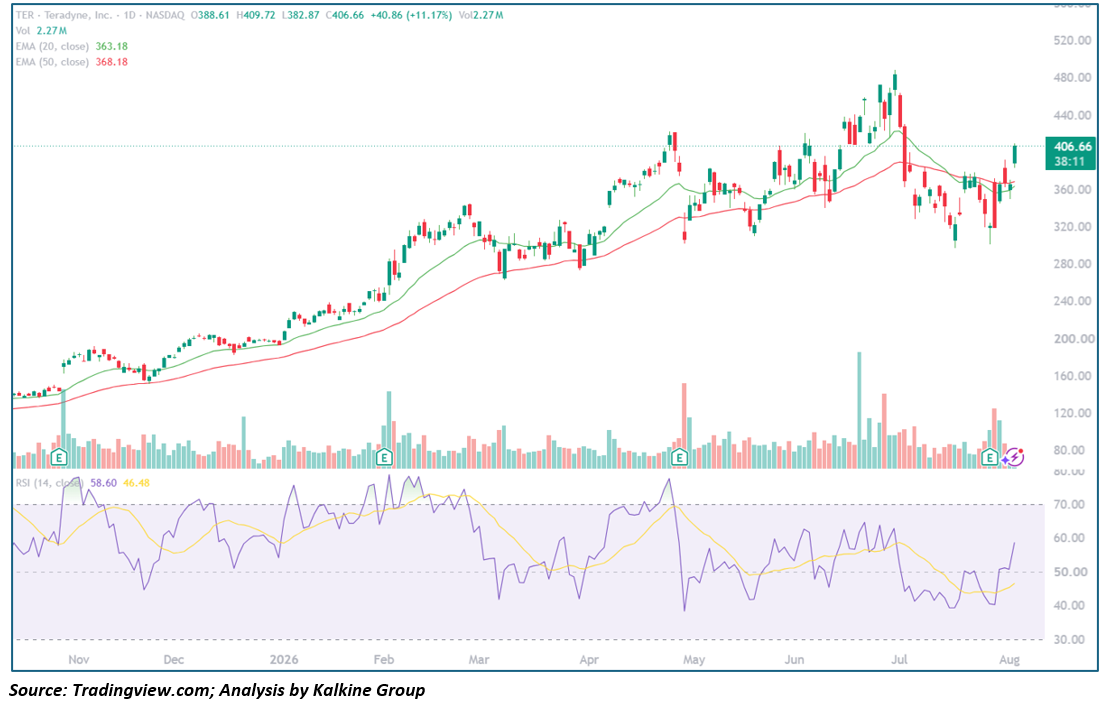
Key Technical Levels
Resistance
- ~$440.00 – June/July 2026 consolidation shelf
- ~$480.00 – July 2026 cycle high
Support
- $368.18 – 50-day EMA
- $363.18 – 20-day EMA
- ~$320.00 – Recent pullback low
Outlook TER's breakout is one of the sharpest reversals in the group, reclaiming a multi-week base in a single session. A hold above $380-390 on any retest would confirm the move has staying power; a fast fade back into the prior range would suggest the gap needs more time to digest.
Tower Semiconductor Ltd. (NASDAQ: TSEM) — Solid Bounce, Reclaiming the EMA Cluster After a Choppy Pullback
Key Highlights
- TSEM trading at $246.67, up 5.27% ($12.35) on volume of 5.23M shares, after ranging between $206.40 and $250.03 on an open at $225.44.
- Price has moved back above both the 20-day EMA ($231.94) and the 50-day EMA ($235.71) after dipping below both during the recent slide.
- RSI has climbed to roughly 53.5, with the signal line at 46.82 — a clean move back above the midpoint.
- TSEM rallied from roughly $100 in late 2025 to a June 2026 high near $325, then spent the following weeks in a wide, choppy range between roughly $200 and $280 before today's bounce.
- Today's session posted the widest intraday range in weeks, with the stock recovering sharply off a fresh low near $206.
Trend Structure TSEM's chart shows a strong uptrend from late 2025 into a June 2026 peak, followed by a volatile, range-bound period as the stock digested those gains. Today's rally reclaims the EMA cluster after briefly undercutting it. 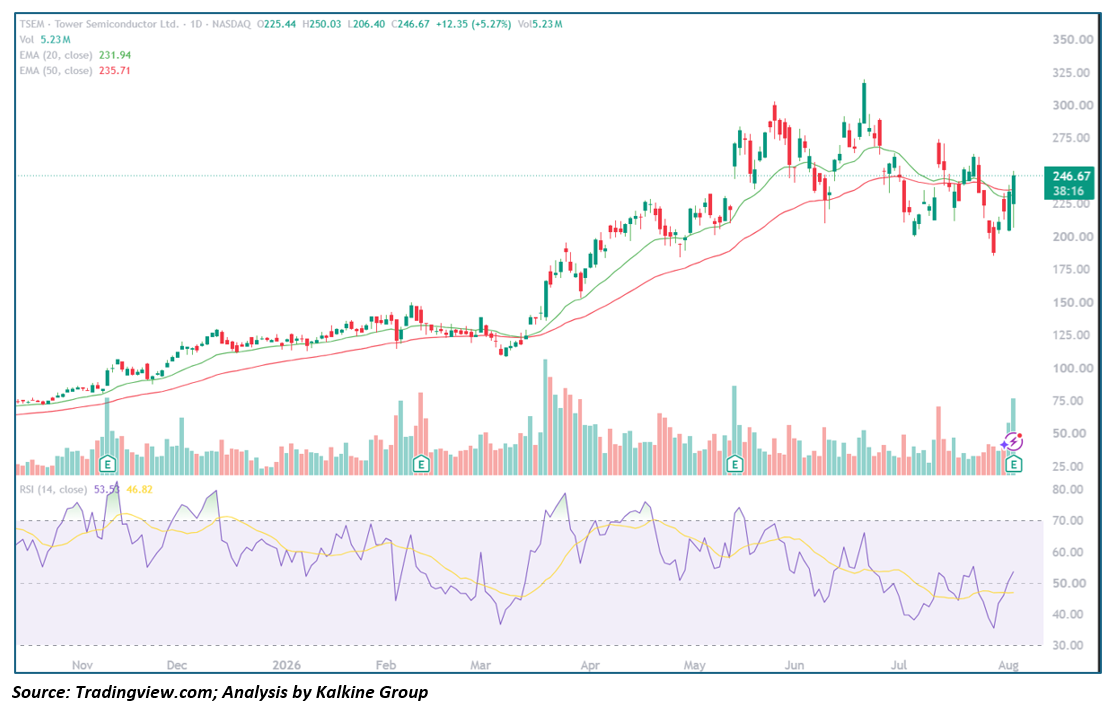
Key Technical Levels
Resistance
- ~$275.00 – Recent range-high area from July
- ~$325.00 – June 2026 cycle high
Support
- $235.71 – 50-day EMA
- $231.94 – 20-day EMA
- ~$206.00 – Today's intraday low
Outlook TSEM's bounce is a constructive sign after a volatile stretch, though the wide intraday range (a dip to $206 before recovering to $246.67) suggests the stock remains choppy. A close that holds above the EMA cluster would support a continuation higher; a slide back below $230 would keep TSEM rangebound.
FormFactor, Inc. (NASDAQ: FORM) — Explosive Reversal Off Multi-Month Lows
Key Highlights
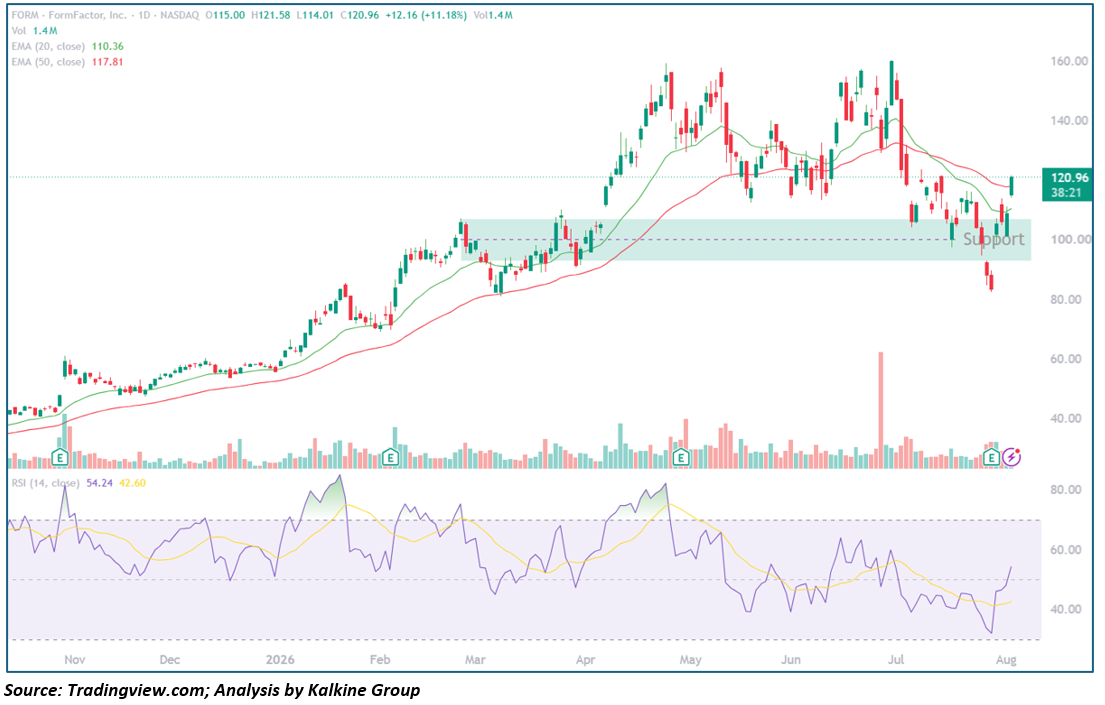
- FORM trading at $120.96, up 11.18% ($12.16) on volume of 1.4M shares, after ranging between $114.01 and $121.58 on an open at $115.00.
- Price has jumped above the 20-day EMA ($110.36) and is closing in on the 50-day EMA ($117.81), both of which had capped the stock during its recent slide.
- RSI has surged to roughly 54.24, with the signal line at 42.60 — a sharp acceleration off oversold territory.
- FORM rallied from the low-$40s in late 2025 to an April 2026 high near $155, based in a well-defined $100-$110 support zone through the spring, then spiked to a June high near $150 before a severe slide into an $85 low. Today's rally reverses a meaningful chunk of that decline.
- Today's gain is the largest single-day move on the chart since the stock's initial 2025-2026 uptrend.
Trend Structure FORM's chart shows a strong uptrend into an April 2026 peak, a multi-month base in the $100-$110 zone, a secondary spike to a June high, and then a sharp breakdown to an $85 low. Today's session marks a forceful bounce off that low, clearing the 20-day EMA and approaching the 50-day EMA.
Key Technical Levels
Resistance
- $117.81 – 50-day EMA
- ~$140.00 – June 2026 consolidation shelf
Support
- $110.36 – 20-day EMA
- ~$100.00 – Prior multi-month support zone
- ~$85.00 – Recent low
Outlook FORM's reversal is a significant technical development after a punishing decline, though the stock still needs to reclaim the 50-day EMA to fully repair the chart. Holding above $110 on any pullback would support the case for a durable low; a quick fade back toward $100 would keep the stock's near-term trend in question.
Lattice Semiconductor Corporation (NASDAQ: LSCC) — Firm Bounce, Reclaiming Both EMAs After a Multi-Week Slide
Key Highlights
- LSCC trading at $137.29, up 7.95% ($10.11) on volume of 2.14M shares, after ranging between $131.49 and $138.97 on an open at $131.52.
- Price has moved back above both the 20-day EMA ($129.99) and the 50-day EMA ($131.52), which had briefly crossed above price during the recent pullback.
- RSI has climbed to roughly 54.51, with the signal line at 44.52 — a clear crossover back above the midpoint.
- LSCC rallied from roughly $70 in late 2025 to a June 2026 high near $155, then corrected into a low near $115 before today's bounce.
- Today's gain is among the strongest single-day moves since the stock's spring breakout phase.
Trend Structure LSCC's chart shows a steady uptrend from late 2025 into a June 2026 peak, followed by a choppy, multi-week decline that tested the $115 area. Today's rally reclaims both EMAs after several sessions spent below the cluster. 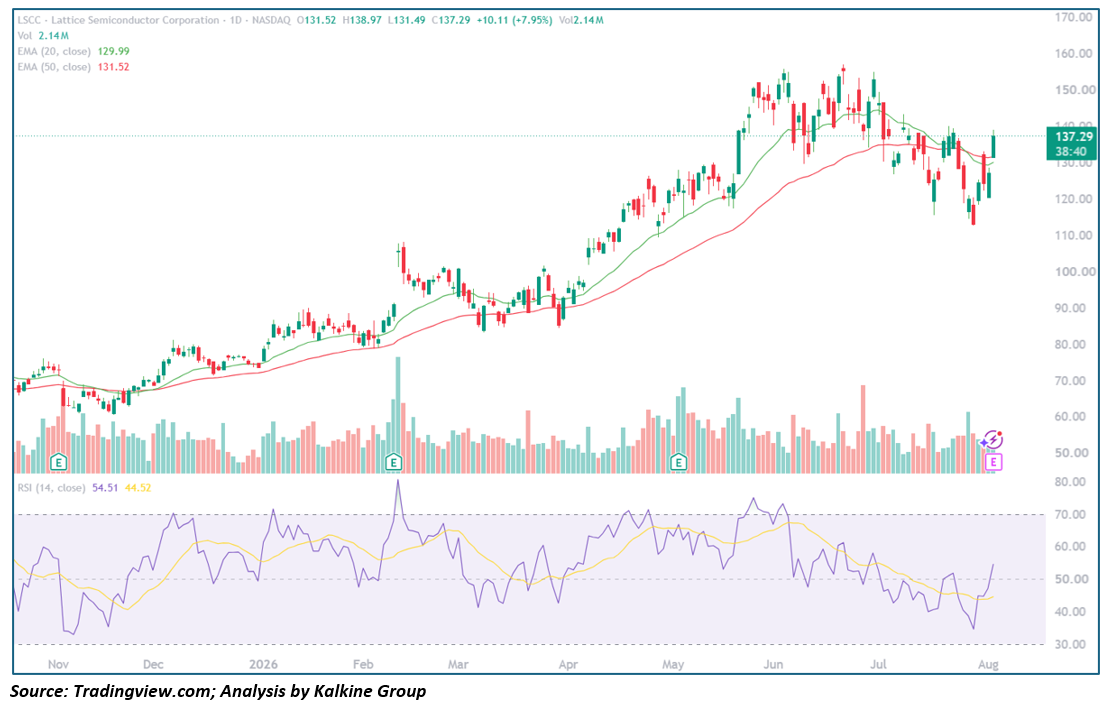
Key Technical Levels
Resistance
- ~$140.00 – Recent consolidation shelf
- ~$155.00 – June 2026 cycle high
Support
- $131.52 – 50-day EMA
- $129.99 – 20-day EMA
- ~$115.00 – Recent pullback low
Outlook LSCC's bounce is constructive and keeps the broader 2026 uptrend intact after a corrective phase. A close above $140 would put the June highs back in reach; a stall near current levels would keep the stock consolidating within its recent range.
This analysis is based on daily chart technical indicators (20/50-day EMAs, RSI-14) and price action as of August 4, 2026, and is intended for informational purposes only — not investment advice.


 Nov 13, 2026





 Please wait processing your request...