
 CA
 NZ
 UK
 AU
 IND

 US

 Share
 X (Formerly Twitter)
 Whatsapp
 Facebook
 LinkedIn
 Telegram
 Email This Article
 Copy Link
 Summarize with AI
 Chat GPT
 Perplexity

Today's session produced a synchronized rally across a group of quantum-computing and AI/robotics names, with gains ranging from roughly 3.75% to over 7%. The move comes after a sustained multi-month slide from earlier 2026 highs that had pushed all five names well below their 20-day and 50-day EMAs, with several posting fresh lows just ahead of today's bounce. Rigetti Computing (NASDAQ: RGTI) posted the largest percentage gain of the group, while D-Wave Quantum (NYSE: QBTS), BigBear.ai (NYSE: BBAI), Quantum Computing Inc. (NASDAQ: QUBT), and Richtech Robotics (NASDAQ: RR) all rallied but remain well beneath their EMA clusters, leaving the group firmly in "oversold bounce within a downtrend" territory.
Rigetti Computing, Inc. (NASDAQ: RGTI) — Largest Percentage Gain of the Group, Bouncing Off a Fresh Multi-Month Low
Key Highlights
- RGTI trading at $15.31, up 7.40% ($1.05) on volume of 14.68M shares, after ranging between $14.68 and $15.40.
- Price remains well below both the 20-day EMA ($16.84) and the 50-day EMA ($18.35).
- RSI has risen to roughly 39.32, with the signal line at 37.1, a one-day pop off a multi-week decline.
- RGTI rallied from a 2025 base near $2 to an October 2025 high near $56, then reversed into a sustained decline that reached a fresh multi-month low near $14.68 before today's bounce.
- Today's gain is the strongest single-day advance since a brief June 2026 spike, coming directly off a new low.
Trend Structure RGTI's chart shows an extraordinary late-2025 spike into an October 2025 peak near $56, followed by a long, grinding multi-month decline that has erased the overwhelming majority of that advance, punctuated only by a brief June 2026 bounce, with today's rally reversing off a fresh multi-month low. 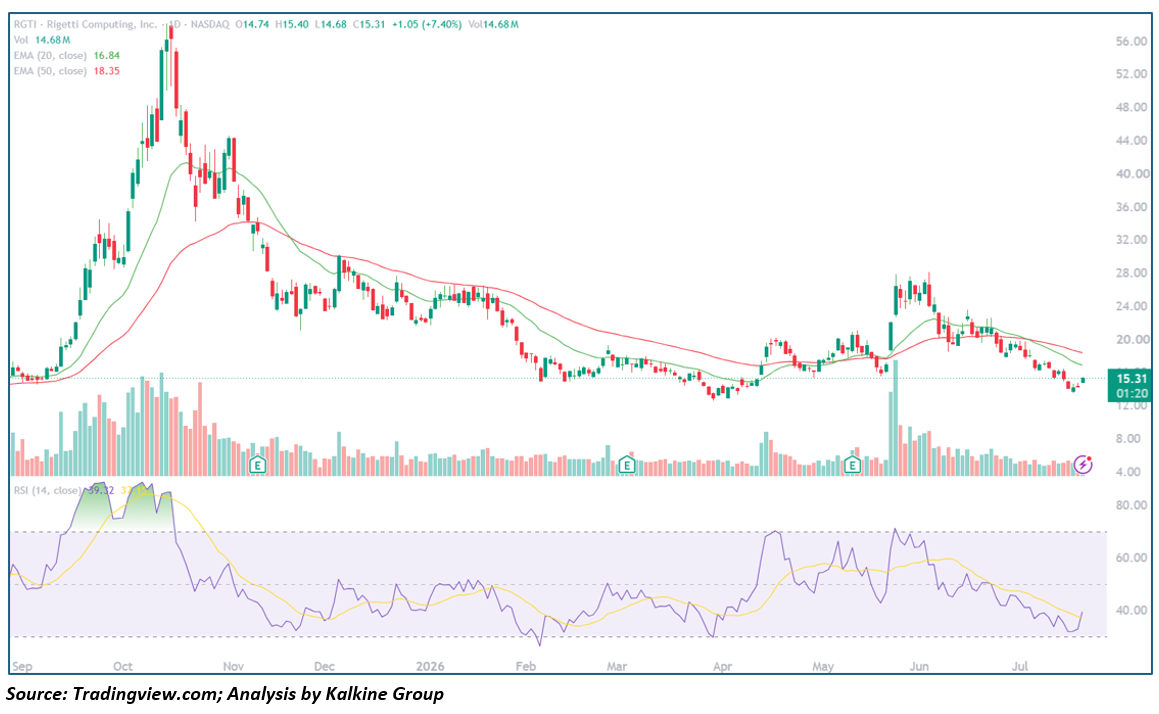
Key Technical Levels Resistance
- $16.84 – 20-day EMA
- $18.35 – 50-day EMA
- ~$28.00 – June 2026 bounce high Support
- ~$14.68 – Today's low / fresh multi-month low
- ~$14.00 – February 2026 consolidation zone
Outlook RGTI's bounce off a fresh multi-month low is a constructive first step, but with price still well below both EMAs, this reads as an oversold reversal attempt rather than a confirmed trend change. A follow-through close back above the 20-day EMA near $16.84 would strengthen the case; a break of today's low would point to further downside.
D-Wave Quantum Inc. (NYSE: QBTS) — Second-Largest Gain, RSI Still Below Its Signal Line
Key Highlights
- QBTS trading at $17.86, up 6.85% ($1.14) on volume of 12.51M shares, after ranging between $17.00 and $18.02.
- Price remains well below both the 20-day EMA ($20.16) and the 50-day EMA ($21.55).
- RSI sits at roughly 37.49, with the signal line at 38.80 — RSI is still below its own signal line despite today's bounce.
- QBTS rallied from a 2025 low near $5 to an October 2025 high near $45, reversed into a decline into a December low near $18, traded in a choppy range through the winter, fell to an April 2026 low near $13, rallied to a June 2026 high near $32, and then reversed into the current decline that reached a fresh low near $17.00 before today's session.
- Today's gain is a notable bounce, though RSI has not yet confirmed a shift in momentum.
Trend Structure QBTS's chart shows an explosive late-2025 advance into an October 2025 peak, a steep initial pullback, a choppy winter range, a secondary decline into an April 2026 low, a sharp June 2026 rally, and then another retracement that today's bounce is countering. 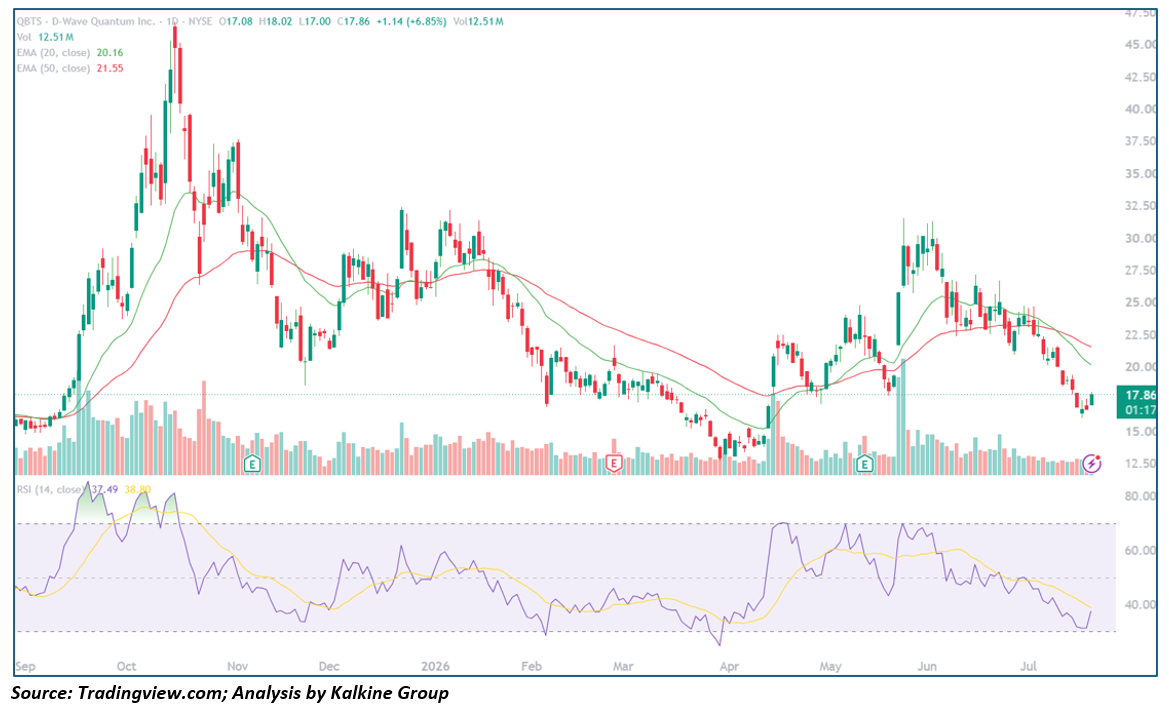
Key Technical Levels Resistance
- $20.16 – 20-day EMA
- $21.55 – 50-day EMA
- ~$32.00 – June 2026 cycle high Support
- ~$17.00 – Today's low / recent low
- ~$13.00 – April 2026 low
Outlook QBTS's bounce comes from deeply oversold territory, but with RSI still trailing its signal line and price a long way below both EMAs, this reads as an early-stage relief rally rather than a confirmed reversal. A close back above $20 would be needed to challenge that view; a retest of the $17.00 low would keep the pullback in control.
BigBear.ai Inc. (NYSE: BBAI) — Deeply Oversold Bounce, RSI Recovering From Sub-32 Reading
Key Highlights
- BBAI trading at $2.94, up 4.26% ($0.12) on volume of 14.75M shares, after ranging between $2.86 and $2.99.
- Price remains well below both the 20-day EMA ($3.30) and the 50-day EMA ($3.67).
- RSI sits at roughly 31.79, with the signal line at 32.85 — among the most oversold readings in the group, even after today's bounce.
- BBAI rallied from a 2025 low near $3 to an October 2025 high near $9, then reversed into a long, grinding decline that has brought price to a fresh multi-month low near $2.86 before today's session.
- Today's gain is a modest bounce within an otherwise persistent downtrend.
Trend Structure BBAI's chart shows a sharp late-2025 spike into an October 2025 peak, followed by a sustained, multi-month decline with only a brief secondary bounce into a June 2026 high near $5.60, and a steady slide since then into today's fresh low. 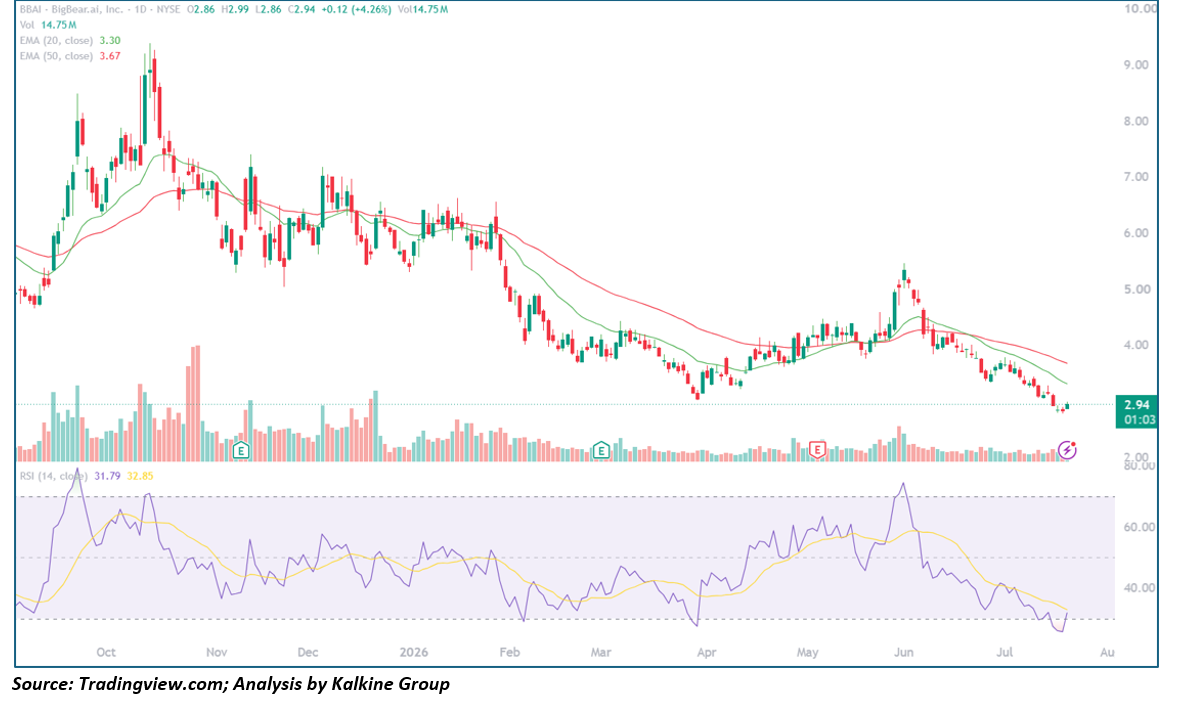
Key Technical Levels Resistance
- $3.30 – 20-day EMA
- $3.67 – 50-day EMA
- ~$5.60 – June 2026 bounce high Support
- ~$2.86 – Today's low / fresh multi-month low
- ~$3.70 – February 2026 consolidation zone
Outlook BBAI's bounce off deeply oversold levels is a modest positive, but the stock remains the most technically stretched to the downside in the group. A reclaim of the $3.30 EMA would be the first sign of stabilization; a break of today's low would risk further downside toward fresh lows.
Quantum Computing Inc. (NASDAQ: QUBT) — Smallest Gain Among the Larger-Volume Names, Still Below the EMA Cluster
Key Highlights
- QUBT trading at $8.23, up 3.85% ($0.30) on volume of 5.43M shares, after ranging between $7.95 and $8.26.
- Price remains below both the 20-day EMA ($8.76) and the 50-day EMA ($9.33).
- RSI has risen to roughly 42.61, with the signal line at 41.04, one of the more balanced readings in the group.
- QUBT rallied from a 2025 base near $10 to an October 2025 high near $24, then reversed into a decline into a February 2026 low near $6, rallied to a May 2026 high near $14, and has since pulled back to a fresh low near $7.95 before today's bounce.
- Today's gain is a modest but steady advance within a broader downtrend.
Trend Structure QUBT's chart shows a sharp late-2025 spike into an October 2025 peak, a steep decline into a February 2026 low, a spring recovery into a May 2026 high, and then a renewed retracement that today's bounce is countering. 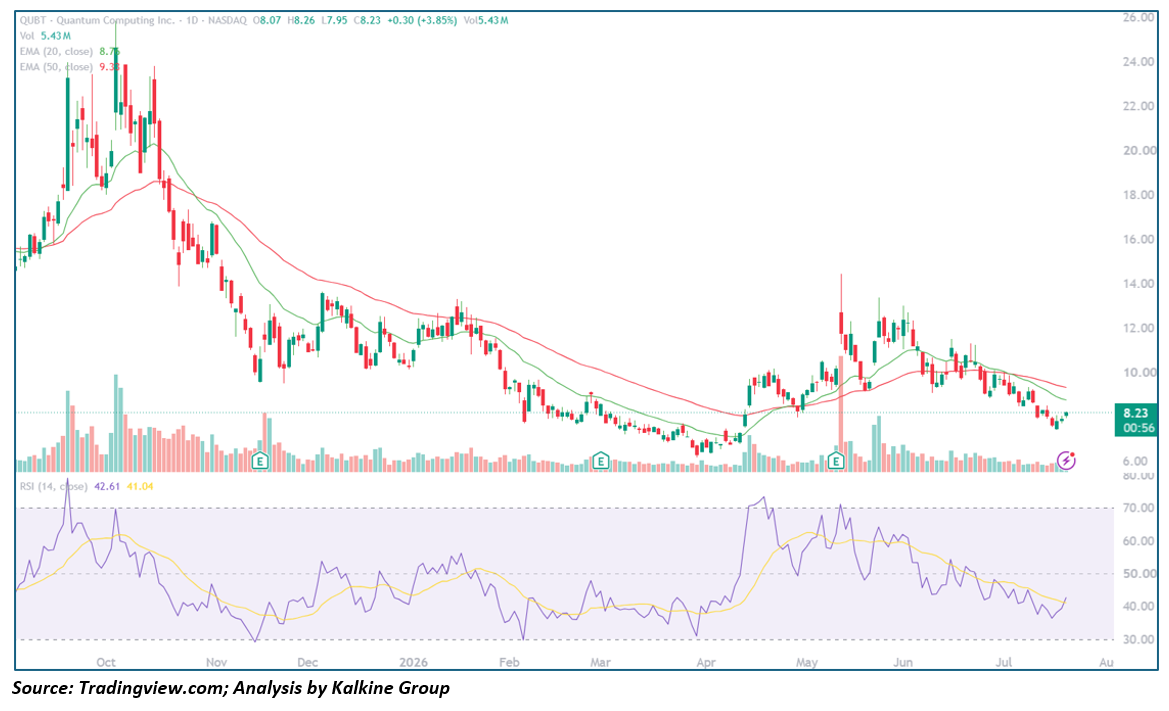
Key Technical Levels Resistance
- $8.76 – 20-day EMA
- $9.33 – 50-day EMA
- ~$14.00 – May 2026 high Support
- ~$7.95 – Today's low / recent low
- ~$6.00 – February 2026 low
Outlook QUBT's bounce is a constructive but modest step within a longer downtrend. A close back above the 20-day EMA near $8.76 would be the next confirming step; a slide back below today's low would suggest the recent low needs to be retested.
Richtech Robotics Inc. (NASDAQ: RR) — Smallest Gain of the Group, Lowest-Priced Name Still in a Well-Defined Downtrend
Key Highlights
- RR trading at $1.66, up 3.75% ($0.06) on volume of 2.55M shares, after ranging between $1.60 and $1.67.
- Price remains below both the 20-day EMA ($1.83) and the 50-day EMA ($2.12).
- RSI sits at roughly 36.02, with the signal line at 35.58, still in the lower half of its range despite today's bounce.
- RR rallied from a 2025 low near $2 to an October 2025 high near $6, then reversed into a decline into a November low near $2.70, spiked to a February 2026 high near $5.60, and has since ground steadily lower into a fresh multi-month low near $1.60 before today's session.
- Today's gain is the smallest percentage move among the names covered, consistent with a persistent, well-established downtrend.
Trend Structure RR's chart shows a sharp late-2025 spike, a steep pullback, a secondary February 2026 spike to a lower high, and then a long, steady decline over the following months that today's modest bounce is only partially offsetting. 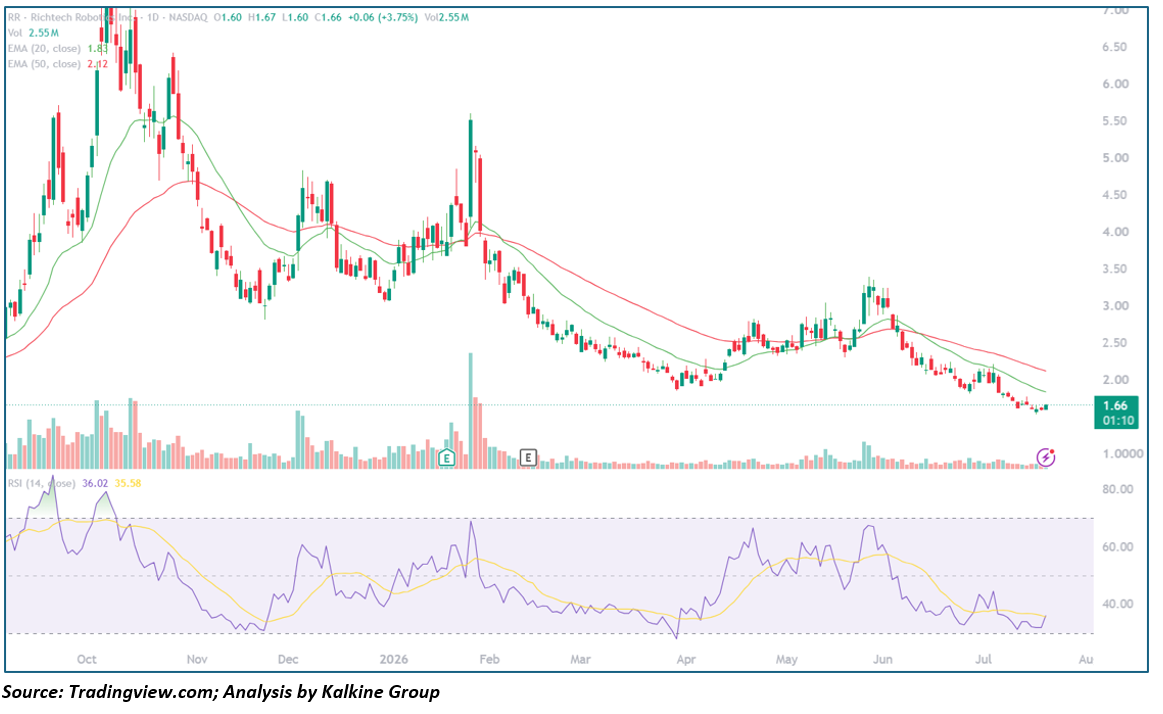
Key Technical Levels Resistance
- $1.83 – 20-day EMA
- $2.12 – 50-day EMA
- ~$5.60 – February 2026 high Support
- ~$1.60 – Today's low / fresh multi-month low
- ~$2.70 – November 2025 consolidation zone
Outlook RR's modest bounce leaves it the laggard of the group, still comfortably below both EMAs after a persistent multi-month decline. A reclaim of the $1.83–$2.12 EMA cluster would be the first sign of stabilization; a break of today's low would risk further downside toward fresh lows.
This analysis is based on daily chart technical indicators (20/50-day EMAs, RSI-14) and price action as of July 20, 2026, and is intended for informational purposes only — not investment advice.


 Nov 13, 2026





 Please wait processing your request...