
 CA
 NZ
 UK
 AU
 IND

 US

 Share
 X (Formerly Twitter)
 Whatsapp
 Facebook
 LinkedIn
 Telegram
 Email This Article
 Copy Link
 Summarize with AI
 Chat GPT
 Perplexity

Today's session marked a clear break from recent resilience across mega-cap tech, with every name covered here trading lower. The damage was far from uniform, though: Alphabet (NASDAQ: GOOGL) suffered a sharp gap-down that pushed it well below its multi-month range and both moving averages, Microsoft (NASDAQ: MSFT) closed below its 20- and 50-day EMAs for the first time in weeks, and Meta Platforms (NASDAQ: META) slipped back toward its EMA cluster after a strong July rally. By contrast, Dell Technologies (NYSE: DELL) and Apple (NASDAQ: AAPL) posted only modest pullbacks and remain comfortably above both EMAs, while Taiwan Semiconductor (NYSE: TSM) sits right at the boundary between the two groups.
Alphabet Inc. (NASDAQ: GOOGL) — Sharp Gap Down Breaks the Multi-Month Range
Key Highlights
- GOOGL trading at $318.04, down 7.03% ($24.05) on volume of 58.17M shares, after ranging between $314.90 and $324.49 on an open at $321.13.
- Price has gapped well below both the 20-day EMA ($352.00) and the 50-day EMA ($355.92), a decisive break rather than a routine pullback.
- RSI has dropped to roughly 31.13, with the signal line at 46.59 — RSI is now approaching oversold territory, a sharp change from the mid-range readings of recent weeks.
- GOOGL rallied steadily through 2025 into a February 2026 high near $400, then spent months consolidating in a range roughly bounded between $290 and $395; today's gap down drives price toward the lower edge of that structure.
- The size of today's decline — both in percentage terms and in the gap itself — is the largest single-day move in the group.
Trend Structure GOOGL's chart shows a long, steady 2025 advance into a February 2026 peak, followed by a multi-month sideways range between roughly $290 and $395. Today's session opened with a gap down that immediately erased the stock's cushion above both EMAs, a materially different pattern than the shallow pullbacks seen elsewhere in the group. 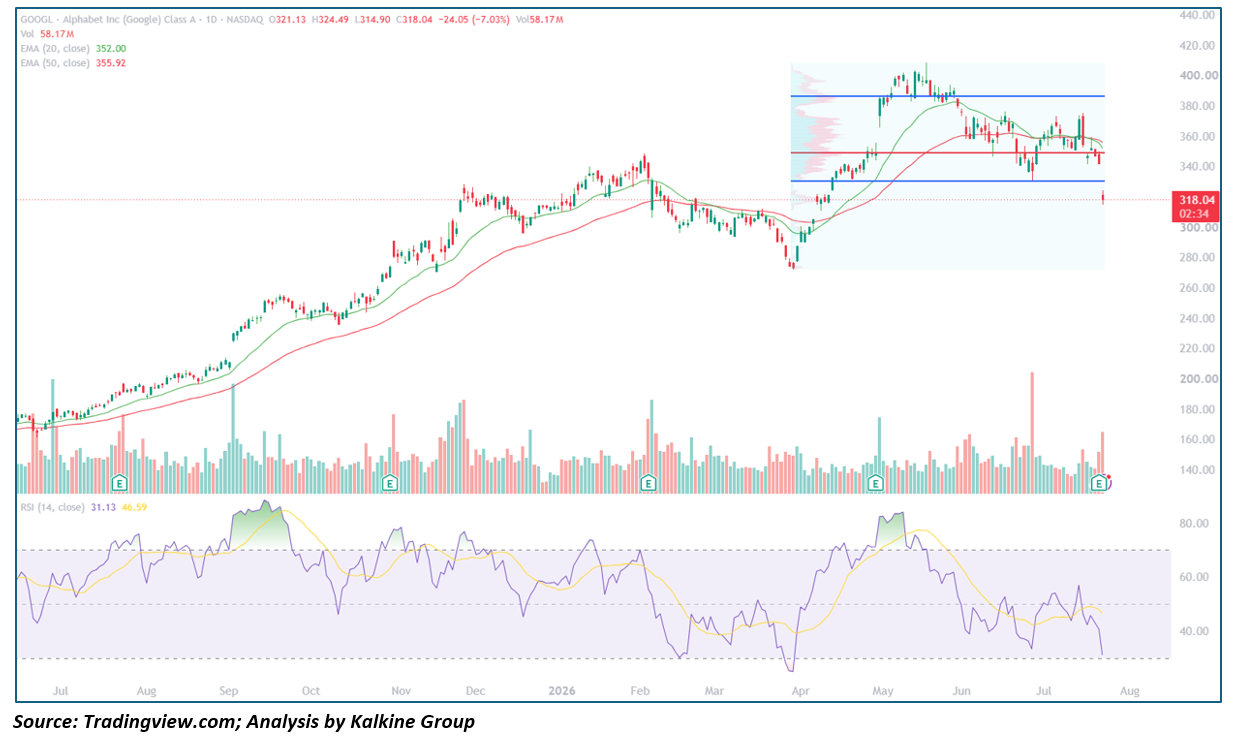
Key Technical Levels Resistance
- $352.00 – 20-day EMA
- $355.92 – 50-day EMA
- ~$395.00 – Upper boundary of the 2026 range Support
- ~$300–$310 – Psychological/prior swing-low zone
- ~$290.00 – Lower boundary of the 2026 range
Outlook GOOGL's gap-driven decline is the most significant technical development among the names covered today, pushing the stock well outside its established range and dropping RSI toward oversold levels. A quick recovery back above the EMA cluster near $352–$356 would suggest the gap was an overreaction; failure to reclaim that zone would raise the risk of a deeper retest toward the lower $290s.
Microsoft Corporation (NASDAQ: MSFT) — Closes Below Both EMAs as the Recent Recovery Stalls
Key Highlights
- MSFT trading at $381.81, down 2.19% ($8.53) on volume of 22.23M shares, after ranging between $377.39 and $391.78 on an open at $389.97.
- Price has closed below both the 20-day EMA ($390.14) and the 50-day EMA ($395.15), a notable shift after weeks spent holding above that cluster.
- RSI sits at roughly 44.79, with the signal line at 50.18 — RSI is now below its signal line and below the midpoint, reflecting the loss of near-term momentum.
- MSFT fell from an October 2025 high near $545 into an April 2026 low near $375, then staged a recovery that carried price back to a June 2026 high near $470 before rolling over into the current pullback.
- Today's decline extends a multi-week slide that has now taken price back below both EMAs.
Trend Structure MSFT's chart shows a steady 2025 advance into an October peak, a sustained decline into an April 2026 low, and a recovery that topped out in June near $470. The subsequent pullback has accelerated in recent sessions, culminating in today's close below both moving averages. 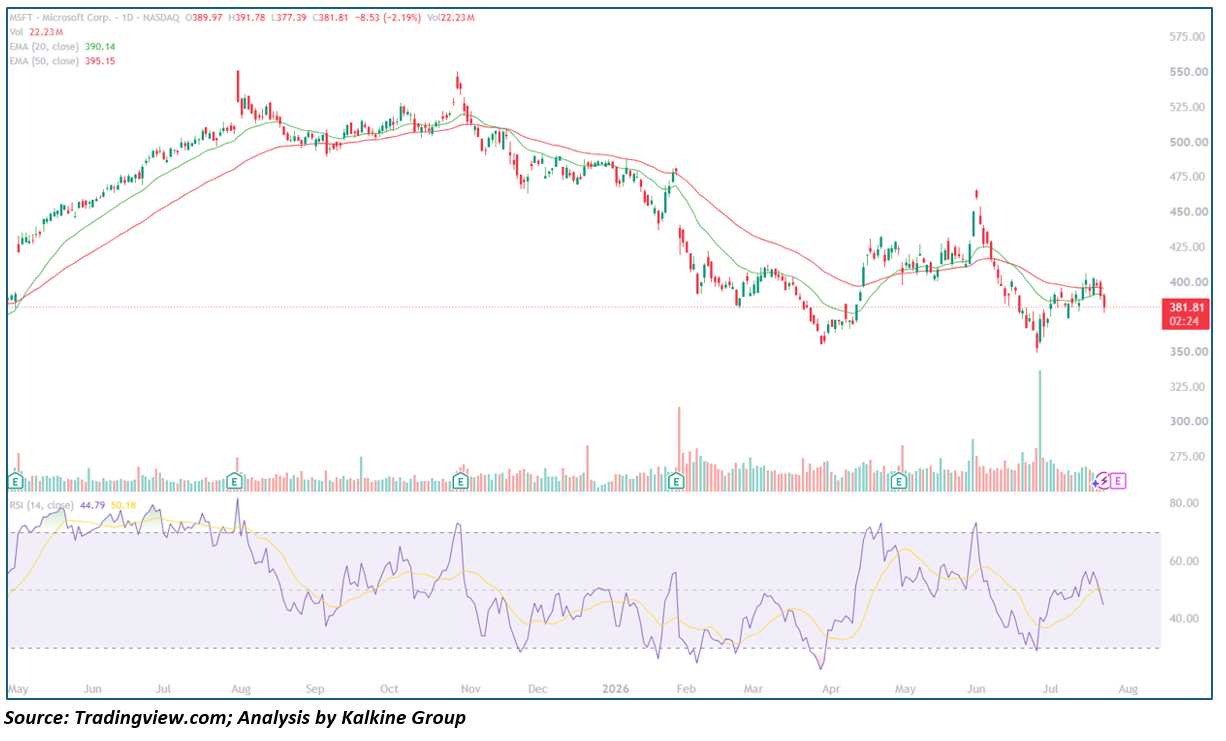
Key Technical Levels Resistance
- $390.14 – 20-day EMA
- $395.15 – 50-day EMA
- ~$470.00 – June 2026 recovery high Support
- ~$375.00 – April 2026 cycle low
- ~$360.00 – Prior consolidation zone
Outlook MSFT's break below both EMAs shifts the near-term picture from constructive to neutral-to-cautious. Reclaiming the $390–$395 zone would suggest the pullback is a routine shakeout within the broader recovery; a slide back toward the April lows near $375 would be the first sign of a more meaningful trend change.
Meta Platforms, Inc. (NASDAQ: META) — Sharp Pullback Lands Right at the EMA Cluster
Key Highlights
- META trading at $606.76, down 3.25% ($20.41) on volume of 11.64M shares, after ranging between $597.22 and $614.65 on an open at $608.41.
- Price has fallen just below the 20-day EMA ($625.15) and is now testing the 50-day EMA ($615.19) from above.
- RSI sits at roughly 46.47, with the signal line at 48.18 — both just below the midpoint, consistent with a fading recovery rather than a fresh downtrend.
- META declined from an August 2025 high near $790 to a November 2025 low near $555, then traded in a wide, choppy range through the following months before a push to a July 2026 high near $680 that today's session is sharply unwinding.
- Today's percentage decline is the second-largest in the group, behind only GOOGL.
Trend Structure META's chart shows a decline from an August 2025 peak into a November 2025 low, a long choppy consolidation through the winter and spring, and a renewed push higher into July 2026 that has now reversed sharply, bringing price back down to the 20/50-day EMA cluster. 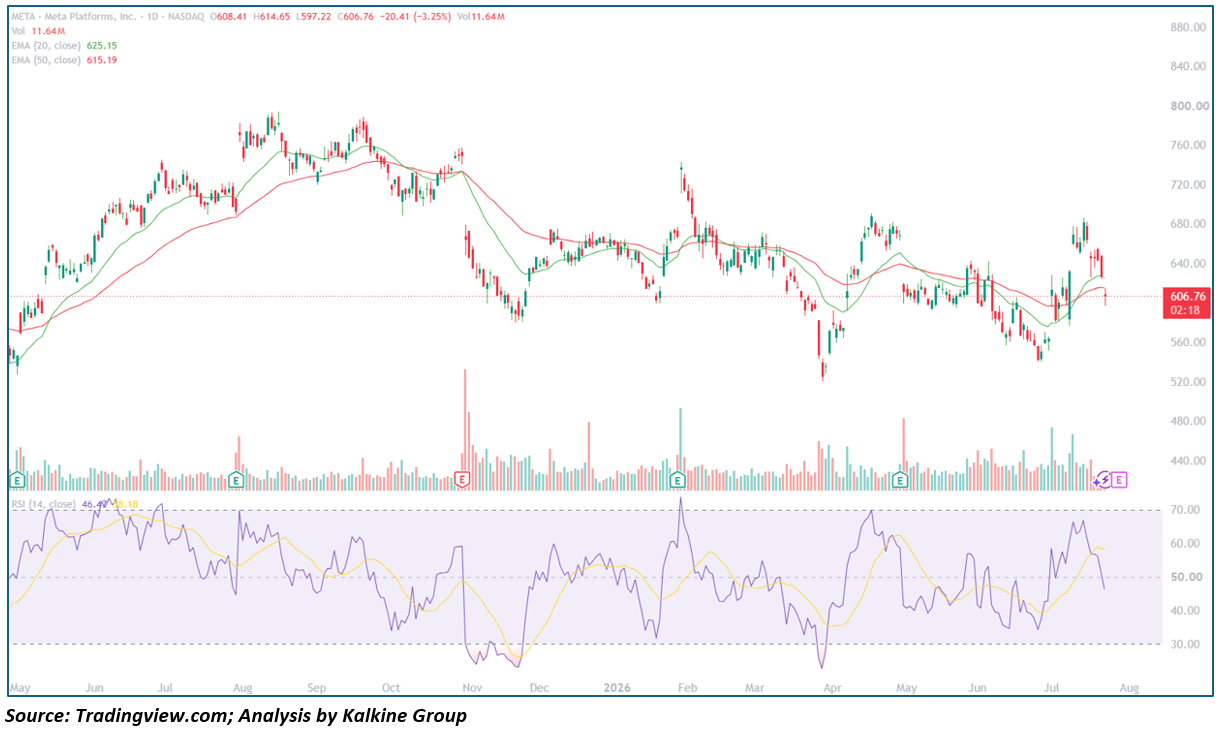
Key Technical Levels Resistance
- $615.19 – 50-day EMA
- $625.15 – 20-day EMA
- ~$680.00 – July 2026 recovery high Support
- ~$555.00 – November 2025 cycle low
- ~$550.00 – Lower bound of the choppy range
Outlook META's pullback has erased much of its July gains and now sits directly on the EMA cluster that has provided support during past bounces. Holding above $605–$615 would keep the recovery attempt alive; a decisive break below that zone would open the door to a retest of the broader range lower down near $550–$555.
Taiwan Semiconductor Manufacturing Co. (NYSE: TSM) — Pulling Back Toward the 50-Day EMA After a Strong Spring Advance
Key Highlights
- TSM trading at $414.19, down 1.67% ($7.02) on volume of 8.3M shares, after ranging between $411.80 and $420.84 on an open at $415.84.
- Price has closed below the 20-day EMA ($424.12) and is now hovering just below the 50-day EMA ($419.63) as well.
- RSI sits at roughly 45.92, with the signal line at 47.02, both near the midpoint and trending modestly lower.
- TSM advanced steadily from an August 2025 base through a brief pause near $325–$350, then resumed its climb into a June 2026 high near $475 before settling into the current pullback.
- Today's decline continues a multi-week fade from the June highs.
Trend Structure TSM's chart shows a long, persistent uptrend from mid-2025 through mid-2026, briefly interrupted by a sideways pause in late 2025 before resuming into a June 2026 peak. The stock has since drifted lower, and today's session pushed price below both EMAs. 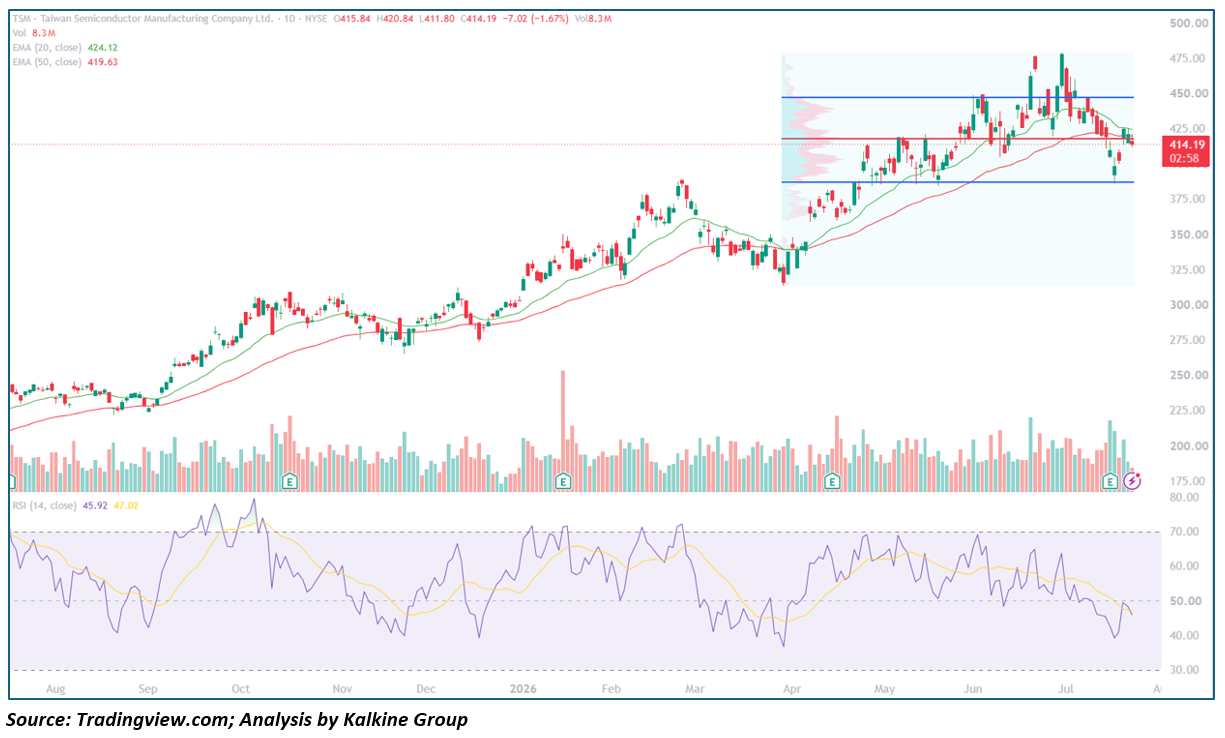
Key Technical Levels Resistance
- $419.63 – 50-day EMA
- $424.12 – 20-day EMA
- ~$475.00 – June 2026 cycle high Support
- ~$400.00 – Recent range-low pivot
- ~$380.00 – Lower boundary of the 2026 consolidation
Outlook TSM's pullback has now taken price below both EMAs, a shift from the constructive posture of recent months. A close back above $420–$424 would suggest the broader uptrend remains intact; continued weakness toward $400 would signal the pullback has further to run.
Apple Inc. (NASDAQ: AAPL) — Modest Pullback After a Strong July Rally, Still Above Both EMAs
Key Highlights
- AAPL trading at $321.52, down 1.34% ($4.37) on volume of 26.66M shares, after ranging between $319.35 and $323.30 on an open at $321.73.
- Price remains above both the 20-day EMA ($316.11) and the 50-day EMA ($304.05), a comfortable cushion despite today's decline.
- RSI sits at roughly 57.98, with the signal line at 64.19 — RSI is now below its signal line after touching overbought territory during the recent rally.
- AAPL fell into an April 2026 low near $273, recovered through May and June to the $300–$310 area, then rallied sharply through July to a high near $330 that today's session is modestly unwinding.
- Today's decline is the smallest percentage move among the group's decliners aside from TSM and DELL.
Trend Structure AAPL's chart shows a decline into an April 2026 low, a recovery through the spring that stalled near the 61.8% retracement of the prior decline, and a strong breakout in July that carried price to fresh highs near $330 before today's pullback. 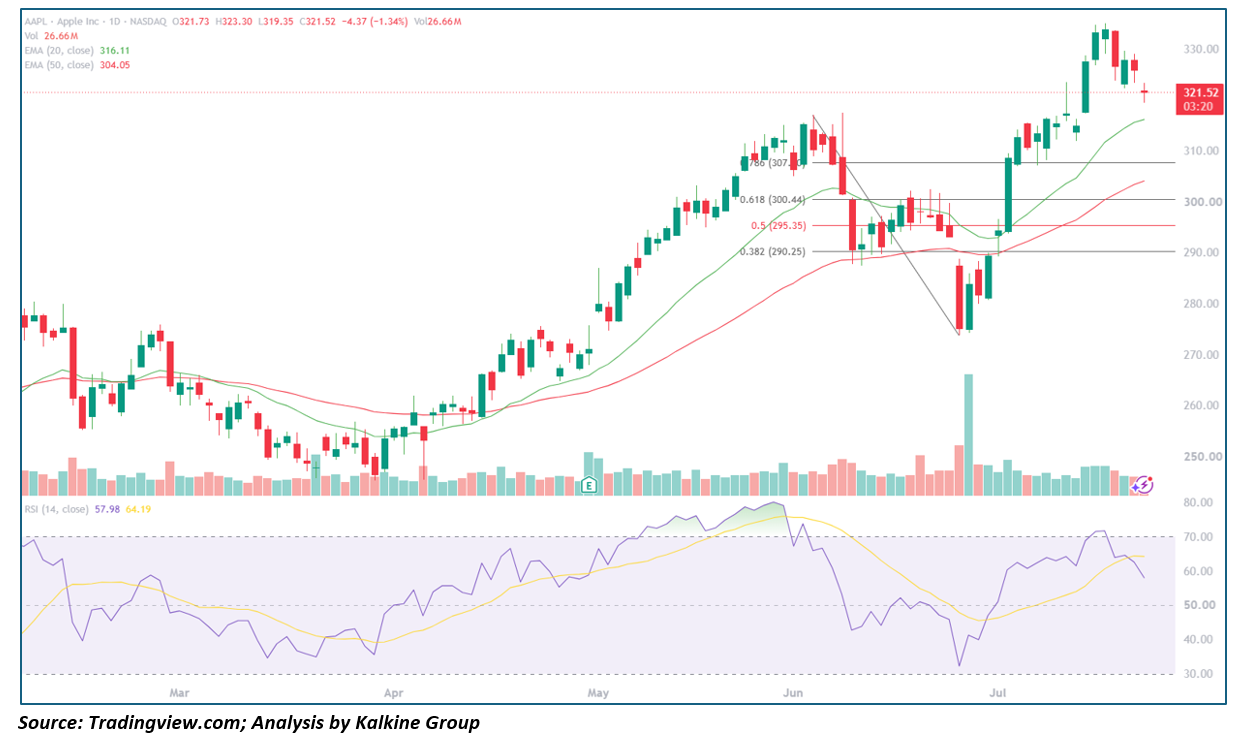
Key Technical Levels Resistance
- ~$330.00 – July 2026 high
- $323.30 – Today's intraday high Support
- $316.11 – 20-day EMA
- $304.05 – 50-day EMA
- ~$295.00 – 50% retracement of the April decline
Outlook AAPL's pullback is shallow and leaves the stock well above both EMAs, consistent with a healthy pause after a strong July advance rather than a reversal. Holding above the 20-day EMA near $316 would keep the breakout intact; a deeper slide toward the 50-day EMA near $304 would be the first real test of the recent strength.
Dell Technologies Inc. (NYSE: DELL) — Smallest Decline in the Group, Still Extended Above Both EMAs
Key Highlights
- DELL trading at $436.03, down 1.31% ($5.77) on volume of 4.29M shares, after ranging between $434.10 and $454.77 on an open at $438.00.
- Price remains well above both the 20-day EMA ($413.92) and the 50-day EMA ($372.81), reflecting the strength of the stock's multi-month advance.
- RSI sits at roughly 56.38, with the signal line at 55.46 — RSI is still modestly above its signal line despite today's pullback.
- DELL broke out of a long base in February 2026 and rallied in near-parabolic fashion to a June 2026 high near $475, pulled back to a July low near $390, then rallied back toward $455 before today's give-back.
- Today's decline is the smallest percentage move among all six names covered.
Trend Structure DELL's chart shows a steady 2025 base, a February 2026 breakout, and a powerful advance into a June 2026 high near $475. A July pullback to roughly $390 was followed by a sharp rally back toward $455, and today's modest pullback comes from just below that recent high. 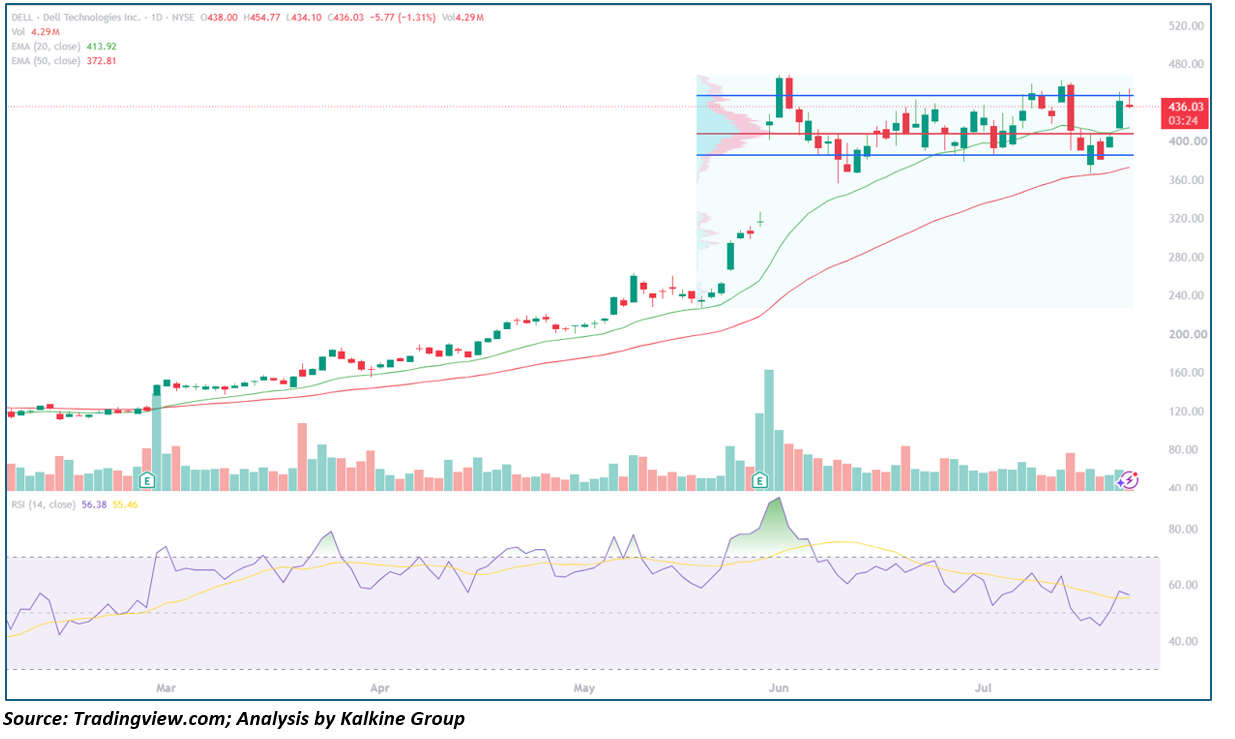
Key Technical Levels Resistance
- ~$454.77 – Recent rally high (this week)
- ~$475.00 – June 2026 cycle high Support
- $413.92 – 20-day EMA
- $372.81 – 50-day EMA
- ~$390.00 – July 2026 pullback low
Outlook DELL's pullback is the mildest in the group, and the stock remains firmly extended above both EMAs, consistent with an uptrend that is digesting recent gains rather than reversing. A close back above $455 would support a retest of the $475 high; a slide back toward the 20-day EMA near $414 would suggest a more meaningful cooling-off period is underway.
This analysis is based on daily chart technical indicators (20/50-day EMAs, RSI-14) and price action as of July 24, 2026, and is intended for informational purposes only — not investment advice.


 Nov 10, 2026





 Please wait processing your request...