
Key Highlights
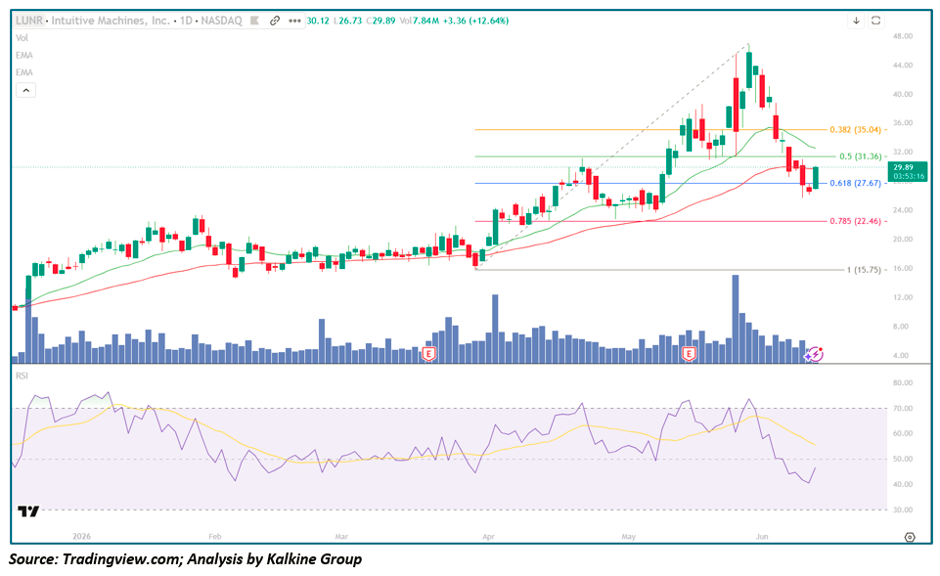
- LUNR closed at $29.89, surging +$3.36 (+12.64%) on volume of 7.84M shares, with an intraday range of $26.73–$30.12 — a powerful reversal candle after weeks of relentless post-parabolic selling
- The intraday low of $26.73 pierced the 0.618 Fibonacci retracement at $27.67 before staging a sharp recovery, creating a significant "wick rejection" below the golden ratio — the most closely watched level on the chart
- Price is currently trading just above the 0.5 Fibonacci level at $31.36, having reclaimed it intraday — the speed and magnitude of today's reversal suggests institutional demand has finally emerged at the Fibonacci confluence zone
- RSI-14 has been in sharp decompression from the ~75 zone in May to approximately ~43 and declining, approaching oversold territory — though today's bounce has provided a tentative stabilisation signal that bulls will be monitoring closely
- The stock staged one of the most explosive rallies in the lunar economy space — surging from the cycle low of ~$15.75 to a high of ~$47 in a matter of weeks — making the current 36%+ pullback from the highs a technically painful but structurally expected digestion phase
- Two distinct earnings catalyst events (visible as "E" markers on the chart) bookend the base and the breakout phases, confirming the move was fundamentally anchored rather than purely speculative
- The $27.67 (0.618 Fibonacci) level has now been tested and has so far held on a closing basis — a critically important development that keeps the broader bull thesis intact
Understanding the Fibonacci Retracement Plotted on the Chart
The Fibonacci retracement tool has been drawn from the cycle low of $15.75 (the "1" level) to the cycle high of approximately $47 (the "0" level), measuring the key retracement zones across the entire multi-month advance.
0.382 Retracement — $35.04 (Yellow Line) The shallowest retracement at $35.04 has already been broken convincingly. In a robust uptrend, the 38.2% level should hold on a first test — losing it signals the correction has more depth than initially anticipated and shifts attention to deeper Fibonacci zones. This level now acts as the first layer of overhead resistance on any recovery.
0.5 Retracement — $31.36 (Green Line) The 50% midpoint at $31.36 represents the exact equilibrium between the cycle low and cycle high. Price has been oscillating around this level during recent sessions, and today's intraday recovery back above it is a modestly constructive development. A sustained close above $31.36 would signal that the correction may be finding its footing.
0.618 Retracement — $27.67 (Blue Line) The 61.8% "golden ratio" at $27.67 is the most significant Fibonacci level in technical analysis — and today's price action made it the epicentre of the entire bull/bear battle. The intraday low of $26.73 breached this level before recovering sharply above it, creating the kind of wick rejection that technical traders interpret as evidence of structural demand. This is the level that keeps the broader uptrend structurally intact; a confirmed close below it on heavy volume would materially shift the outlook.
0.785 Retracement — $22.46 (Pink/Red Line) A 78.5% retracement at $22.46 would represent a near-complete roundtrip of the entire rally. This level corresponds approximately to the pre-earnings consolidation range, meaning a decline here would effectively return price to the pre-catalyst base — suggesting the breakout thesis may be fundamentally compromised rather than simply extended.
1.0 Level — $15.75 (Grey Line) The cycle origin and catastrophic bear scenario — a complete 100% retracement of the entire advance. A return here would signal a definitively failed breakout of the highest order.
Trend Structure: Accumulation, Parabolic Surge, and the Fibonacci Retracement Test
Phase 1 — Extended Basing & Gradual Accumulation (Dec 2025 – Mar 2026)
LUNR spent the better part of December 2025 through early March 2026 constructing a broad multi-month base in approximately the $16–$22 range:
- Price oscillated within a defined range with both moving averages running essentially flat, reflecting dormant trend energy accumulating beneath the surface
- RSI oscillated between 40 and 65 without establishing sustained directional conviction — a neutral range consistent with genuine basing behaviour rather than distribution
- Volume remained subdued throughout this phase, with no outsized spikes to suggest institutional accumulation was accelerating
- The first earnings catalyst marker ("E") visible in late February/early March appears to have served as a directional confirmation event, nudging price out of the lower range but not yet triggering the full parabolic advance
- A falling resistance trendline connecting the lower highs during this phase was ultimately broken with force as the April rally ignition began
Phase 2 — Breakout Ignition & Parabolic Advance (Apr – May 2026)
The April–May advance was one of the most powerful moves in the lunar economy space sector:
- The second earnings catalyst ("E") visible in April detonated an explosive breakout candle — the largest single-session volume spike visible on the entire chart — launching price from the base directly into the $30+ range in a single session
- From there, momentum compounded in a near-parabolic arc from approximately $18 at the cycle low to ~$47 at the peak — a gain exceeding 195% inside the measured Fibonacci range
- RSI surged from the mid-50s into overbought territory above 70–75, reflecting genuine institutional re-rating momentum driven by fundamental catalysts (lunar contracts, commercial launch demand) rather than retail speculation alone
- A dashed diagonal trendline visible on the chart traces the parabolic ascent, connecting the series of higher lows during the surge phase and illustrating the steep, unsustainable angle of advance
Phase 3 — Post-Parabolic Correction & Fibonacci Retracement (Late May – Jun 2026)
The reversal from the $47 peak has been swift and damaging in magnitude:
- Price has declined from ~$47 to today's intraday low of $26.73 — a pullback of approximately 43% from peak — before staging today's dramatic recovery
- The 0.382 level at $35.04 was lost with relative ease, accelerating selling pressure toward the 0.5 and then the 0.618 levels
- Today's intraday wick rejection at $26.73 — piercing below the 0.618 Fibonacci ($27.67) before recovering above it to close at $29.89 — is the most significant single-session technical event since the April breakout ignition
- RSI decompressing from 75 to ~43 represents a substantial but not yet classically oversold reset, suggesting the bounce today may be the beginning of stabilisation rather than a dead-cat rally
Moving Averages: Key Dynamic Support Being Contested
EMA-21 The short-term EMA has rolled over sharply and is now acting as a ceiling rather than a floor. Price remains below the EMA-21, and any genuine recovery would require a sustained reclaim of this level to confirm that momentum has shifted from corrective back to constructive.
EMA-50 The rising EMA-50 — now likely converging near the $27–$29 area — represents a critical dynamic support level that broadly coincides with the 0.618 Fibonacci zone. The convergence of the EMA-50, the golden ratio Fibonacci level, and today's intraday wick rejection in this zone creates a powerful triple confluence that underpins the bull case for a tradeable recovery.
Momentum Analysis: RSI Approaches the Inflection Point
RSI-14 at approximately 43 and declining sits at a juncture that demands close attention:
- The RSI signal line (yellow) is positioned above the RSI line, providing near-term bearish momentum confirmation — but the gap between them has begun to narrow following today's explosive reversal candle
- Current RSI levels mirror the late March 2026 consolidation readings that immediately preceded the April earnings breakout ignition — creating an intriguing parallel that suggests momentum may be resetting to a re-launchable condition
- A stabilisation and recovery of RSI back above 50 while price holds the 0.618–0.5 Fibonacci zone would be the most constructive technical development possible for bulls
- A continued deterioration of RSI below 35–30 would suggest the correction is morphing from a healthy pullback into a more serious trend reversal
Key Technical Levels
Resistance Levels
- $31.36 — 0.5 Fibonacci retracement, key near-term overhead resistance
- $35.04 — 0.382 Fibonacci retracement, now broken and acting as secondary resistance
- $40–$44 — prior late May distribution zone
- $47 — cycle high and ultimate bull target for any full recovery continuation
Support Levels
- $27.67 — 0.618 "golden ratio" Fibonacci, tested and held intraday today — the critical near-term floor
- $26.73 — today's intraday wick low — immediate micro support
- $22.46 — 0.785 Fibonacci retracement and pre-breakout consolidation zone
- $15.75 — cycle low and 1.0 Fibonacci level; catastrophic bear scenario
Scenario Analysis
- Bullish Continuation (Primary Case) If today's wick rejection at the 0.618 Fibonacci ($27.67) holds on a closing basis and price consolidates above $28–$30: → RSI stabilises near 40–45 and begins recovering toward 50 → Price reclaims the 0.5 Fibonacci ($31.36) and EMA-21 on a subsequent session, confirming the correction has found its floor → Momentum rebuilds toward the 0.382 Fibonacci ($35.04) and ultimately a recovery toward the $40–$44 range → The lunar economy macro tailwind — driven by NASA contracts, commercial payload demand, and the broader government push into space infrastructure — continues to provide fundamental support for institutional re-rating
- Deeper Fibonacci Pullback (Constructive But Painful) Today's recovery fails to sustain and price revisits the 0.618 level at $27.67 with heavier volume: → A confirmed close below $27.67 would extend the correction toward the 0.785 retracement at $22.46 → This would represent a ~52% total correction from the cycle high — severe, but consistent with the post-parabolic digestion seen in high-momentum small-cap names after earnings-driven surges → A hold and reversal from $22.46 with RSI reaching oversold extremes (~30) would create a high-conviction re-entry opportunity, particularly if accompanied by a fundamental catalyst reaffirming the lunar commercial thesis
- Bearish Breakdown (Risk Case) A confirmed close below $22.46 (0.785 Fibonacci) on heavy volume would raise serious structural concerns: → Downside risk extends toward the cycle low at $15.75 — effectively a complete roundtrip of the entire advance → This scenario would imply the April earnings breakout was an overextension of short-term optimism rather than a structural re-rating → RSI would almost certainly reach deeply oversold levels, though momentum exhaustion alone does not guarantee a reversal in this scenario
Conclusion: LUNR Posts Its Most Important Session Since the April Breakout — But One Day Does Not Confirm a Floor
Today's +12.64% reversal candle — with an intraday wick piercing the 0.618 golden ratio Fibonacci at $27.67 before closing near $29.89 — is the most technically significant session for LUNR since the April earnings breakout ignition. The dramatic intraday recovery on respectable volume suggests that institutional demand has not entirely abandoned the stock and that the $26–$28 zone is being contested with conviction by buyers. However, one powerful recovery candle following a multi-week decline is insufficient evidence to declare the correction definitively over.
Bulls require confirmation: RSI must stabilise and begin recovering above 45–50, price must reclaim the 0.5 Fibonacci ($31.36) on a subsequent session with expanding volume, and today's wick low at $26.73 must not be revisited on a closing basis. The framework going forward is clear:
- Above $35.04 (0.382 Fib) → correction complete, uptrend resuming, target $40–$47
- Hold at $27.67–$31.36 (0.618–0.5 Fib zone) → base-building underway, re-entry opportunity developing
- Below $27.67 (0.618 Fib) on a close → deeper correction confirmed, risk escalates toward $22.46
- Below $22.46 (0.785 Fib) → structural breakdown, breakout thesis under serious question
For momentum traders and lunar economy bulls, today's price action at the 0.618 Fibonacci confluence offers the most compelling risk-reward setup since the pre-breakout base in March — but patience and a confirmed close above $31.36 remain essential prerequisites before committing capital into what remains a structurally declining short-term trend.


_06_11_2026_22_43_52_812084.jpg)

 Please wait processing your request...