
 CA
 NZ
 UK
 AU
 IND

 US

 Share
 X (Formerly Twitter)
 Whatsapp
 Facebook
 LinkedIn
 Telegram
 Email This Article
 Copy Link
 Summarize with AI
 Chat GPT
 Perplexity

Today's session showed a split market. The major index ETFs, SPDR S&P 500 (NYSE Arca: SPY) and Invesco QQQ Trust (NASDAQ: QQQ), pushed decisively higher, with SPY tagging fresh all-time highs and RSI approaching overbought territory. Beneath the surface, however, the picture was more mixed: VanEck Semiconductor ETF (NASDAQ: SMH) staged a bounce back above its EMA cluster after a sharp summer drawdown, Roundhill Memory ETF (CBOE: DRAM) remained pinned below both moving averages after a steep correction from its July highs, and iShares Bitcoin Trust (NASDAQ: IBIT) continued to consolidate in a tight range well off its spring peak.
SPDR S&P 500 ETF Trust (NYSE Arca: SPY) — Gap to New All-Time Highs, RSI Nearing Overbought
Key Highlights
- SPY trading at $771.66, on volume of 29.15M shares, after ranging between $769.91 and $776.85 on an open at $775.85.
- Price has gapped well above both the 20-day EMA ($749.33) and the 50-day EMA ($741.69), extending the gap to an unusually wide level.
- RSI has climbed to roughly 66.23, with the signal line at 51.29 — approaching overbought, but with room before hitting extremes last seen in April.
- SPY fell sharply from a March/April 2026 high near $700 into an early-April low near $638, then staged a powerful recovery that has carried the index to new highs above $776 by early August.
- Volume on the recent push has been elevated relative to the summer's quieter sideways trade near $720–$745.
Trend Structure
SPY's chart shows a shallow, choppy uptrend through late 2025 into early 2026, followed by a sharp corrective break to the April 2026 low near $638. Since then, the recovery has been steady and orderly, briefly consolidating between $720 and $760 through June and July before today's breakout pushes price to fresh all-time highs. 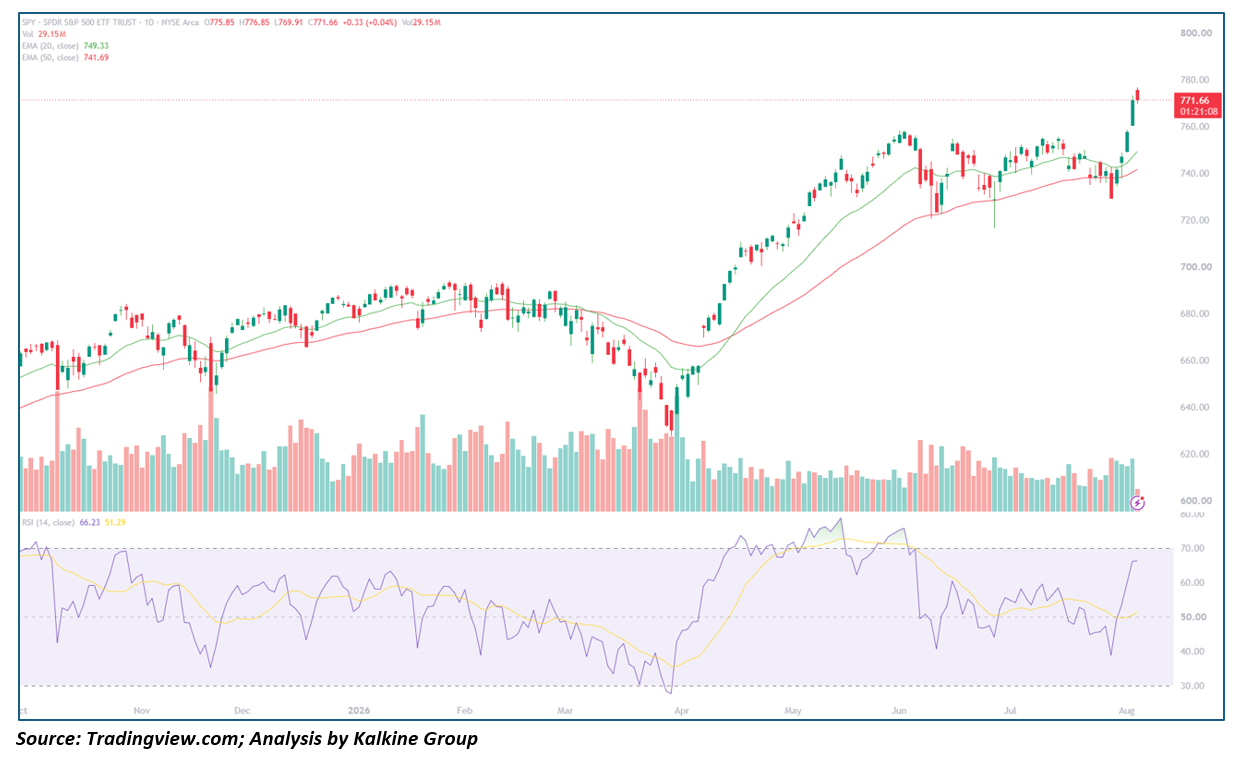
Key Technical Levels
Resistance
- $776.85 – Today's intraday high
- ~$780.00 – Psychological round-number level
Support
- $749.33 – 20-day EMA
- $741.69 – 50-day EMA
- ~$720.00 – Prior summer consolidation zone
Outlook
SPY's breakout to new highs is constructive, and RSI still has room before flashing extreme overbought readings. A hold above the $749–$760 zone on any pullback would confirm the breakout as durable; a fast reversal back into the prior range would suggest today's gap needs more time to be digested.
Invesco QQQ Trust (NASDAQ: QQQ) — Reclaims EMA Cluster After Sharp August Pullback
Key Highlights
- QQQ trading at $720.62, down 0.45% ($3.23) on volume of 24.3M shares, after ranging between $719.48 and $728.54 on an open at $726.25.
- Price remains above both the 20-day EMA ($701.42) and the 50-day EMA ($701.35), which have converged into a tight cluster after crossing.
- RSI sits at roughly 56.73, with the signal line at 44.37 — recovering from an oversold dip but not yet stretched.
- QQQ rallied from an April 2026 low near $580 to a July high near $758, before a sharp pullback into early August took price down to roughly $660 — a drawdown of over 12% — ahead of the current bounce.
- Today's pullback comes after a strong two-day rebound off the early-August low.
Trend Structure
QQQ's chart mirrors SPY's broader arc: a steady 2025 grind, a sharp April 2026 washout low near $580, and a strong recovery into a July peak near $758. The subsequent correction into early August was sharper than SPY's, taking QQQ back toward its EMA cluster before the current bounce reclaimed both averages. 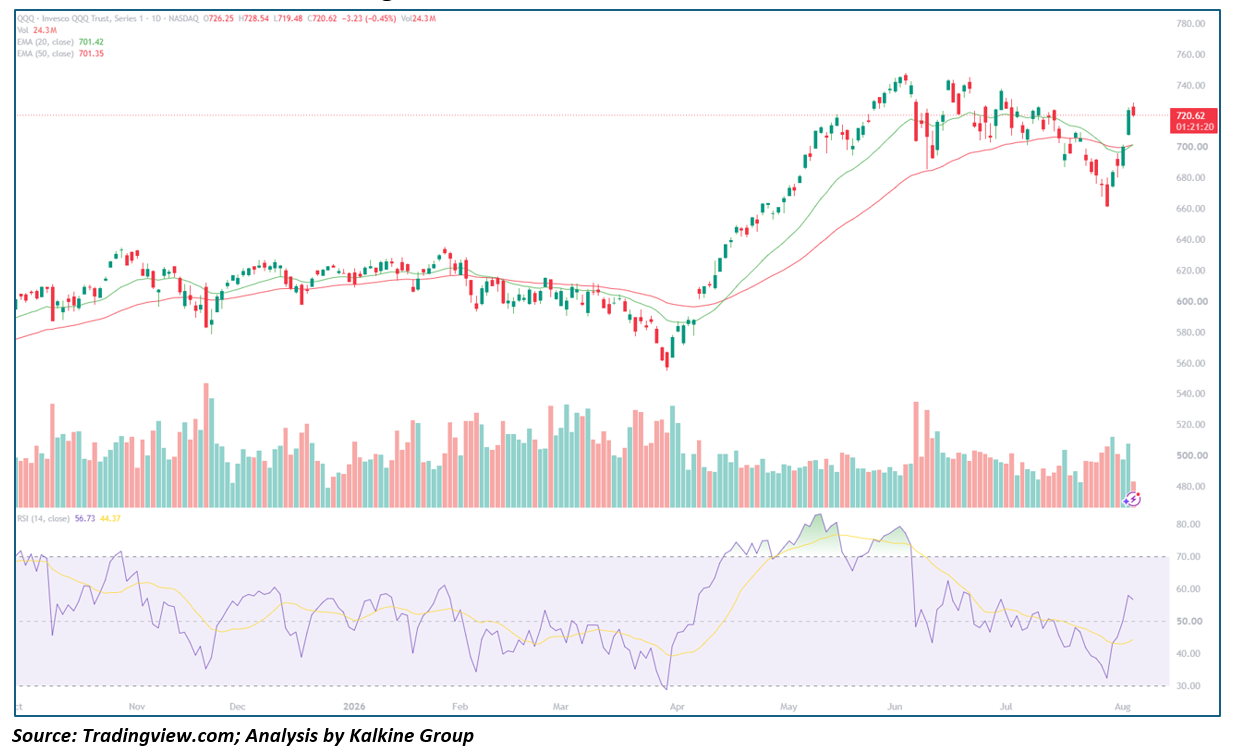
Key Technical Levels
Resistance
- ~$740.00 – July consolidation zone
- ~$758.00 – July 2026 swing high
Support
- $701.42 – 20-day EMA
- $701.35 – 50-day EMA
- ~$660.00 – Early August 2026 low
Outlook
QQQ's reclaim of its EMA cluster is a first step toward repairing the recent damage, though the pullback from the July high was notably deeper than the broader market's. A close back above $740 would put the July highs in play; a slide back below the EMA cluster would suggest the correction isn't finished.
VanEck Semiconductor ETF (NASDAQ: SMH) — Bounce Back Above EMAs After Steep Summer Drawdown
Key Highlights
- SMH trading at $575.47, roughly flat (-0.04%, -$0.24) on volume of 4.29M shares, after ranging between $568.38 and $585.00 on an open at $574.41.
- Price has moved back above both the 20-day EMA ($566.46) and the 50-day EMA ($570.06) after briefly dipping below both in late July.
- RSI sits at roughly 51.04, with the signal line at 43.59 — a recovery off oversold levels but still well short of the overbought readings seen in April and May.
- SMH rallied hard from an April 2026 low near $390 to a July high near $683, before correcting sharply to a late-July/early-August low near $503 — a drawdown of nearly 26%.
- Today's session extends a bounce off that low, though volume remains below the elevated levels seen during the selloff.
Trend Structure
SMH's chart shows a powerful, near-uninterrupted uptrend from the April 2026 low into the July peak near $683, followed by a sharp multi-week correction that erased a significant portion of the spring/summer gains. The current bounce has reclaimed both EMAs but remains well below the July highs. 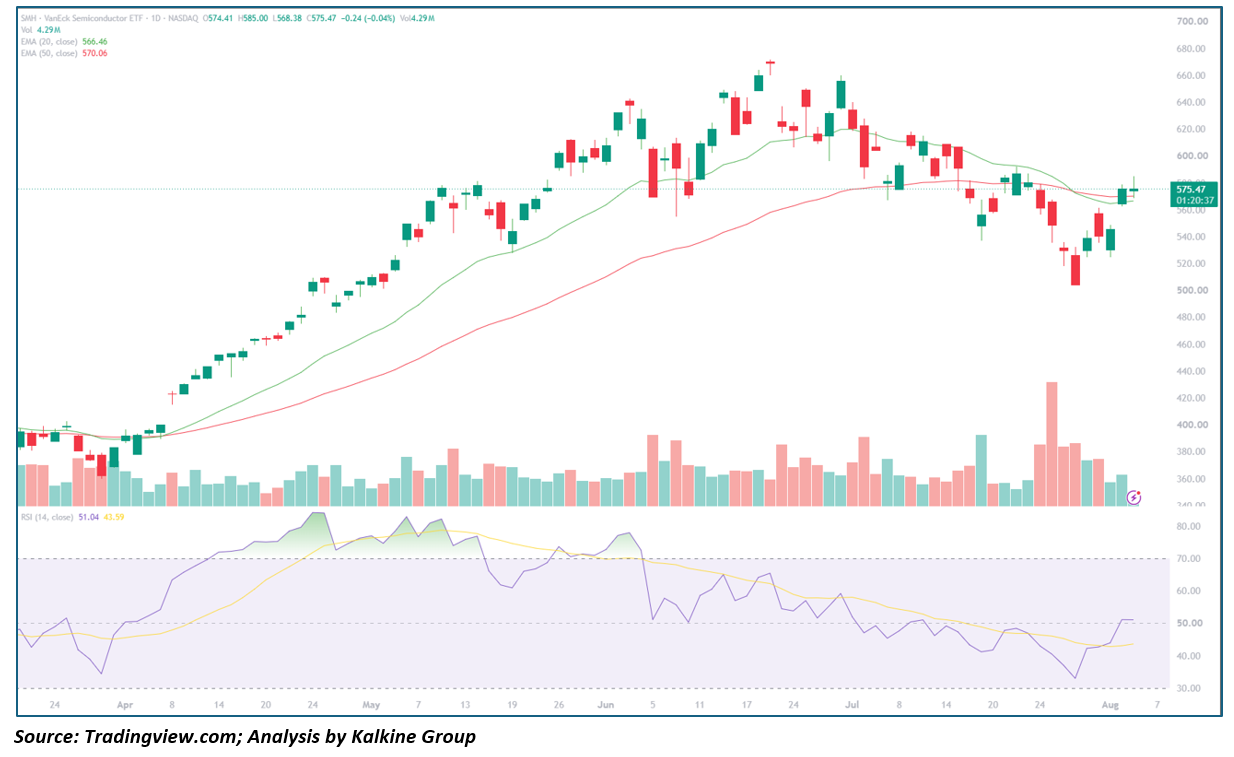
Key Technical Levels
Resistance
- ~$600.00 – Recent consolidation zone
- ~$683.00 – July 2026 cycle high
Support
- $570.06 – 50-day EMA
- $566.46 – 20-day EMA
- ~$503.00 – Early August 2026 low
Outlook
SMH's reclaim of the EMA cluster is an encouraging first step, but the depth of the summer correction means the group likely needs more time to rebuild momentum. A push through $600 would strengthen the recovery case; a fade back below the EMAs would keep the correction narrative intact.
Roundhill Memory ETF (CBOE: DRAM) — Still Capped Below Both EMAs After Sharp Correction
Key Highlights
- DRAM trading at $54.76, down 0.24% ($0.13) on volume of 33.5M shares, after ranging between $53.32 and $55.44 on an open at $53.43.
- Price remains below both the 20-day EMA ($55.15) and the 50-day EMA ($55.75), unlike the other ETFs in this group.
- RSI sits at roughly 48.11, with the signal line at 43.07 — still below the midpoint after a steep decline in momentum from May/June extremes.
- DRAM surged from an April 2026 low near $28 to a July high near $83, more than tripling in a few months, before correcting sharply to a late-July low near $46 — a drawdown of roughly 45% from the peak.
- Volume on the decline was among the heaviest of the past year, underscoring the intensity of the reversal.
Trend Structure
DRAM's chart shows an explosive, near-parabolic rally from April into a July 2026 peak near $83, followed by a violent multi-week correction that has erased more than half of the run's gains. Price has stabilized in the $50–$55 zone over the past two weeks but has yet to reclaim either moving average. 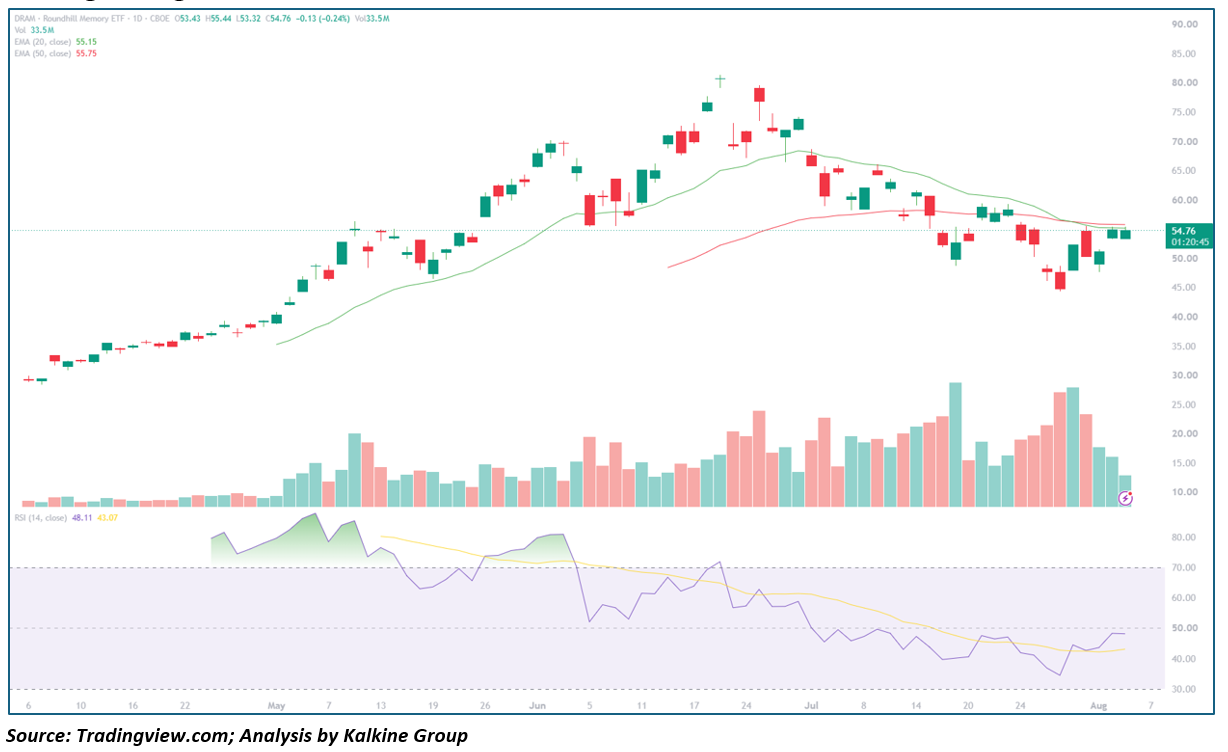
Key Technical Levels
Resistance
- $55.15 – 20-day EMA
- $55.75 – 50-day EMA
Support
- ~$50.00 – Psychological round-number level
- ~$46.00 – Late July 2026 low
Outlook
DRAM's inability to reclaim its EMAs so far distinguishes it from the broader tech/semi bounce, suggesting the memory trade needs more repair time after its parabolic run and sharp reversal. A close back above $55.75 would be the first sign of stabilization; continued failure at that level would keep the near-term trend pointed lower.
iShares Bitcoin Trust (NASDAQ: IBIT) — Range-Bound Below EMA50, Modest Bounce Off Recent Lows
Key Highlights
- IBIT trading at $36.68, up 0.80% ($0.29) on volume of 24.98M shares, after ranging between $36.15 and $36.71 on an open at $36.30.
- Price has moved back above the 20-day EMA ($36.35) but remains below the 50-day EMA ($37.23), which is still sloping downward.
- RSI sits at roughly 51.56, with the signal line at 50.29 — hovering right at the midpoint after recovering from a sharp oversold plunge below 25 in June.
- IBIT fell from a May 2026 high near $47.70 into a June 2026 low near $33.86 — a drawdown of nearly 30% — and has spent the past several weeks consolidating in a $34–$38 range.
- Today's modest gain keeps price within that range rather than breaking decisively in either direction.
Trend Structure
IBIT's chart shows a steady climb from February into a May 2026 peak near $47.70, followed by a sharp June breakdown to $33.86. Since then, price has carved out a choppy consolidation range roughly between $34 and $38, with the 50-day EMA still declining overhead and capping upside attempts. 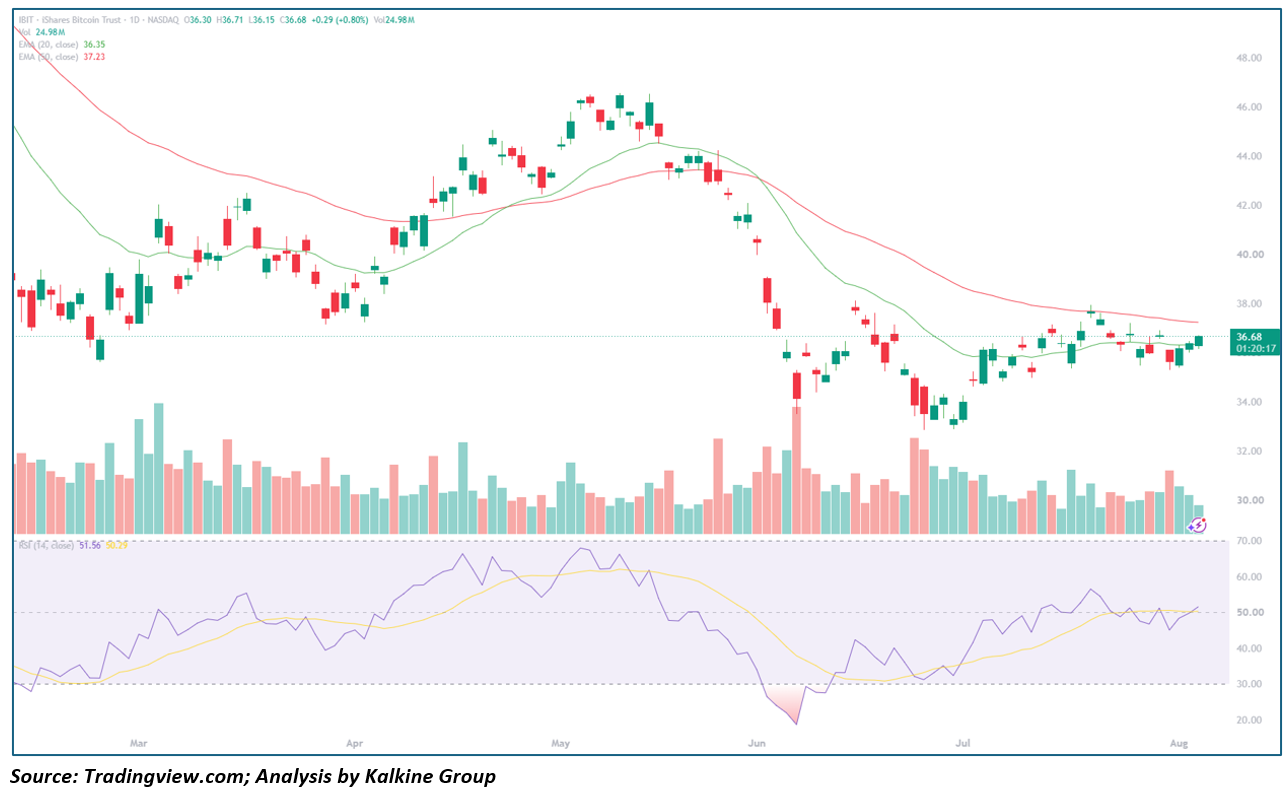
Key Technical Levels
Resistance
- $37.23 – 50-day EMA
- ~$38.00 – Recent range high
Support
- $36.35 – 20-day EMA
- ~$34.00 – Recent range low
- $33.86 – June 2026 low
Outlook
IBIT's move back above its 20-day EMA is a modest positive, but the still-declining 50-day EMA overhead keeps the broader trend neutral-to-cautious. A decisive close above $38 would signal the consolidation is ready to resolve higher; a break back below $34 would put the June low back in focus.
This analysis is based on daily chart technical indicators (20/50-day EMAs, RSI-14) and price action as of early August 5, 2026, and is intended for informational purposes only — not investment advice.


 Nov 13, 2026





 Please wait processing your request...