
 CA
 NZ
 UK
 AU
 IND

 US

 Share
 X (Formerly Twitter)
 Whatsapp
 Facebook
 LinkedIn
 Telegram
 Email This Article
 Copy Link
 Summarize with AI
 Chat GPT
 Perplexity

Today's session delivered a broad, synchronized decline across the bitcoin-mining and AI-infrastructure complex. TeraWulf (NASDAQ: WULF), Core Scientific (NASDAQ: CORZ), Hut 8 (NASDAQ: HUT), CoreWeave (NASDAQ: CRWV), Riot Platforms (NASDAQ: RIOT), Nebius Group (NASDAQ: NBIS), and Applied Digital (NASDAQ: APLD) all traded lower, with losses ranging from roughly 1% to nearly 8%. Every name in the group is now trading below both its 20-day and 50-day EMAs, and RSI readings across the board have slipped toward or below the 40 level — a marked shift after several of these stocks were posting some of the strongest gains in the market as recently as June.
TeraWulf Inc. (NASDAQ: WULF) — Sharp Breakdown Below Both EMAs After a Strong April–June Run
Key Highlights
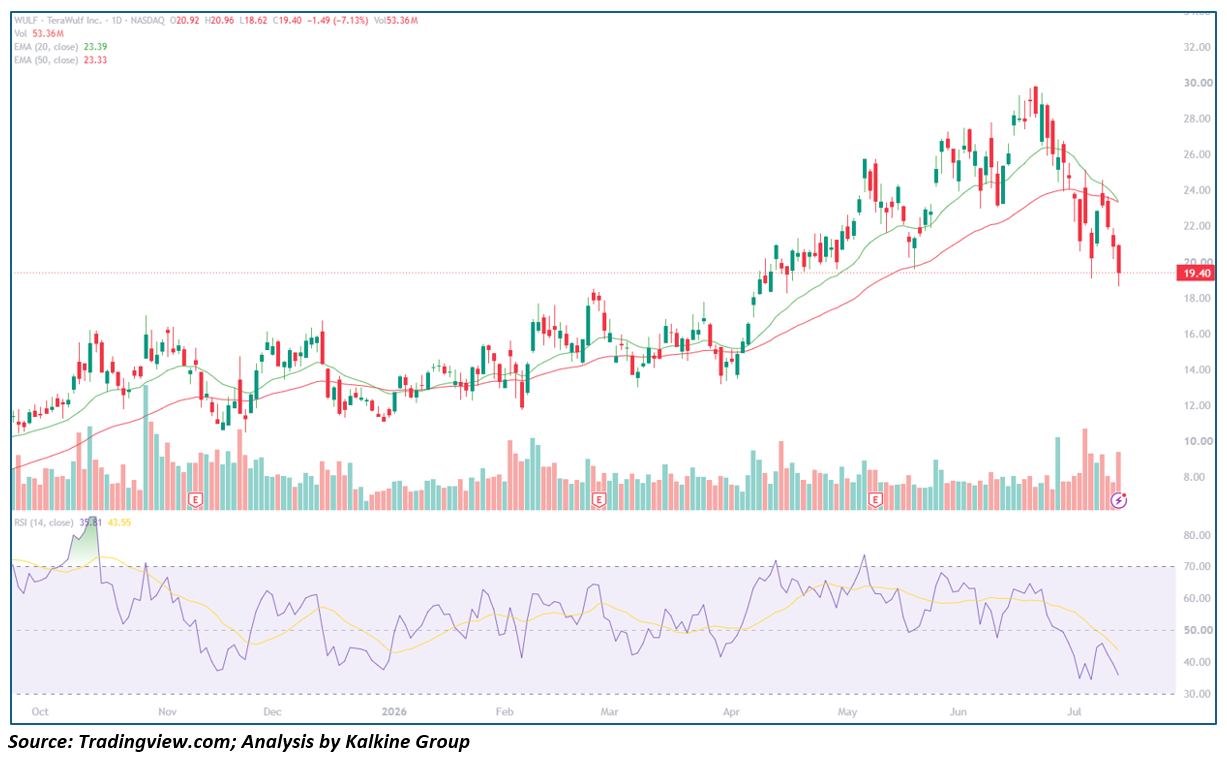
- WULF trading at $19.40, down 7.13% ($1.49) on volume of 53.36M shares, after ranging between $18.62 and $20.96.
- Price has broken decisively below both the 20-day EMA ($23.39) and the 50-day EMA ($23.33), which had only just crossed.
- RSI has fallen to roughly 35.8, with the signal line at 43.5, dropping fast after holding in the 50–70 zone through most of June.
- WULF climbed steadily from around $11 in October 2025 to a peak near $30 in June 2026, before rolling over sharply in early July.
- Today's heavy-volume decline is one of the largest single-day drops of the entire advance.
Trend Structure WULF's chart shows a long, consistent uptrend through the first half of 2026, with pullbacks generally finding support at the rising EMAs. That pattern has now broken — price gapped below both averages in early July and has continued lower since, with today's session adding a fresh leg down on elevated volume.
Key Technical Levels
Resistance
- $23.33–23.39 – 20-day/50-day EMA cluster
- ~$30.00 – June 2026 high
Support
- $18.62 – Today's low
- $16.00 – Prior consolidation zone (April 2026)
Outlook WULF needs to reclaim the EMA cluster near $23 to suggest the breakdown was a temporary flush rather than a trend change. Continued closes below today's low would open the door to a deeper retracement toward the mid-teens.
Core Scientific, Inc. (NASDAQ: CORZ) — Rolling Over From June Highs, RSI Fading Toward Oversold
Key Highlights
- CORZ trading at $22.09, down 2.75% ($0.63) on volume of 5.29M shares, after ranging between $21.95 and $23.48.
- Price sits below both the 20-day EMA ($24.52) and the 50-day EMA ($24.33).
- RSI is at roughly 38.2, with the signal line at 42.5, extending a decline from overbought territory reached in May.
- CORZ was largely range-bound between $14 and $20 from October through March, then broke out sharply from April into a June peak near $30, before reversing hard into current levels.
- Today's decline extends a pullback that began in early July.
Trend Structure CORZ's chart shows a long basing period followed by an aggressive breakout, but the retreat from June's highs has been comparably steep — price is now back testing the lower end of the breakout zone, with both EMAs turning down. 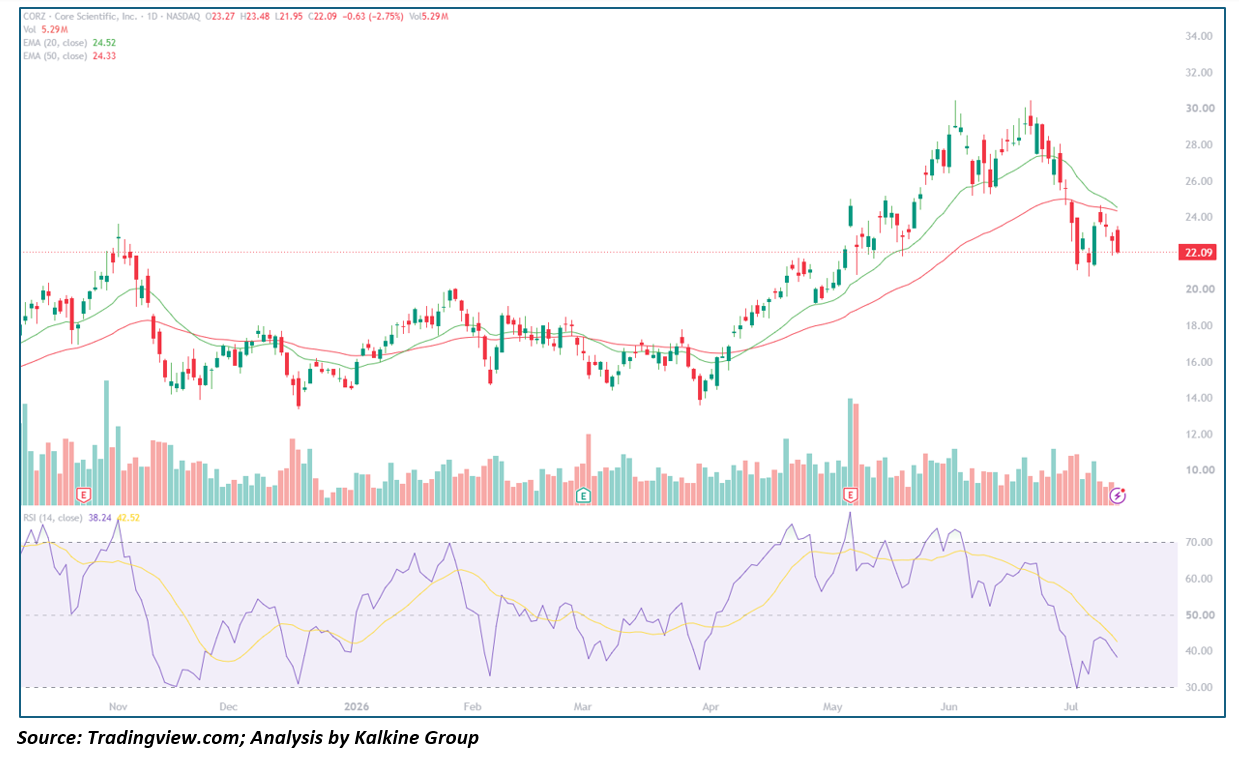
Key Technical Levels
Resistance
- $24.33–24.52 – 50-day/20-day EMA cluster
- ~$30.00 – June 2026 high
Support
- $21.95 – Today's low
- $18.00–20.00 – Pre-breakout resistance-turned-support zone
Outlook A close back above the EMA cluster near $24.50 would help stabilize the picture. Continued weakness below today's low risks a full retracement of the April breakout back toward the $18–20 zone.
Hut 8 Corp (NASDAQ: HUT) — Pulling Back From a Powerful Multi-Month Advance
Key Highlights
- HUT trading at $98.34, down 0.84% ($0.83) on volume of 2.34M shares, after ranging between $96.07 and $104.00.
- Price remains below both the 20-day EMA ($107.90) and the 50-day EMA ($103.99).
- RSI sits at roughly 41.5, with the signal line at 46.5, down from overbought levels seen in May and June.
- HUT rallied from around $35 in October 2025 to a peak near $140 in June 2026 — one of the strongest advances in this group — before correcting into current levels.
- Today's decline is modest relative to the size of the recent pullback, suggesting some stabilization.
Trend Structure HUT's chart shows a textbook basing pattern through Q4 2025 and Q1 2026, followed by a powerful breakout that nearly quadrupled the stock's price into June. The pullback since has been orderly by comparison, with price now consolidating just under the 50-day EMA. 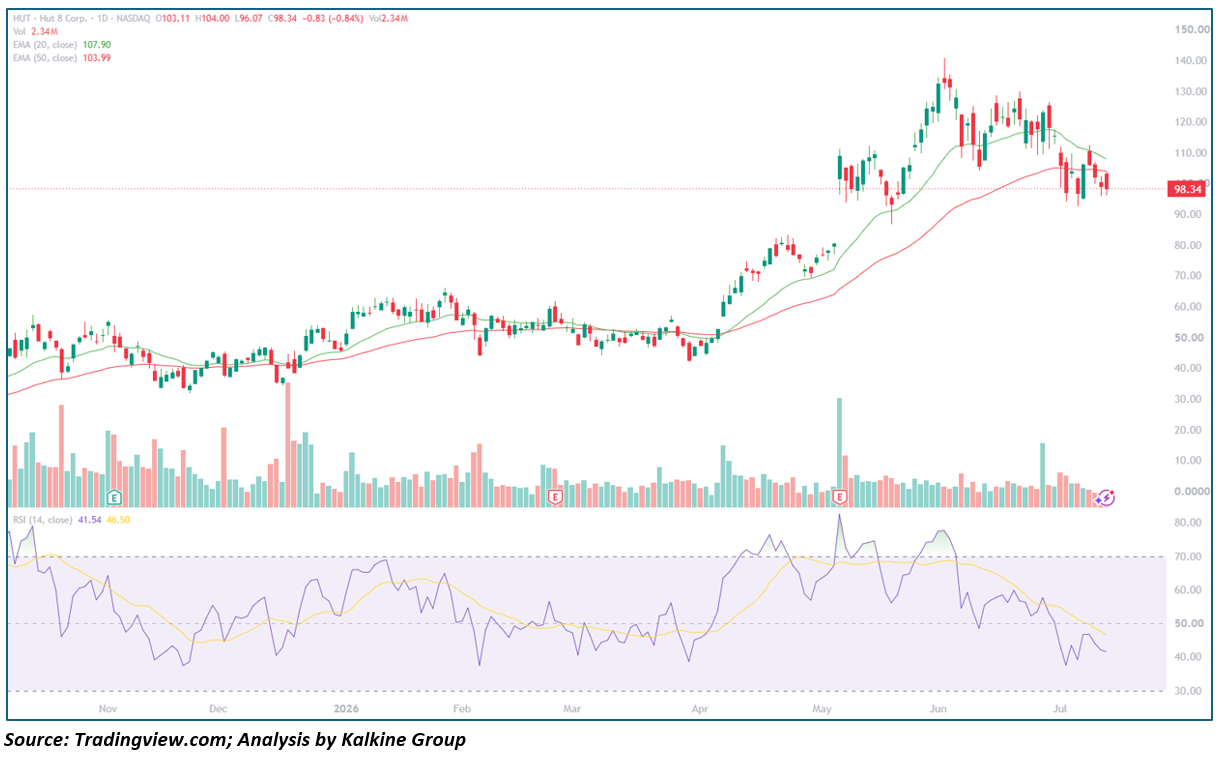
Key Technical Levels
Resistance
- $103.99 – 50-day EMA
- $107.90 – 20-day EMA
- ~$140.00 – June 2026 high
Support
- $96.07 – Today's low
- $90.00 – Round-number support
Outlook HUT's relatively contained decline today, after a sharper drop earlier in July, is a modestly encouraging sign. Reclaiming the 50-day EMA near $104 would be the first step toward stabilizing the broader uptrend.
CoreWeave, Inc. (NASDAQ: CRWV) — Extending a Downtrend, Testing Multi-Month Lows
Key Highlights
- CRWV trading at $79.95, down 4.03% ($3.36) on volume of 18.62M shares, after ranging between $78.40 and $85.91.
- Price remains well below both the 20-day EMA ($93.06) and the 50-day EMA ($99.07).
- RSI is at roughly 35.9, with the signal line at 40.0, continuing to slide after a failed rally attempt in June.
- CRWV has been volatile throughout the past year, swinging from over $150 last October down to roughly $70 by December, rallying back above $140 in May, and now declining again toward the lower end of that range.
- Today's session pushes price to fresh multi-week lows.
Trend Structure Unlike some of the steadier uptrends in this group, CRWV's chart has been choppier — a series of sharp rallies and equally sharp reversals rather than a sustained trend. The current decline has erased most of the April–May rally, and price is now approaching the lower boundary of its year-long trading range. 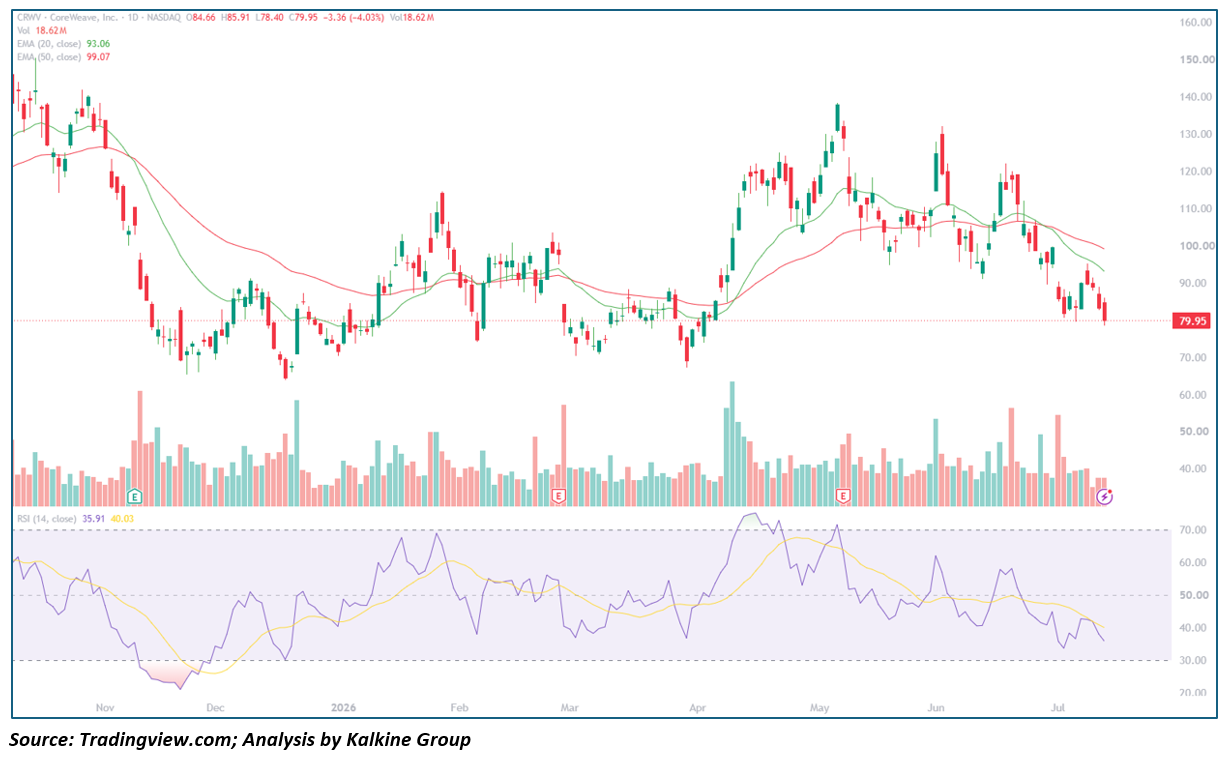
Key Technical Levels
Resistance
- $93.06 – 20-day EMA
- $99.07 – 50-day EMA
- ~$140.00 – May 2026 high
Support
- $78.40 – Today's low
- ~$70.00 – December 2025 low
Outlook CRWV is the weakest chart in the group technically, with price trending lower and well beneath both EMAs. A test of the December low near $70 is the next level to watch if today's weakness continues; reclaiming the 20-day EMA would be needed to suggest a bottom is forming.
Riot Platforms, Inc. (NASDAQ: RIOT) — Flat Session After a Sharp Slide, RSI in Oversold Territory
Key Highlights
- RIOT trading at $20.20, roughly flat on the day (+$0.00, +0.02%) on volume of 12.18M shares, after ranging between $19.57 and $21.57.
- Price remains below both the 20-day EMA ($23.62) and the 50-day EMA ($23.50).
- RSI sits at roughly 32.2, with the signal line at 43.4, deep in oversold territory after a fast decline from June's highs.
- RIOT rallied from around $12 in April 2026 to a peak near $30 in June, then reversed sharply, breaking below a horizontal support level near $18.67 before stabilizing at current levels.
- Today's session is essentially unchanged, a pause after several sharp down days.
Trend Structure RIOT's chart shows a strong April–June advance followed by an equally fast reversal — one of the steeper corrections in this group in percentage terms. Today's flat close, with RSI already in oversold territory, suggests the immediate selling pressure may be pausing, though price has yet to reclaim either EMA. 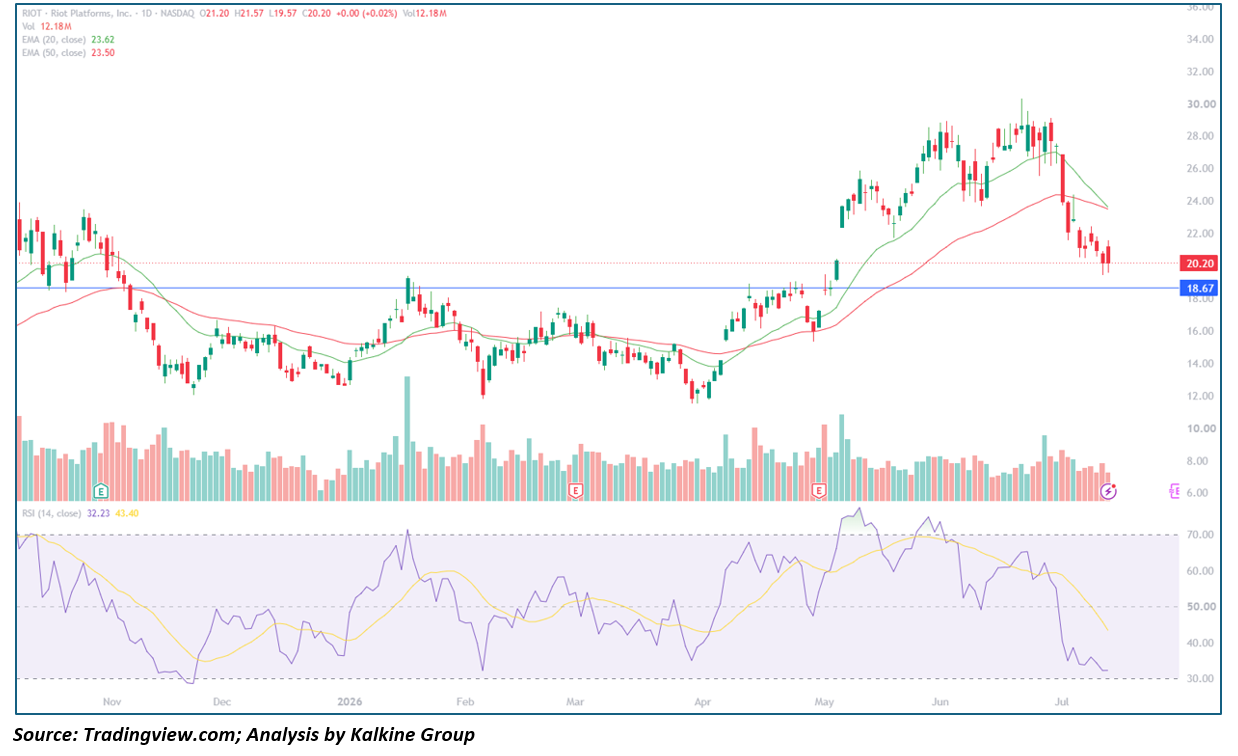
Key Technical Levels
Resistance
- $23.50–23.62 – 50-day/20-day EMA cluster
- ~$30.00 – June 2026 high
Support
- $19.57 – Today's low
- $18.67 – Horizontal support level
Outlook With RSI oversold and price pausing near multi-week lows, RIOT is a candidate for a near-term relief bounce, but a sustained recovery would require reclaiming the EMA cluster above $23. A break of $18.67 would point to further downside.
Nebius Group N.V. (NASDAQ: NBIS) — Steep Single-Day Drop, Breaking Below the 50-Day EMA and Range Support
Key Highlights
- NBIS trading at $193.87, down 7.90% ($16.64) on volume of 15.61M shares, after ranging between $193.00 and $222.75.
- Price has broken below both the 20-day EMA ($227.18) and the 50-day EMA ($215.86), and is now testing a horizontal support line near $193 that has held since April.
- RSI has dropped to roughly 39.8, with the signal line at 48.2, falling fast from levels above 70 in June.
- NBIS rallied from around $90 in April 2026 to an all-time high near $297 in June, before correcting sharply into today's session.
- Today's decline is by far the largest single-day move in the recent pullback, on well-above-average volume.
Trend Structure NBIS delivered one of the strongest advances in this group, more than tripling off its April base. The pullback since June's peak had been relatively contained until today, when price gapped down through the 50-day EMA and is now testing the lower boundary of the range that has framed the entire advance. 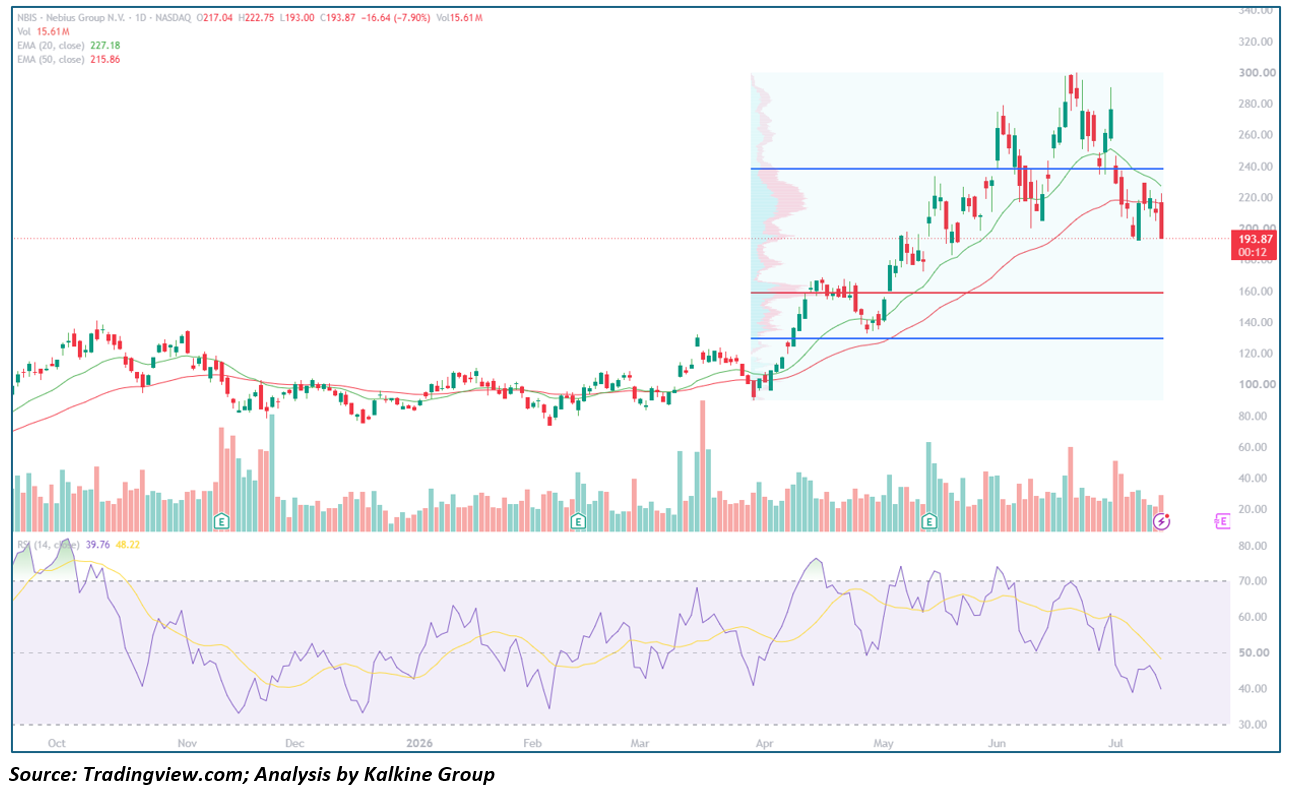
Key Technical Levels
Resistance
- $215.86 – 50-day EMA
- $227.18 – 20-day EMA
- ~$240.00 – Upper range boundary
- ~$297.00 – June 2026 all-time high
Support
- $193.00 – Today's low / lower range boundary
- $163.00 – Range midpoint (April support)
Outlook Today's break below both EMAs and the $193 support shelf is the most significant technical damage seen in NBIS since its April breakout. Holding the $193 zone is now critical — a decisive close below it would open the door to a deeper retracement toward the $163 midpoint.
Applied Digital Corporation (NASDAQ: APLD) — Sliding Back Into Its Multi-Month Range After a Failed Breakout
Key Highlights
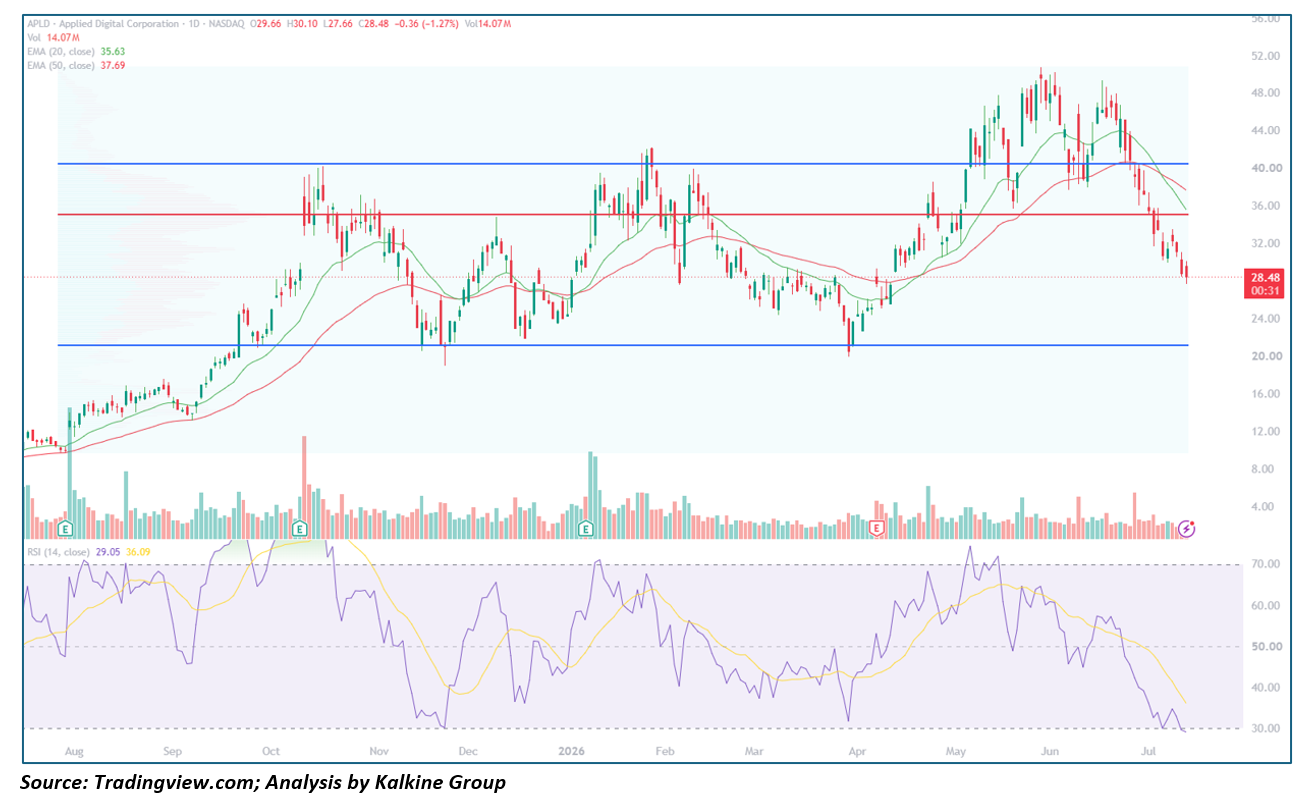
- APLD trading at $28.48, down 1.27% ($0.36) on volume of 14.07M shares, after ranging between $27.66 and $30.10.
- Price remains below both the 20-day EMA ($35.63) and the 50-day EMA ($37.69).
- RSI has dropped to roughly 29.1, with the signal line at 36.1 — solidly in oversold territory.
- APLD spent October 2025 through April 2026 consolidating in a wide range roughly between $20 and $40, broke out sharply from April to a peak near $52 in June, and has since fallen all the way back into that prior range.
- Today's decline continues a multi-week slide that has undone virtually all of the April–June breakout.
Trend Structure APLD's advance from its long base was one of the sharpest in the group, but the reversal has been just as dramatic — price has given back the entire breakout move and is now back inside the range that contained it for six months. With RSI already oversold, the stock is at a pivotal juncture.
Key Technical Levels
Resistance
- $36.00 – Former range midpoint, now resistance
- $37.69 – 50-day EMA
- $40.00 – Upper boundary of prior range
- ~$52.00 – June 2026 high
Support
- $24.00 – Lower boundary of prior range
- $27.66 – Today's low
Outlook APLD's retreat into its old range effectively erases the April–June breakout on the chart. Holding above the $24 lower boundary would keep the stock within its long-term range structure; a break below it would mark a much more serious technical failure.
This analysis is based on daily chart technical indicators (20/50-day EMAs, RSI-14) and price action as of July 14, 2026, and is intended for informational purposes only — not investment advice.


 Nov 19, 2026





 Please wait processing your request...