
 CA
 NZ
 UK
 AU
 IND

 US

 Share
 X (Formerly Twitter)
 Whatsapp
 Facebook
 LinkedIn
 Telegram
 Email This Article
 Copy Link
 Summarize with AI
 Chat GPT
 Perplexity

Key Highlights
- Three Sectors in Leading: Financials (XLF), Communication Services (XLC) and Technology (XLK) are positioned in Leading.
- Utilities Remains Improving: XLU is the only sector in the Improving quadrant, indicating recovering relative momentum.
- Three Sectors in Weakening: Energy (XLE), Materials (XLB) and Health Care (XLV) remain in Weakening.
- Four Sectors in Lagging: Real Estate (XLRE), Consumer Staples (XLP), Industrials (XLI) and Consumer Discretionary (XLY) remain in Lagging.
- Technology Moves Into Leading: XLK has moved above the horizontal axis, representing an improvement in its RRG position despite falling 1.41% during the session.
- Communication Services Shows Strong Positioning: XLC gained 0.60%, the strongest daily performance, while remaining firmly positioned in Leading.
- Energy Weakens Despite Its Recent Strength: XLE declined 0.58% and remains in Weakening, highlighting the difference between daily performance and broader relative momentum.
- Market Leadership Remains Concentrated: Only three of the 11 sectors are positioned in Leading, while four remain in Lagging.
The latest US sector momentum visualization for 10 September 2026 shows three sectors in Leading, one in Improving, three in Weakening and four in Lagging. The RRG configuration indicates continued rotation within the US Equity market, with Technology moving into Leading while Utilities remains in Improving. At the same time, Energy, Materials and Health Care remain in Weakening, while Real Estate, Consumer Staples, Industrials and Consumer Discretionary occupy the Lagging quadrant. The latest positioning highlights a market in which relative momentum remains uneven despite daily performance differences across sectors.
Momentum Breakdown by Quadrant
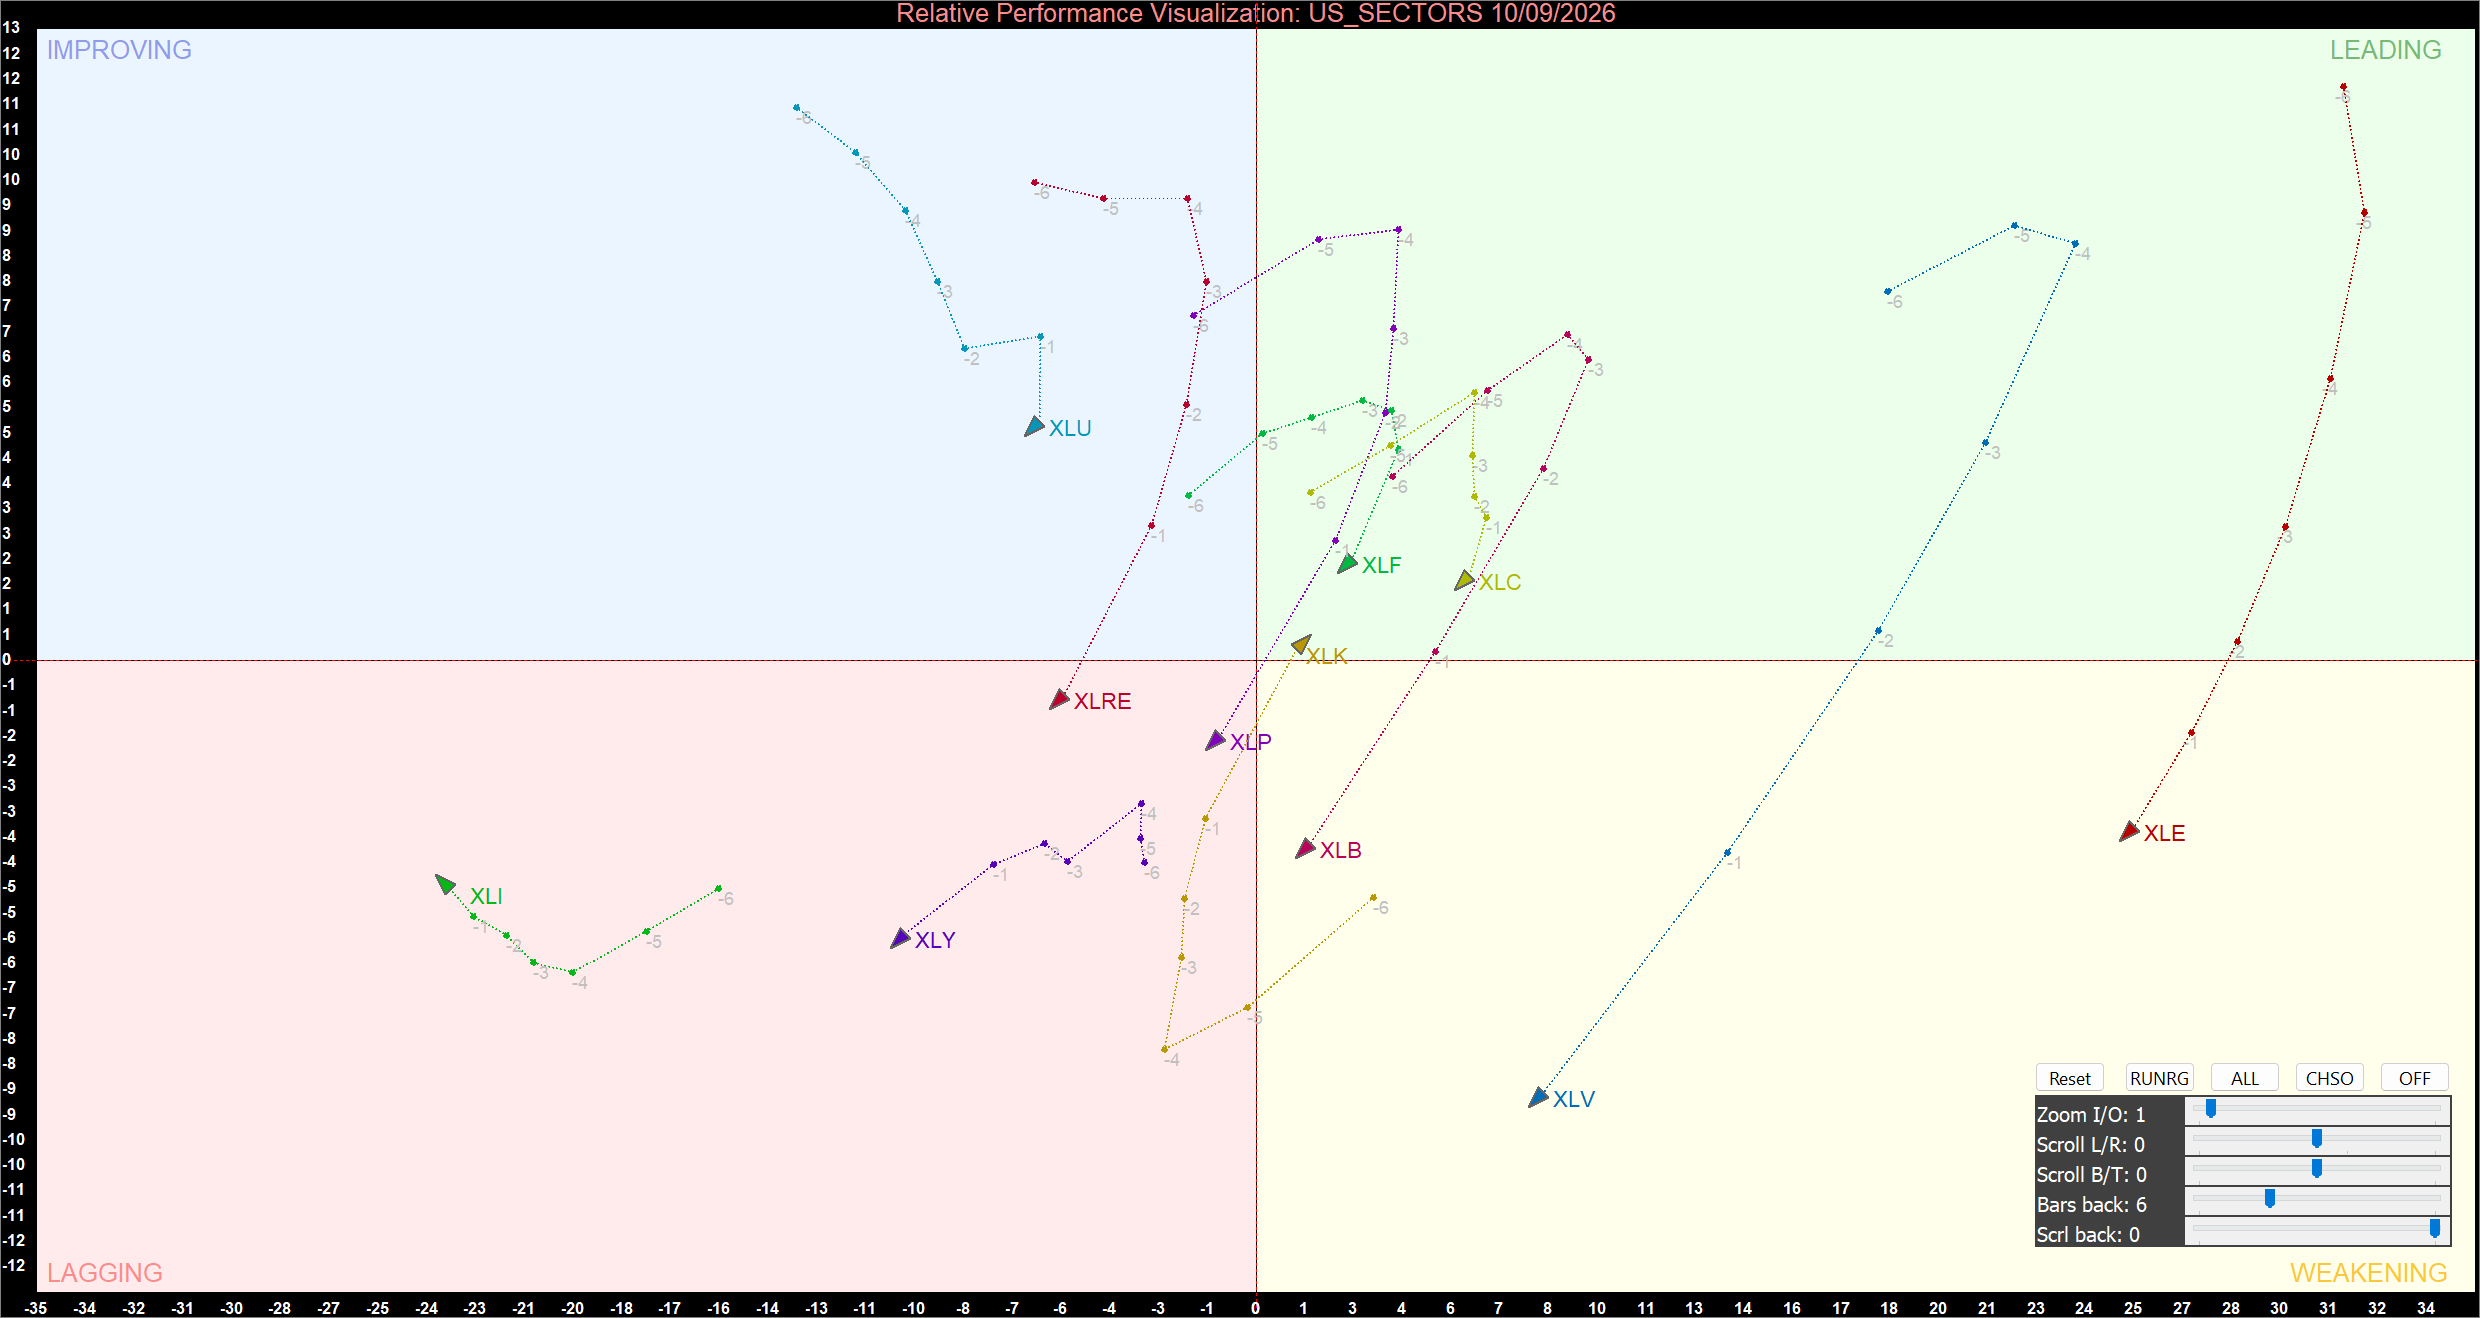
US Sector Relative Momentum Chart (at the closing price of 10/09/2026). Powered by: amibroker.com.
Leading: Financials, Communication Services and Technology
Financials (XLF), Communication Services (XLC) and Technology (XLK) are positioned in the Leading quadrant, indicating stronger relative momentum compared with the broader group of US sectors. The chart shows these three sectors positioned above the horizontal axis and to the right of the vertical axis, confirming that they currently maintain positive relative strength and momentum.
Communication Services was the strongest daily performer on 10 September, gaining 0.60%. Its positive return further supports its favourable positioning within the sector group. The combination of positive daily performance and a Leading RRG position makes XLC one of the most important sectors to monitor for continued leadership.
Financials declined 0.33% during the session but remained in Leading. This demonstrates that RRG positioning does not depend on whether a sector records a positive return on a single day. Instead, the quadrant reflects broader relative performance and momentum. Financials therefore continue to demonstrate comparatively strong positioning despite the modest daily decline.
Technology (XLK) is the most notable development within the Leading quadrant. The sector declined 1.41%, making it the weakest daily performer among the 11 sectors, yet its RRG position has moved into Leading. This divergence highlights the importance of distinguishing between short-term price performance and broader relative momentum. A continued move further into the Leading quadrant would strengthen the evidence that Technology's relative position is improving.
Improving: Utilities
Utilities (XLU) is the only sector positioned in the Improving quadrant. The chart places XLU to the left of the vertical axis but above the horizontal axis, indicating that its relative momentum is recovering even though its relative strength has not yet reached the Leading quadrant.
Utilities declined 0.98% during the latest session, meaning its Improving classification is not based on positive daily performance. Instead, the RRG position indicates that the sector is showing signs of improving relative momentum compared with the broader sector group.
The direction of future movement will be important. A continued movement toward the upper-right would increase the probability of Utilities transitioning into Leading. Conversely, a Reversal toward the lower-left would weaken the current improvement and increase the possibility of a return to Lagging.
Weakening: Energy, Materials and Health Care
Energy (XLE), Materials (XLB) and Health Care (XLV) remain in the Weakening quadrant. These sectors are positioned to the right of the vertical axis but below the horizontal axis, indicating that they continue to show relatively strong positioning but deteriorating momentum.
Energy is particularly notable because it has recently demonstrated strong daily performance. However, XLE declined 0.58% on 10 September and remains in Weakening on the RRG chart. This demonstrates the distinction between a sector's performance during an individual Trading session and its broader momentum trajectory.
Materials (XLB) declined 1.23%, making it the second-weakest sector during the session, while Health Care (XLV) fell 0.55%. Both remain below the horizontal axis in Weakening. Continued movement toward the lower-left would indicate further deterioration and could eventually result in a transition into Lagging.
The positioning of these three sectors suggests that previously stronger areas are losing relative momentum. This is particularly important for Energy because its recent strength has not yet translated into a sustained improvement in its RRG position.
Lagging: Real Estate, Consumer Staples, Industrials and Consumer Discretionary
Four sectors are currently positioned in Lagging: Real Estate (XLRE), Consumer Staples (XLP), Industrials (XLI) and Consumer Discretionary (XLY). These sectors are located below the horizontal axis and to the left of the vertical axis, indicating weaker relative strength and momentum.
Real Estate declined 0.83% on 10 September, while Consumer Staples gained a modest 0.05%. Despite Consumer Staples' positive daily performance, its RRG position remains in Lagging. This again highlights that a positive one-day return does not necessarily indicate an immediate improvement in broader relative momentum.
Industrials (XLI) fell 0.72%, while Consumer Discretionary (XLY) declined 0.44%. Both remain in the lower-left quadrant. Their current positions indicate that these sectors continue to experience weaker relative momentum compared with the stronger areas of the market.
The continued presence of Industrials and Consumer Discretionary in Lagging suggests that economically sensitive areas remain under pressure. A sustained move toward the upper-right would be required to provide evidence of a meaningful recovery in their relative positioning.
Technology Becomes a Key Sector to Watch
The most important change in the latest RRG chart is Technology's position in Leading. This is particularly interesting because XLK recorded a 1.41% decline, the largest daily loss among the 11 sectors.
The apparent contradiction is important for interpreting RRG analysis. A sector can decline on a particular day while still improving its relative momentum if other sectors are performing even worse over the relevant measurement period. The reference analysis similarly emphasises that Leading status does not necessarily require positive daily performance.
Technology's move into Leading therefore deserves close attention. If XLK continues moving further into the upper-right portion of the chart, it would provide stronger confirmation of improving relative strength and momentum. However, a reversal back below the horizontal axis would weaken this signal.
Leadership Remains Concentrated
The overall RRG configuration continues to show relatively narrow leadership. Only three sectors are positioned in Leading, while four sectors remain in Lagging. This means that the market does not yet display broad-based strength across the sector universe.
The structure also reveals an important rotation dynamic. Technology has moved into Leading, while Energy, Materials and Health Care remain in Weakening. Utilities is attempting to recover through Improving, whereas Industrials, Consumer Discretionary, Real Estate and Consumer Staples remain in Lagging.
This configuration suggests that sector leadership is continuing to evolve rather than becoming broadly established. The next phase of the rotation will depend on whether Improving sectors can move into Leading and whether Weakening sectors deteriorate further into Lagging.
Strategic Summary
The latest US sector RRG presents a mixed momentum environment, with Financials, Communication Services and Technology positioned in Leading, Utilities in Improving, Energy, Materials and Health Care in Weakening, and Real Estate, Consumer Staples, Industrials and Consumer Discretionary in Lagging.
The most significant development is Technology's move into Leading despite its 1.41% daily decline. This highlights the difference between one-day price performance and broader relative momentum. Communication Services remains particularly strong after gaining 0.60%, while Financials continues to maintain a favourable relative position.
At the same time, Energy, Materials and Health Care remain in Weakening, suggesting that their relative momentum is deteriorating. Utilities is the only sector currently showing an Improving classification and could become an important sector to monitor for a potential transition into Leading.
Overall, leadership remains concentrated, with only three sectors in Leading and four in Lagging. The key development to monitor in the next sessions is whether Technology can maintain its Leading position, whether Utilities advances toward Leading, and whether Energy, Materials and Health Care continue moving toward Lagging. This quadrant structure provides a useful framework for assessing whether the current sector rotation is developing into a broader change in US equity leadership.


 Nov 05, 2026





 Please wait processing your request...