
Key Highlights
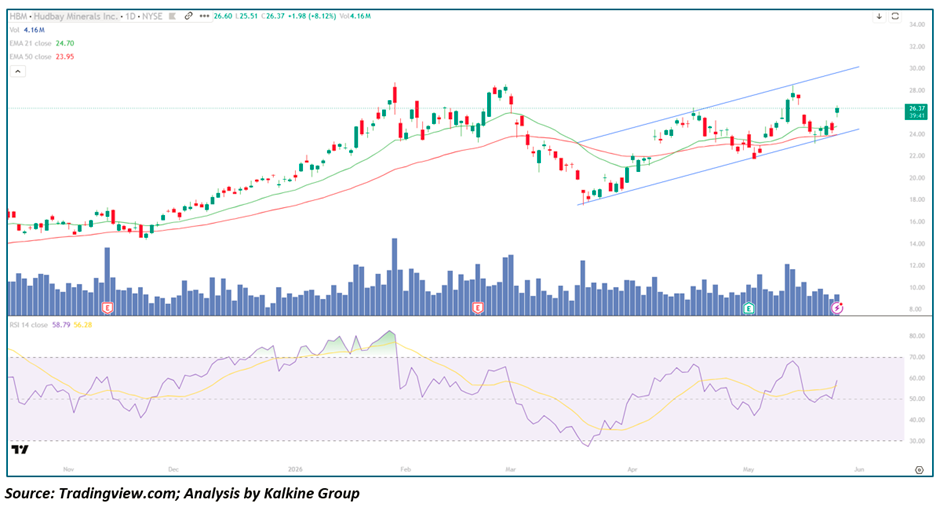
- HBM closed at $26.37, surging +$1.98 (+8.12%) in a powerful breakout session that pushes price decisively toward the February highs
- Price traded between $25.51 and $26.60 intraday, closing near the high of the day — confirming sustained buying pressure throughout the entire session rather than a fade
- EMA-21 ($24.70) and EMA-50 ($23.95) are rising steeply and widely separated — confirming a powerful trend acceleration phase within the broader channel structure
- Price is trading approximately 7% above EMA-21 — reflecting genuine momentum expansion without yet reaching the kind of extreme extension that precedes near-term exhaustion
- RSI-14 at 58.79 with signal at 56.28 — building constructively from mid-range with the main line above the signal line, confirming a fresh bullish crossover and ample runway ahead
- Volume at 4.16M — the most elevated reading in several months, confirming this breakout is backed by genuine institutional conviction rather than thin-market drift
- HBM has advanced from below $19 in early March to current levels — a gain of over 40% in approximately 12 weeks — and today's session suggests the next significant leg higher may already be underway
Trend Structure: A Multi-Phase Journey From Base to Breakout
HBM's chart tells a compelling story of accumulation, expansion, correction, and now re-acceleration — a multi-phase progression that rewards those who understand the structure beneath the noise.
From the November 2025 lows, the stock showed early promise — a gradual uptrend with both EMAs rising steadily and price advancing from the $14–$15 zone toward the $27–$28 region by early February 2026. This was a measured, orderly advance with the EMA-21 acting as reliable dynamic support throughout, and volume providing consistent confirmation of institutional participation at each stage of the move.
That advance was interrupted by a sharp corrective phase in February and March 2026. A significant Reversal from the $27–$28 highs triggered a multi-week pullback that drove RSI-14 toward the 30 zone — the most oversold reading on the entire chart — and pushed price back toward the $18–$19 region. Critically, this correction did not break the broader bull structure. It was a reset, not a reversal. Price found its footing precisely at the lower boundary of what would become a well-defined rising channel, and the buyers returned with conviction.
What followed was equally important. From that March low, HBM constructed one of the cleanest channel advances visible in the current market — a disciplined, structured recovery contained within two ascending blue trendlines that provided clear entry and exit reference points at every stage. Today's session breaks decisively from the upper boundary of that channel, a development of significant technical importance.
Phase 1 — Steady Uptrend &Amp; Base Expansion (Nov 2025 – Jan 2026)
HBM entered the chart period already in a constructive uptrend from the $13–$14 zone:
- Both EMAs rising steadily and in bullish alignment throughout the period
- Price respected the EMA-21 as dynamic support on every meaningful pullback
- Volume consistent and supportive, with a notable Earnings-related spike in November confirming institutional activity
- The advance from $14 to $27 was measured and orderly — the hallmark of genuine accumulation rather than speculative excess
- RSI-14 reached overbought territory near 70 in January–February, signalling peak momentum before the corrective phase
This phase established HBM as a legitimate trending stock with institutional backing and a clear fundamental catalyst in rising copper prices.
Phase 2 — Sharp Corrective Reset (Feb – Mar 2026)
Following the initial advance, HBM underwent its deepest corrective phase:
- Price retraced sharply from the $27–$28 highs toward the $18–$19 zone — erasing approximately one third of the prior advance
- RSI-14 fell to approximately 30 — the most deeply oversold reading on the entire chart — marking peak seller exhaustion
- An earnings event in late February coincided with the heaviest volume bar in the chart's history, suggesting the correction was driven by a fundamental disappointment or sector-wide de-risking
- Price found support precisely at the lower boundary of the rising channel, a level that would prove structurally significant in the weeks that followed
- Both EMAs flattened and converged as the correction progressed, temporarily compressing the bullish spread
The severity and speed of the reset flushed out weak hands comprehensively and created the conditions for a powerful recovery phase.
Phase 3 — Channel Advance & Breakout (Apr – May 2026)
From the March low, HBM constructed a textbook channel advance before today's decisive breakout:
- Price advanced steadily from $19 through $22, $24, and now $26 within the two ascending trendlines
- Both EMAs turned higher decisively, rising in bullish alignment beneath price with the spread between them widening
- An earnings event in late April provided a mid-channel acceleration catalyst, producing one of the largest volume sessions of the recovery phase
- Pullbacks throughout the channel were consistently orderly, holding above the rising EMA-21 and lower channel boundary
- Today's +8.12% session on volume of 4.16M breaks above the upper channel boundary and retests the February highs — a technical breakout of the first order
Moving Averages: Bullish Alignment Strengthening With Each Session
EMA-21 ($24.70)
- Rising at a healthy and sustained angle — the steepest slope since the initial November 2025 uptrend phase
- Sits approximately 7% below current price, reflecting genuine momentum without extreme extension
- Has acted as reliable dynamic support during every pullback within the April–May channel advance
- A return to this level on any corrective session would represent an entirely constructive and buyable pullback
EMA-50 ($23.95)
- Turning higher decisively after the flattening caused by the February–March correction
- The gap between EMA-21 and EMA-50 is narrow at just $0.75 but widening with each passing session — a signal that trend velocity is building
- Sits approximately 9% below current price, confirming the recovery of structural momentum
- Represents the ultimate support line for the broader bull thesis — a close below this level would require a fundamental reassessment
The bullish EMA stack — price well above EMA-21, EMA-21 above EMA-50, both rising — is as clean a trend confirmation as the chart has produced since the initial November advance.
Momentum Analysis: RSI-14 Building From Mid-Range — The Most Attractive Setup on the Chart
RSI-14 at 58.79 with the signal line at 56.28 is one of the most constructive momentum configurations available in Technical Analysis. The main line sits above the signal line — a fresh bullish crossover — and both are advancing from the mid-50s with significant room to travel before reaching the overbought zone above 70.
Current RSI-14 behaviour suggests:
- Momentum is building from a healthy mid-range position — this is not a stock where RSI is already stretched and vulnerable to a near-term reversal
- The current RSI reading of 58.79 is virtually identical to where RSI was during the most powerful phase of the November–January uptrend, before it pushed above 70
- The bullish crossover of the main line above the signal line aligns precisely with today's price breakout — timing confirmation that adds conviction to the signal
- Prior cycles in this chart show that RSI advancing from the mid-range through 70 and above has consistently coincided with the strongest and most sustained price advances
- The absence of overbought conditions means new buyers are not chasing an extended move — they are entering at a technically reasonable juncture
Traders should watch for RSI-14 approaching the 70 zone as momentum reaches its next peak — that is historically where the pace of advance moderates and consolidation becomes more likely.
Volume Analysis: 4.16M Shares — The Breakout Has Institutional Backing
Today's volume of 4.16M shares is among the most elevated single-session readings in the entire chart and arrives at precisely the moment it carries maximum technical significance — a breakout above the upper channel boundary and a retest of the February highs.
Key observations include:
- The November earnings spike established the initial institutional interest in HBM at an early stage of the advance
- The February earnings event produced the heaviest volume in the chart's history, coinciding with the peak of the initial advance and the beginning of the correction — a reminder that volume at extremes can signal both breakouts and reversals
- The April earnings catalyst re-ignited institutional activity within the channel and provided the mid-advance fuel that kept the structure intact
- Today's volume of 4.16M represents a decisive step-up from the Average Daily Volume of recent weeks — a clear signal that today's session is not a routine advance
- Down-days throughout the channel advance have consistently registered lighter volume than up-days — the defining characteristic of a healthy, institutionally supported uptrend
- No heavy-volume reversal session is visible — distribution, if present, is not yet detectable in the volume structure
Key Technical Levels
Resistance Levels
- $26.60–$27.00 — today's intraday high and the February 2026 prior highs — immediate and critical resistance zone
- $28.00–$28.50 — upper channel extension target and next major technical ceiling
- $30.00 — major psychological resistance level
- $32–$34 — longer-term bull case if the February highs are cleared convincingly and copper thematic accelerates
Support Levels
- $25.50–$25.75 — immediate session floor and first intraday support
- EMA-21 at $24.70 — primary dynamic support and key pullback buy zone
- $23.95 — EMA-50 and secondary structural support
- $22.50 — lower channel boundary and major structural support zone
- $19.00–$20.00 — March lows and ultimate bull thesis defence line
Scenario Analysis
- Bullish Continuation (Primary Case)
After today's powerful breakout session, HBM sustains above the $25.50–$26.00 zone and follows through toward the February highs: → A clean close above $27.00 would confirm the breakout from both the channel and the prior high resistance — a technical development that historically triggers accelerated institutional buying → RSI-14 advancing toward 70 would validate the renewed momentum phase and signal the next overbought reading is approaching → Measured move from the channel width points to the $28.50–$30.00 region as the primary upside target on a multi-week horizon → Copper macro tailwinds and continued institutional accumulation support the primary case
- Consolidation Near Highs (Constructive Outcome)
Following today's sharp advance, a period of healthy digestion develops: → Price oscillates between $24.50–$27.00 for 1–3 weeks while RSI-14 cycles constructively in the 50–65 range → EMA-21 rises toward $25.50–$26.00, reducing the extension and tightening the base beneath price → A flag, pennant, or tight consolidation from current levels would represent a high-conviction continuation pattern and set up the next powerful breakout leg → No thesis damage while price holds above the EMA-21 at $24.70
- Mean Reversion Pullback (Risk Case)
Profit-taking from momentum participants who entered near the March lows triggers a sharper correction: → First downside target at EMA-21 near $24.70 — a level that has attracted buyers consistently throughout the channel advance → A close below the EMA-21 on elevated volume would shift near-term bias to neutral and require reassessment → The $23.95 EMA-50 and lower channel boundary near $22.50 represent the broader structural support zone → Provided price holds above the EMA-50, the broader bull thesis remains fully intact — this would remain a correction within an uptrend, not a trend reversal
The Bear Case: Prior Highs Represent Real Overhead Supply
The February $27–$28 highs are not just a technical resistance level — they represent a zone where many participants who bought the initial advance are sitting at or near breakeven after the correction. The willingness of those holders to sell into strength near prior highs creates genuine overhead supply that should not be dismissed:
- Any failure to close above $27.00 on a weekly basis could trigger a fresh wave of selling from prior-high buyers exiting at breakeven
- RSI-14, while not yet overbought, has room to reach elevated levels quickly on a continued advance — monitoring for any divergence between new price highs and lower RSI peaks will be critical
- Copper is a macro-sensitive Commodity — any deterioration in global growth expectations, China Demand signals, or USD strength could rapidly reverse the fundamental tailwind driving institutional flows
- The channel breakout, while technically significant, requires follow-through confirmation over the coming sessions — a single strong day does not guarantee continuation
Conclusion: HBM Is Staging One of the Most Technically Compelling Breakouts in the Metals Space — Respect the Structure, Manage the Risk
Hudbay Minerals has delivered a textbook multi-phase technical progression — steady uptrend, deep corrective reset, disciplined channel recovery, and now a decisive upper channel breakout on the highest volume in months. The confluence of factors supporting this move is exceptional: rising EMAs in bullish alignment, RSI-14 building constructively from mid-range with significant runway remaining, volume surging to 4.16M on the breakout session, and price reclaiming the February high zone that defined the prior advance.
However, the proximity to significant overhead supply at the $27.00 prior highs demands respect. The breakout is technically compelling — but it requires confirmation. A close above $27.00 on sustained volume over the coming sessions would transform today's move from a promising breakout attempt into a confirmed trend extension with a clear measured move target toward $28.50–$30.00.
The framework moving forward is clear:
- Above $25.50–$26.00 → bullish momentum dominant, channel breakout intact, target $27.00 prior highs
- Above $27.00 → prior resistance clears, momentum expansion toward $28.50–$30.00 opens
- Above $30.00 → psychological breakout, structural bull case for continued expansion toward $32–$34
- Below EMA-21 at $24.70 → near-term caution, monitor for distribution signals and channel re-entry
- Below EMA-50 at $23.95 → broader channel thesis under review, reassess position sizing
For momentum traders and copper-thematic investors, HBM represents precisely the kind of technically well-structured opportunity that active managers seek — a high-


 Please wait processing your request...